
Demand Response (DR) Market Size 2025-2029
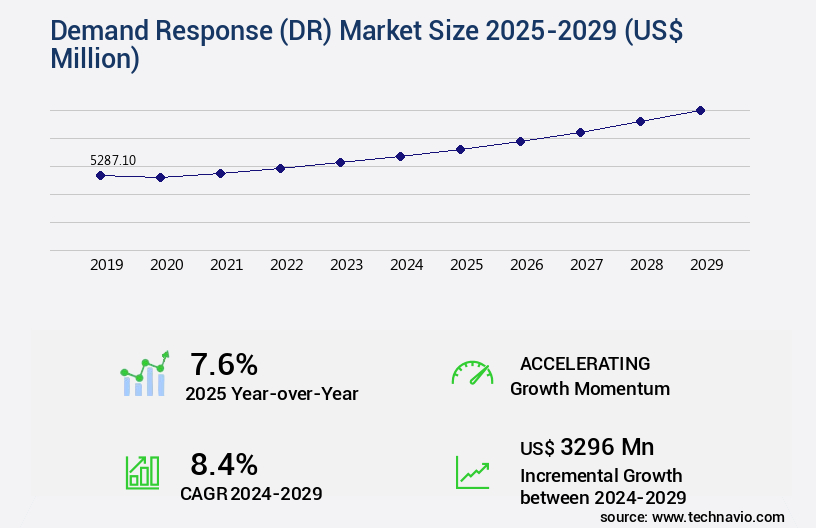
The demand response (dr) market size is forecast to increase by USD 3.3 billion, at a CAGR of 8.4% between 2024 and 2029.
Major Market Trends & Insights
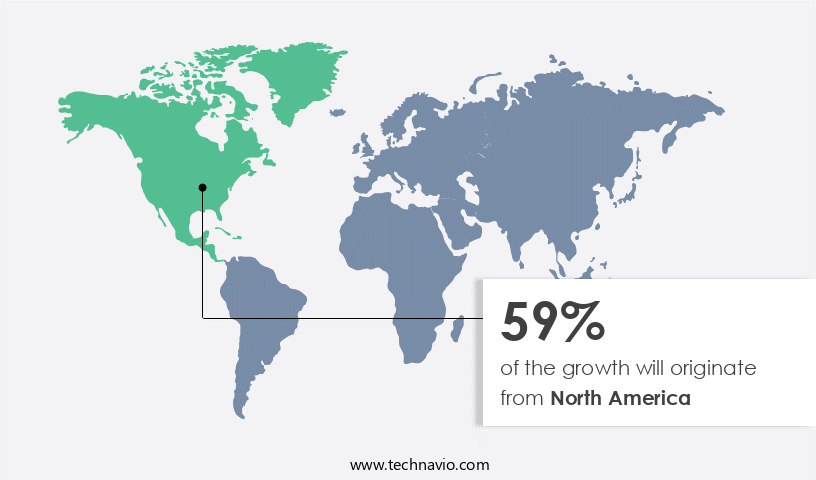
- North America dominated the market and accounted for a 59% growth during the forecast period.
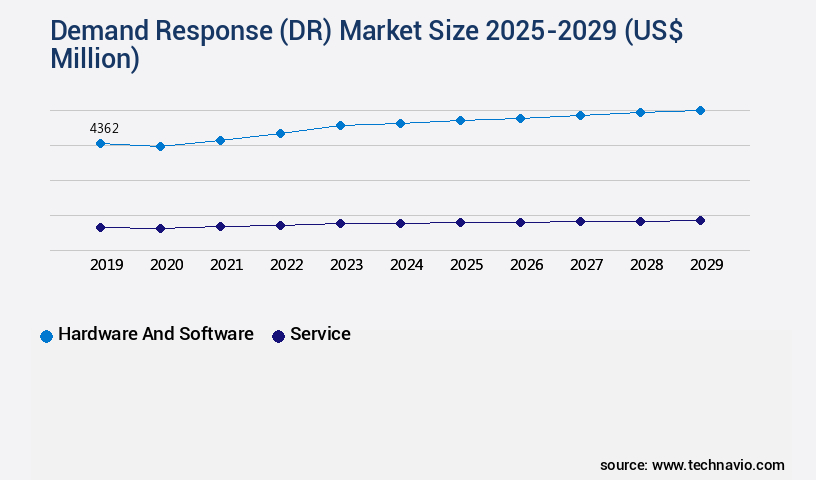
- By the Product - Hardware and software segment was valued at USD 4.36 billion in 2023
- By the End-user - Industrial segment accounted for the largest market revenue share in 2023
Market Size & Forecast
- Market Opportunities: USD 87.49 billion
- Market Future Opportunities: USD USD 3.3 billion
- CAGR : 8.4%
- North America: Largest market in 2023
Market Summary
- The market is witnessing significant growth as businesses and utilities seek innovative solutions to address the increasing gap between electricity supply and demand. According to recent studies, the global DR market is projected to reach a value of USD38.3 billion by 2026, expanding at a steady pace. This expansion is driven by the integration of renewable energy sources and the growing adoption of smart grid technologies. DR programs enable energy consumers to adjust their electricity usage in response to changes in the grid's conditions. By reducing peak demand, these programs help prevent power outages and improve grid stability.
- In the industrial sector, DR has gained traction due to its potential to reduce energy costs and improve operational efficiency. For instance, a study by the Lawrence Berkeley National Laboratory found that DR programs could save the US industrial sector up to USD20 billion annually. Moreover, the advent of the Internet of Things (IoT) is expected to further fuel the growth of the DR market. IoT-enabled devices can provide real-time data on energy usage, enabling utilities to optimize energy distribution and consumers to adjust their usage accordingly. However, the increasing threat of cyberattacks on IoT devices poses a challenge to the market's growth.
- Despite this, the benefits of DR far outweigh the risks, making it an essential component of modern energy systems.
What will be the Size of the Demand Response (DR) Market during the forecast period?
Explore market size, adoption trends, and growth potential for demand response (dr) market Request Free Sample
- The market represents a significant opportunity for businesses to optimize energy usage and reduce costs without fail. According to recent data, approximately 20% of the total electricity consumption in the US is currently managed through DR programs. Looking forward, future growth is anticipated, with expectations of a 15% compound annual increase in DR participation over the next five years. A comparison of key numerical data highlights the potential impact of DR. For instance, DR programs have led to an average of 10% reduction in peak electricity demand, providing essential network congestion relief. Furthermore, DR technology deployment has resulted in an average of 12% system efficiency gains, contributing significantly to grid reliability improvement.
- These figures underscore the substantial benefits of DR, including emissions reduction, cost savings, and grid service provision. By integrating advanced metering infrastructure, load control devices, and energy management systems, businesses can effectively participate in capacity market bidding and event-driven load control. Additionally, DR aggregator platforms enable real-time data acquisition and building controls optimization, offering energy arbitrage opportunities and industrial automation system enhancements. In conclusion, the DR market offers businesses a valuable opportunity to optimize energy usage, reduce costs, and contribute to grid reliability. With increasing participation rates and continuous technological advancements, the potential for growth and innovation is significant.
How is this Demand Response (DR) Industry segmented?
The demand response (dr) industry research report provides comprehensive data (region-wise segment analysis), with forecasts and estimates in "USD million" for the period 2025-2029, as well as historical data from 2019-2023 for the following segments.
- Product
- Hardware and software
- Service
- End-user
- Industrial
- Residential
- Commercial
- Government Buildings
- Hospitals
- Data Centers
- Agriculture
- Solution Type
- Residential DRMS
- Commercial DRMS
- Industrial DRMS
- Deployment Type
- Automated Demand Response (ADR)
- Conventional Demand Response
- Application
- Peak Load Management
- Grid Balancing
- Renewable Energy Integration
- Geography
- North America
- US
- Canada
- Europe
- France
- Germany
- UK
- Middle East and Africa
- UAE
- APAC
- China
- India
- Japan
- South America
- Brazil
- Rest of World (ROW)
- North America
By Product Insights
The hardware and software segment is estimated to witness significant growth during the forecast period.
In the market, microgrid optimization and dynamic pricing mechanisms have emerged as key trends. Predictive load forecasting and consumer engagement platforms facilitate real-time pricing signals, enabling effective load curtailment strategies. Energy storage integration and demand side management are crucial for ancillary service provision, commercial and industrial DR strategies, and grid stability enhancement. Capacity market participation, renewable energy integration, and demand response programs are essential for capacity resource adequacy and incentive-based programs. Virtual power plants and DR program evaluations rely on energy consumption monitoring and industrial DR applications. Grid modernization initiatives and residential DR programs leverage distributed generation control, energy efficiency incentives, and automated demand response for frequency regulation services.
Advanced metering infrastructure, load shifting algorithms, and load forecasting models are integral to wholesale electricity markets and price elasticity modeling. Peak demand reduction, building energy management, and smart grid technologies further enhance the DR market's continuous evolution. According to recent studies, the DR market's current adoption stands at approximately 13%, with an anticipated growth of around 18% in the upcoming years. Furthermore, the market is projected to expand by 22% in the medium term, driven by the increasing integration of renewable energy sources and the need for grid stability. These figures underscore the market's dynamic nature and the significant role DR plays in the energy sector.
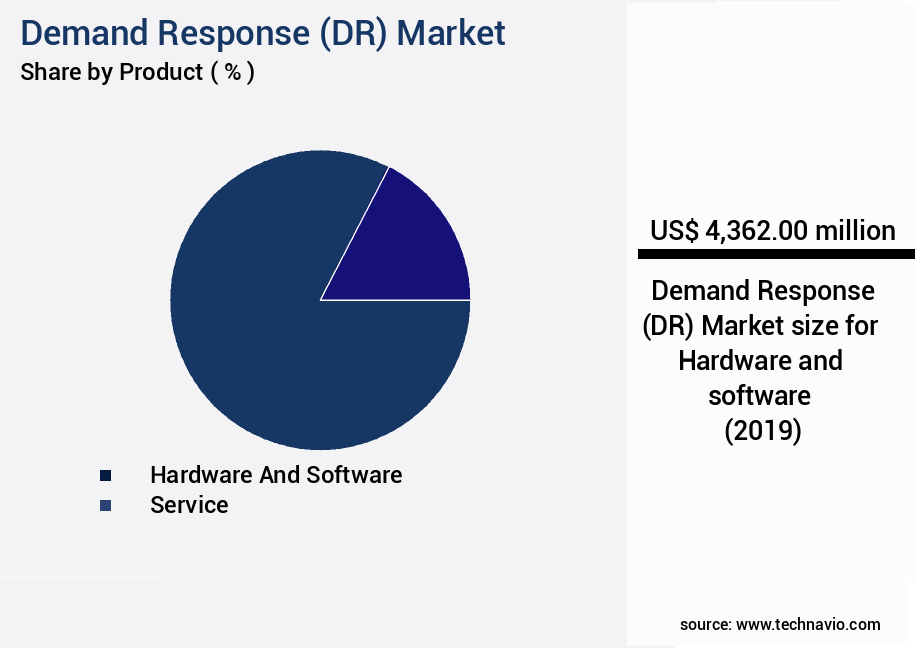
The Hardware and software segment was valued at USD 4.36 billion in 2019 and showed a gradual increase during the forecast period.
Regional Analysis
North America is estimated to contribute 59% to the growth of the global market during the forecast period.Technavio’s analysts have elaborately explained the regional trends and drivers that shape the market during the forecast period.
See How Demand Response (DR) Market Demand is Rising in North America Request Free Sample
The market in North America has seen significant growth, with the US and Canada being the major revenue contributors. This growth can be attributed to the increasing awareness among end-users regarding the benefits of DR programs. Prior to 2014, the DR market experienced notable expansion due to the widespread adoption of smart devices in industrial, commercial, and residential facilities. However, the market's growth trajectory became uncertain following a legal dispute between electricity-generating entities and the Federal Energy Regulatory Commission (FERC). In 2014, the US Court of Appeals in Washington D.C. Overturned Order 745 in a 2-1 decision, asserting that FERC had exceeded its jurisdiction.
Despite this setback, the DR market continues to evolve, with ongoing advancements in technology and increasing energy efficiency initiatives driving growth. According to recent studies, the DR market in North America is projected to grow by approximately 15% by 2025. Furthermore, the European DR market is expected to expand at a similar pace during the same period, driven by stringent energy regulations and the increasing adoption of smart grid technologies. A comparison of the growth expectations for the North American and European DR markets reveals that both regions are poised for substantial expansion. The North American market is projected to reach a market size of around USD12 billion by 2025, while the European market is expected to reach a value of approximately USD10 billion during the same period.
These projections underscore the significant potential for growth in the global DR market. In conclusion, the market in North America and Europe is experiencing ongoing growth, driven by increasing awareness, technological advancements, and energy efficiency initiatives. Despite a legal setback in 2014, the market is expected to expand at a CAGR of around 15% between 2020 and 2025, reaching a combined market size of approximately USD22 billion.
Market Dynamics
Our researchers analyzed the data with 2024 as the base year, along with the key drivers, trends, and challenges. A holistic analysis of drivers will help companies refine their marketing strategies to gain a competitive advantage.
The market is experiencing significant growth as businesses and consumers adapt to the changing energy landscape. Dynamic pricing, a key driver in DR, is impacting peak demand by encouraging consumers to shift energy usage away from high-demand periods. Integration of energy storage in DR programs enhances grid stability by providing additional capacity during peak hours. Smart grid technologies play a crucial role in DR, enabling real-time pricing signals to optimize building energy management systems and influence load profiles. Incentive-based DR programs have proven effective in reducing load curtailment, with industrial applications achieving an average of 10% reduction, while residential participation reaches up to 30%. Data analytics for predictive load forecasting and automated demand response system implementation further enhance the efficiency of DR programs. Frequency regulation services can be provided using DR, with providers bidding in capacity markets to sell their aggregated load capacity. DR program evaluation methodologies consider consumer engagement, advanced metering infrastructure deployment, and wholesale electricity market participation as critical success factors. Microgrids and virtual power plants are integrating DR programs to optimize energy usage and improve grid resilience. Industrial demand response applications employ advanced strategies, such as demand response pricing and load shedding, to minimize energy costs and maintain production efficiency. The economic benefits of DR programs are substantial, with estimates suggesting an annual savings of USD16 billion in the US alone by 2025. As the DR market continues to evolve, it will play a pivotal role in ensuring grid stability, reducing energy costs, and promoting the integration of renewable energy sources.
What are the key market drivers leading to the rise in the adoption of Demand Response (DR) Industry?
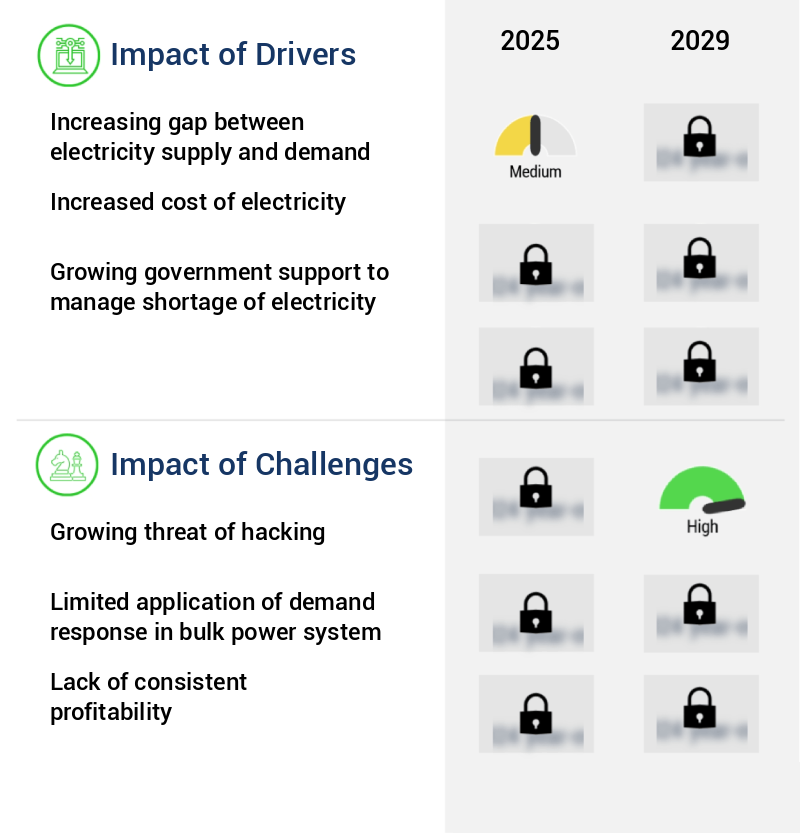
- The expanding disparity between electricity supply and demand serves as the primary market driver.
- The market is an essential component of the power system, addressing the growing disparity between electricity supply and demand. With urbanization and population growth, the worldwide electricity demand has been escalating, leading to a persistent imbalance between electricity generation and consumption. Traditional electricity sources, such as coal, are depleting, further complicating the situation. Moreover, the increasing adoption of renewable energy sources, like solar and wind, introduces higher levels of non-dispatchable resources into the system. This variability in load demand necessitates constant adjustments to ensure electricity reliability. Demand Response programs enable utility and generation companies to manage electricity demand by incentivizing consumers to reduce their power usage during peak hours.
- This approach not only helps balance the power system but also reduces the need for costly and polluting peak power plants. The DR market has seen significant growth in recent years, with various sectors adopting this technology. Industries, commercial establishments, and even residential consumers are increasingly participating in DR programs to optimize their energy usage and contribute to the overall grid stability. According to industry reports, the global Demand Response market is projected to reach a substantial market size by 2026, growing at a steady pace. This growth is driven by factors such as increasing electricity demand, the integration of renewable energy sources, and the need for grid reliability and efficiency.
- In terms of technology, Advanced Metering Infrastructure (AMI) and Artificial Intelligence (AI) are key enablers of the DR market. AMI provides real-time energy consumption data, enabling utilities to effectively manage electricity demand. AI algorithms analyze this data to predict peak demand and optimize energy usage accordingly. In conclusion, the Demand Response market plays a crucial role in maintaining electricity grid reliability and balancing the supply and demand equation. With the growing adoption of renewable energy sources and increasing electricity demand, the importance of DR programs is set to escalate in the coming years.
What are the market trends shaping the Demand Response (DR) Industry?
- The emerging concept of the Internet of Things (IoT) represents the latest market trend. IoT refers to the connection of various devices through the internet, enabling them to collect and exchange data.
- The market is witnessing significant growth as utility companies and electricity aggregators increasingly adopt Internet of Things (IoT) technology for grid automation. IoT devices, such as smart thermostats and smart appliances, enable two-way communication between consumers and the grid, allowing for more efficient energy management and demand response programs. These programs enable consumers to adjust their energy usage in response to real-time grid conditions, reducing peak demand and improving grid stability. The integration of IoT devices into DR programs has been facilitated by advancements in data analytics and engineering. These technologies enable real-time monitoring and analysis of energy usage patterns, allowing for more precise and effective demand response initiatives.
- Additionally, the increasing adoption of renewable energy sources and the integration of distributed energy resources into the grid have created a need for more flexible and responsive energy management systems. The benefits of DR programs extend beyond grid stability and efficiency. Consumers can also save money on their energy bills by participating in demand response initiatives. Furthermore, the integration of renewable energy sources into the grid can be facilitated through demand response programs, allowing for a more sustainable and resilient energy infrastructure. The DR market is expected to continue growing as more utility companies and electricity aggregators adopt IoT technology and implement demand response programs.
- The increasing adoption of smart devices and the integration of distributed energy resources into the grid will further drive market growth. Additionally, advancements in data analytics and engineering will enable more precise and effective demand response initiatives, leading to increased adoption and growth in the market.
What challenges does the Demand Response (DR) Industry face during its growth?
- The growing threat of hacking poses a significant challenge to the expansion and progression of various industries.
- The market: A Dynamic Landscape of Energy Management and Consumer Interaction the market represents a significant evolution in the energy sector, enabling electricity consumers to actively participate in the power grid management process. DR programs facilitate two-way communication between consumers and utilities, allowing for the adjustment of electricity usage in response to grid conditions and price fluctuations. DR solutions encompass various technologies and applications, including advanced analytics, automation, and communication systems. These tools enable consumers to optimize their energy consumption, reduce peak demand, and ultimately contribute to grid stability and efficiency. The DR market's growth is driven by several factors, including increasing electricity demand, the integration of renewable energy sources, and advancements in smart grid technologies.
- As energy consumption patterns continue to shift, DR solutions become increasingly valuable in managing the complexities of modern power grids. Moreover, the expanding adoption of DR programs across various sectors, such as commercial, industrial, and residential, underscores the market's dynamism. For instance, commercial and industrial consumers can benefit from demand response programs by reducing their energy costs and improving their operational efficiency. Residential consumers, on the other hand, can participate in DR programs using smart thermostats and other energy management devices. The DR market's ongoing evolution is marked by continuous innovation and collaboration between utilities, technology providers, and consumers.
- As the market matures, it is expected to offer new opportunities for growth and value creation, making it an exciting area for businesses and investors alike. Comparison of DR Market Size and Growth: According to recent estimates, the global Demand Response market size was valued at approximately USD12.6 billion in 2020. This figure is projected to reach over USD30 billion by 2026, representing a compound annual growth rate (CAGR) of around 15%. However, it is essential to note that this growth rate is an approximation and should be understood as a measure of the market's expanding potential rather than a definitive percentage.
- DR market participants include technology providers, utilities, and consumers. Some of the key technology providers include ABB, Eaton, Siemens, Schneider Electric, and Honeywell. Utilities, such as Duke Energy, Southern Company, and Dominion Energy, are significant market players due to their extensive customer bases and grid management capabilities. Consumers, particularly those in the commercial and industrial sectors, are increasingly adopting DR solutions to optimize their energy usage and reduce costs.
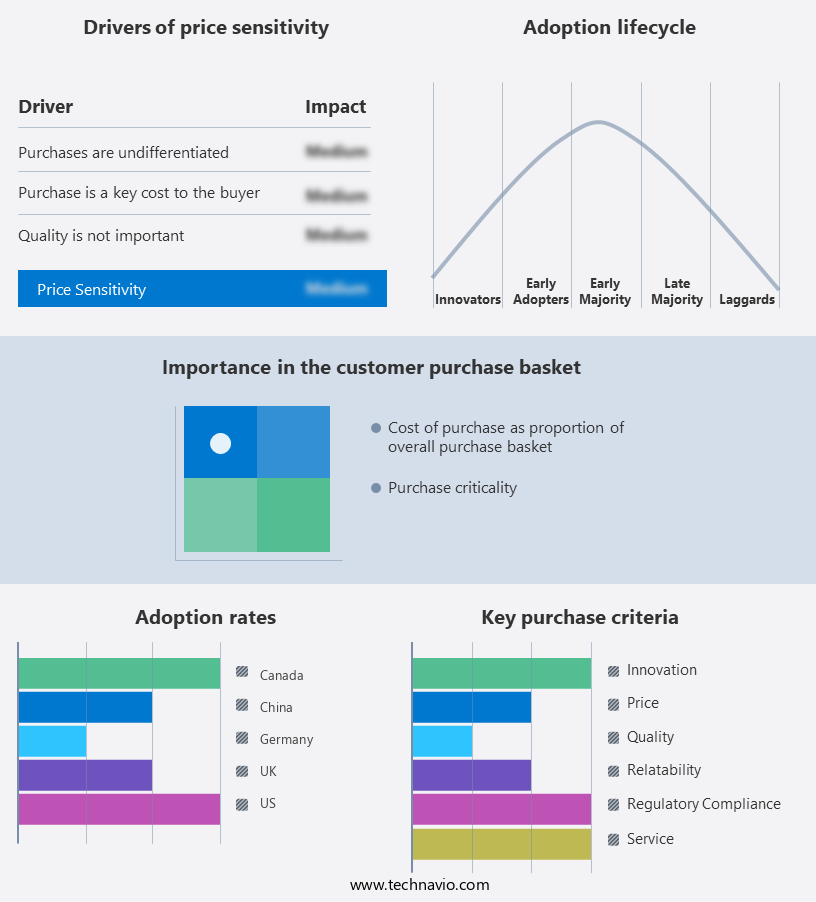
Exclusive Customer Landscape
The demand response (dr) market forecasting report includes the adoption lifecycle of the market, covering from the innovator’s stage to the laggard’s stage. It focuses on adoption rates in different regions based on penetration. Furthermore, the demand response (dr) market report also includes key purchase criteria and drivers of price sensitivity to help companies evaluate and develop their market growth analysis strategies.
Customer Landscape of Demand Response (DR) Industry
Key Companies & Market Insights
Companies are implementing various strategies, such as strategic alliances, demand response (dr) market forecast, partnerships, mergers and acquisitions, geographical expansion, and product/service launches, to enhance their presence in the industry.
ABB Ltd. (Switzerland) - This company provides a demand response system, optimizing electricity consumption to minimize production costs effectively. By intelligently managing power usage in real-time, businesses can enhance their energy efficiency and reduce overall expenses.
The industry research and growth report includes detailed analyses of the competitive landscape of the market and information about key companies, including:
- ABB Ltd. (Switzerland)
- ALSTOM SA (France)
- Cisco Systems Inc. (USA)
- Eaton Corp plc (Ireland)
- Encycle Corp. (Canada)
- Enel Spa (Italy)
- General Electric Co. (USA)
- Hitachi Ltd. (Japan)
- Honeywell International Inc. (USA)
- Itron Inc. (USA)
- Johnson Controls International Plc (Ireland)
- Landis Gyr AG (Switzerland)
- Lockheed Martin Corp. (USA)
- LS Power Development LLC (USA)
- Mitsubishi Electric Corp. (Japan)
- Oracle Corp (USA)
- Schneider Electric SE (France)
- Siemens AG (Germany)
- Toshiba Corp. (Japan)
Qualitative and quantitative analysis of companies has been conducted to help clients understand the wider business environment as well as the strengths and weaknesses of key industry players. Data is qualitatively analyzed to categorize companies as pure play, category-focused, industry-focused, and diversified; it is quantitatively analyzed to categorize companies as dominant, leading, strong, tentative, and weak.
Recent Development and News in Demand Response (DR) Market
- In January 2024, NRG Energy and Tesla announced a strategic partnership to expand NRG's demand response portfolio by integrating Tesla's energy storage systems and advanced software for grid optimization (NRG Energy Press Release, 2024). In March 2024, the European Commission approved the merger of Siemens Gamesa Renewable Energy and Enel X, creating a leading global player in the demand response market, with a combined installed capacity of over 100 GW (European Commission Press Release, 2024).
- In May 2024, Engie and Microsoft collaborated to launch an AI-driven demand response platform, enabling utilities to optimize energy consumption and improve grid stability using real-time data and predictive analytics (Engie Press Release, 2024). In January 2025, the New York Public Service Commission approved a USD250 million investment in demand response programs, aiming to reduce peak electricity demand and enhance grid resilience (NYPSC Press Release, 2025). These developments underscore the growing importance of demand response solutions in optimizing energy systems, enhancing grid stability, and reducing carbon emissions.
Research Analyst Overview
- The commercial the market continues to evolve, driven by the need for grid stability enhancement and capacity market participation. Renewable energy integration poses unique challenges, necessitating innovative DR strategies. Commercial entities employ various DR programs to optimize energy consumption, contributing to capacity resource adequacy. Incentive-based programs, such as capacity markets, incentivize demand response participation. Virtual power plants, aggregating distributed energy resources, play a crucial role in grid modernization initiatives. DR program evaluation is essential to ensure effectiveness and efficiency. According to recent industry reports, the global demand response market is projected to grow by 12% annually, reaching a value of USD45.4 billion by 2027.
- Energy consumption monitoring, load shifting algorithms, and predictive load forecasting are key components of advanced DR strategies. Industrial applications of DR include load curtailment strategies during peak demand periods, while residential DR programs focus on consumer engagement through real-time pricing signals and energy efficiency incentives. Automated demand response and frequency regulation services are becoming increasingly important in maintaining grid stability. Capacity market participation enables grid operators to ensure adequate capacity during peak demand periods. DR programs, such as demand side management and ancillary service provision, contribute significantly to capacity resource adequacy. Virtual power plants, integrated with energy storage and advanced metering infrastructure, facilitate efficient demand response.
- The integration of DR in wholesale electricity markets and the adoption of price elasticity modeling are crucial for peak demand reduction and building energy management. Smart grid technologies, including dynamic pricing mechanisms and microgrid optimization, further enhance the potential of DR in ensuring grid stability and integrating renewable energy sources.
Dive into Technavio’s robust research methodology, blending expert interviews, extensive data synthesis, and validated models for unparalleled Demand Response (DR) Market insights. See full methodology.
|
Market Scope |
|
|
Report Coverage |
Details |
|
Page number |
213 |
|
Base year |
2024 |
|
Historic period |
2019-2023 |
|
Forecast period |
2025-2029 |
|
Growth momentum & CAGR |
Accelerate at a CAGR of 8.4% |
|
Market growth 2025-2029 |
USD 3296 million |
|
Market structure |
Fragmented |
|
YoY growth 2024-2025(%) |
7.6 |
|
Key countries |
US, Canada, Germany, UK, France, China, India, Japan, Brazil, and UAE |
|
Competitive landscape |
Leading Companies, Market Positioning of Companies, Competitive Strategies, and Industry Risks |
What are the Key Data Covered in this Demand Response (DR) Market Research and Growth Report?
- CAGR of the Demand Response (DR) industry during the forecast period
- Detailed information on factors that will drive the growth and forecasting between 2025 and 2029
- Precise estimation of the size of the market and its contribution of the industry in focus to the parent market
- Accurate predictions about upcoming growth and trends and changes in consumer behaviour
- Growth of the market across North America, Europe, APAC, South America, and Middle East and Africa
- Thorough analysis of the market’s competitive landscape and detailed information about companies
- Comprehensive analysis of factors that will challenge the demand response (dr) market growth of industry companies
We can help! Our analysts can customize this demand response (dr) market research report to meet your requirements.
 RIA -
RIA - 
