Electrolyzers Market Analysis APAC, Europe, North America, South America, Middle East and Africa - US, China, Japan, Germany, UK - Size and Forecast 2024-2028

Electrolyzers Market Analysis APAC, Europe, North America, South America, Middle East and Africa - US, China, Japan, Germany, UK - Size and Forecast 2024-2028

Published: Feb 2024 179 Pages SKU: IRTNTR76023

Market Overview at a Glance

$1.00 B
Market Opportunity
26.71%
CAGR
25.05
YoY growth 2023-2024(%)

Electrolyzers Market Size 2024-2028

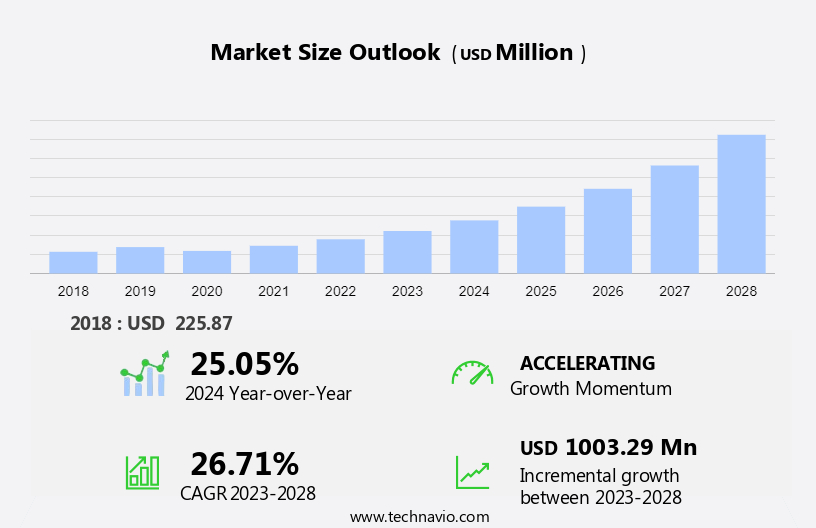
 The electrolyzers market size is forecast to increase by USD 1,003.29 million, at a CAGR of 26.71% between 2023 and 2028. The market growth is driven by the rising demand for hydrogen production as a clean energy source and advancements in electrolyzer technology. Increasing investments in renewable energy projects and government incentives for green hydrogen are also boosting market expansion. The market is witnessing a growing demand for the growing focus on using clean hydrogen in refineries, the increasing partnerships and collaboration among market players, and the rising investments in electrolyzers. Additionally, growing industrial applications for electrolyzers in energy storage and fuel cell technologies further support market growth. The electrolyzers market report includes historic market data from 2018 - 2022.

Market Overview :

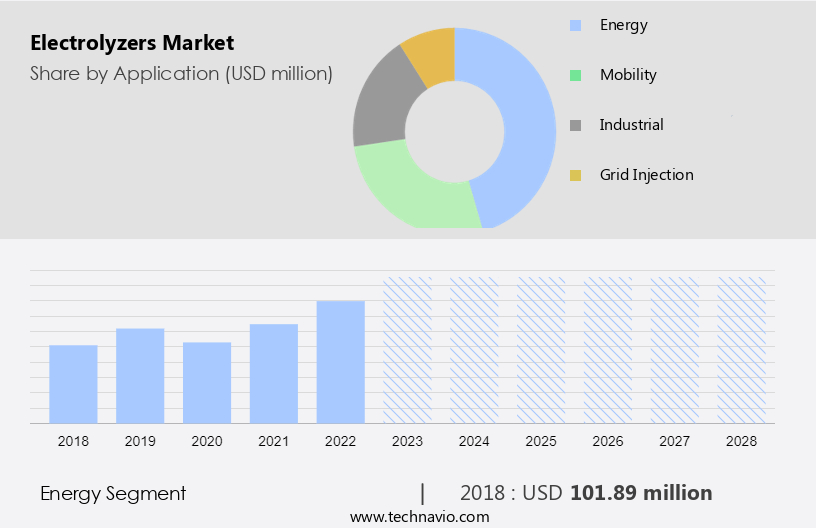
  • Energy is the fastest-growing segment during the forecast year
  • Energy was the largest segment and was valued at USD 101.89 million in 2018.
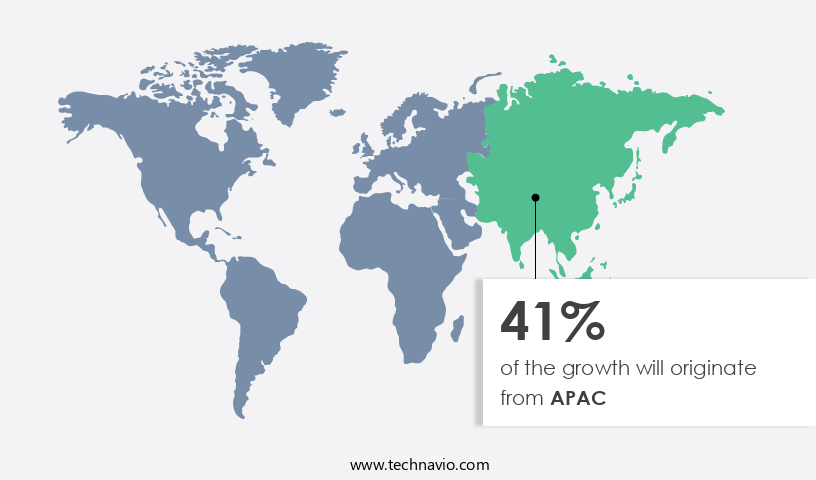
  • APAC is is most dominating region during the forecast period
  • It also includes an in-depth analysis of the upsurge in decarbonization initiatives globally, the growing focus on using clean hydrogen in refineries, and the high cost of production using electrolyzers.

Electrolyzers Market Size

For More Highlights About this Electrolyzers Market Research Report, Download Free Sample in a Minute

Largest-Growing Segments 

Energy

The energy segment is estimated to witness significant growth during the forecast period. This segment is one of the primary applications fuelling the growth of the global market. In addition, with the increasing focus on sustainable and clean solutions, electrolyzers, including hydrogen electrolyzers, play a pivotal role in the production of green hydrogen.  Furthermore, this is produced through water electrolysis, where renewable power sources such as solar, wind, or hydroelectric power are used to generate electricity to power the electrolysis process.

Electrolyzers Market Size

Get a glance at the market contribution of various segments. Download PDF Sample

Moreover, this ensures that the production of this gas is entirely free from carbon emissions, making it an environmentally friendly power carrier. In addition, the produced green hydrogen has versatile applications in the power sector. In addition, one major application is as a fuel for fuel cell systems. Fuel cell technology utilizes these gases to produce electricity through an electrochemical process, with the only byproduct being water vapor. Furthermore, excess electricity generated from renewable sources during peak production periods can be used to power electrolyzers, converting water into hydrogen. Hence, such factors are fuelling the growth of this segment, which in turn drives the market growth during the forecast period.

Regional Analysis

Electrolyzers Market Share by Geography

For more insights on the market share of various regions, Download PDF Sample now!

APAC is estimated to contribute 41% to the growth of the global market during the forecast period. Technavio’s analysts have elaborately explained the regional trends and drivers that shape the market during the forecast period. APAC is home to some of the fastest-growing markets in the world, such as solar and wind power. In addition, the abundant and relatively low cost of these resources in the region makes APAC an attractive market for electrolyzers, as electrolyzers can utilize renewable electricity to produce this gas. Moreover, many countries in APAC, including Japan, South Korea, China, and Australia, have announced these strategies and policies to promote the adoption of electrolyzers and green hydrogen production. Furthermore, these policies include subsidies, incentives, and targets for electrolyzer deployment and production. In addition, electrolyzers can help industries in APAC reduce their dependence on imported fossil fuels by producing this from domestically available sources such as solar and wind power. Hence, such factors are driving the market growth in APAC during the forecast period.

Electrolyzers Market Dynamics

Major Market Trends

A growing focus on using clean hydrogen in refineries is an emerging electrolyzers market trend. Refineries are under pressure to decarbonize their operations to align with global climate goals and address increasing concerns about air pollution and greenhouse gas emissions. In addition, electrolyzers enable refineries to produce this gas with zero or low emissions when powered by renewable electricity.

Moreover, by replacing fossil fuel-derived with this gas, refineries can significantly reduce their carbon footprint and environmental impact. In addition, the refining industry is one of the major users of this gas. Refineries require large quantities of this for various processes, such as hydrocracking, hydrotreating, and catalytic reforming. Hence, such factors are driving electrolyzers market growth during the forecast period.

Key Market Drivers

Upsurge in decarbonization initiatives globally is notably driving the market growth. There is a rising global focus on reducing carbon emissions, resulting in a surge in demand for these gases. In addition, electrolyzers, particularly PEM and alkaline electrolyzers, are crucial for producing this gas from renewable energy sources such as wind and solar.

Moreover, as the demand for this gas increases, there is a trend toward scaling up electrolyzer capacity. In addition, manufacturers are investing in larger electrolyzer systems to meet the needs of industries such as transportation, chemical production, and power storage. Furthermore, these gases are widely used in the transport industry owing to its numerous environmental benefits, including the elimination of urban air pollution and the reduction of overall carbon dioxide emissions into the atmosphere.  Hence, such factors are driving electrolyzers market growth during the forecast period.

Significance Market Challenges

The high cost of hydrogen production using electrolyzers is a major challenge hindering market growth. This is coupled with renewables, is considered a potentially key fuel source for replacing fossil fuels across power systems. In addition, the widespread usage of this gas as a fuel could reduce emissions from the power, industrial, and transport sectors, which are the major contributors to global emissions. However, a majority of production currently is obtained from processes that emit CO2.

Moreover, owing to their non-polluting nature, electrolyzers are one of the most efficient methods of hydrogen production among all other available technologies. However, electrolysis technology incurs a higher cost than other technologies, including SMR or biomass gasification. Hence, such factors are negatively impacting electrolyzers market growth. Therefore, it is expected to hinder market growth during the forecast period.

Customer Landscape

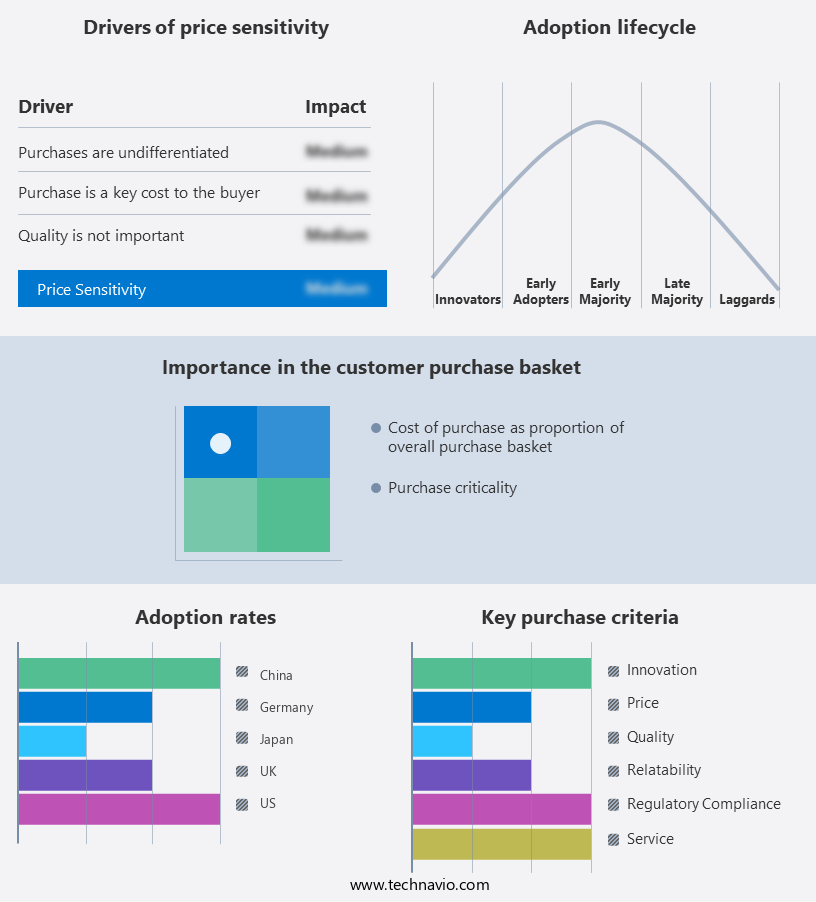
The electrolyzers market research report includes the adoption lifecycle of the market, covering from the innovator’s stage to the laggard’s stage. It focuses on adoption rates in different regions based on penetration. Furthermore, the report also includes key purchase criteria and drivers of price sensitivity to help companies evaluate and develop their growth strategies.

Electrolyzers Market Share by Geography

Customer Landscape

Major Electrolyzers Market Companies

Companies are implementing various strategies, such as strategic alliances, partnerships, mergers and acquisitions, geographical expansion, and product/service launches, to enhance their presence in the market.

Asahi Kasei Corp: The company offers electrolyzers such as Electrolyzer Acilyzer, which has Catholyte side nickel, Anolyte side titanium, Cell tightening device, Catholyte terminal call frame, hydraulic cylinder, and more.

The electrolyzers market forecast research report also includes detailed analyses of the competitive landscape of the market and information about 27 market companies, including:

  • Advanced Ionics
  • Air Liquide SA
  • ALFA LAVAL
  • Bloom Energy Corp.
  • Brise Chemical Pvt. Ltd.
  • Cummins Inc.
  • DENSO Corp.
  • ELECTRIC HYDROGEN
  • Enapter S.r.l.
  • General Electric Co.
  • ITM Power plc
  • John Cockerill
  • Kobe Steel Ltd.
  • LONGi Green Energy Technology Co. Ltd.
  • MAN Energy Solutions SE
  • McPhy Energy SA
  • Nel ASA
  • Ohmium International Inc.
  • Plug Power Inc.
  • Siemens AG
  • Sunfire GmbH
  • Sungrow Power Supply Co. Ltd.
  • Teledyne Technologies Inc.
  • thyssenkrupp AG
  • Topsoe AS
  • Verdagy

Qualitative and quantitative analysis of companies has been conducted to help clients understand the wider business environment as well as the strengths and weaknesses of key market players. Data is qualitatively analyzed to categorize companies as pure play, category-focused, industry-focused, and diversified; it is quantitatively analyzed to categorize companies as dominant, leading, strong, tentative, and weak.

Segment Overview

The electrolyzers market report forecasts market growth by revenue at global, regional & country levels and provides a market growth analysis of the latest trends and growth opportunities from 2018 to 2028. 

  • Application Outlook
    • Energy
    • Mobility
    • Industrial
    • Grid injection
  • Technology Outlook
    • Alkaline electrolyzers
    • Proton exchange membrane
    • Solid oxide
    • Anion exchange membrane
  • Region Outlook
    • North America
      • The U.S.
      • Canada
    • Europe
      • The U.K.
      • Germany
      • France
      • Rest of Europe
    • APAC
      • China
      • India
    • South America
      • Chile
      • Argentina
      • Brazil
    • Middle East & Africa
      • Saudi Arabia
      • South Africa
      • Rest of the Middle East & Africa

Market Analyst Overview

The electrolyzers market is witnessing a surge in demand driven by the urgent need for low-carbon energy solutions and the growing focus on green hydrogen production. Electrolyzer-based green ammonia production is gaining traction, particularly in fertilizer production, as it offers a pathway to carbon-free ammonia. Market dynamics are influenced by the increasing adoption of these gas and green ammonia technologies, leveraging excess renewable energy to produce clean fuels. However, challenges persist due to the intermittency of power sources, which depend on factors like weather conditions, time of day, and geographical location.

Electrolyzer systems play a crucial role in harnessing solar and wind power to produce green hydrogen and oxygen. The market's growth depends on power availability, hydrogen production rates, and productivity. Moreover, as nations strive for net zero emissions and intensify emissions reduction efforts, electrolyzers emerge as pivotal components in mitigating greenhouse gases. Various stakeholders, including educational institutions, cities, financial institutions, and the Race to Zero initiative, are driving investment in electrolyzer infrastructure to support these markets and build resilient support structures for a sustainable future.

Electrolyzers Market Scope

Report Coverage

Details

Base year

2023

Historic period

2018 - 2022

Forecast period

2024-2028

Growth momentum & CAGR

Accelerate at a CAGR of 26.71%

Market Growth 2024-2028

USD 1,003.29 million

Market structure

Fragmented

YoY growth 2023-2024(%)

25.05

Regional analysis

APAC, Europe, North America, South America, and Middle East and Africa

Performing market contribution

APAC at 41%

Key countries

US, China, Japan, Germany, and UK

Competitive landscape

Leading Companies, Market Positioning of Companies, Competitive Strategies, and Industry Risks

Key companies profiled

Advanced Ionics, Air Liquide SA, ALFA LAVAL, Asahi Kasei Corp., Bloom Energy Corp., Brise Chemical Pvt. Ltd., Cummins Inc., DENSO Corp., ELECTRIC HYDROGEN, Enapter S.r.l., General Electric Co., ITM Power plc, John Cockerill, Kobe Steel Ltd., LONGi Green Energy Technology Co. Ltd., MAN Energy Solutions SE, McPhy Energy SA, Nel ASA, Ohmium International Inc., Plug Power Inc., Siemens AG, Sunfire GmbH, Sungrow Power Supply Co. Ltd., Teledyne Technologies Inc., thyssenkrupp AG, Topsoe AS, and Verdagy

Market dynamics

Parent market analysis, Market forecasting, Market growth inducers and obstacles, Fast-growing and slow-growing segment analysis, COVID-19 impact and recovery analysis and future consumer dynamics, and Market condition analysis for the forecast period.

Customization purview

If our report has not included the data that you are looking for, you can reach out to our analysts and get segments customized.

Download PDF Sample

What are the Key Data Covered in this Electrolyzers Market Research Report?

  • CAGR of the market during the forecast period
  • Detailed information on factors that will drive the growth of the market between 2023 and 2028
  • Precise estimation of the market  size and its contribution to the market in focus on the parent market
  • Accurate predictions about upcoming trends and changes in consumer behavior
  • Growth of the market across APAC, Europe, North America, South America, and the Middle East and Africa
  • Thorough market growth and forecasting analysis of the market’s competitive landscape and detailed information about companies
  • Comprehensive market research and growth analysis of factors that will challenge the growth of market companies

We can help! Our analysts can customize this electrolyzers market research report to meet your requirements. 

Get in touch

1 Executive Summary

  • 1.1 Market overview
    • Exhibit 01: Executive Summary – Chart on Market Overview
    • Exhibit 02: Executive Summary – Data Table on Market Overview
    • Exhibit 03: Executive Summary – Chart on Global Market Characteristics
    • Exhibit 04: Executive Summary – Chart on Market by Geography
    • Exhibit 05: Executive Summary – Chart on Market Segmentation by Application
    • Exhibit 06: Executive Summary – Chart on Market Segmentation by Technology
    • Exhibit 07: Executive Summary – Chart on Incremental Growth
    • Exhibit 08: Executive Summary – Data Table on Incremental Growth
    • Exhibit 09: Executive Summary – Chart on Vendor Market Positioning

2 Market Landscape

  • 2.1 Market ecosystem
    • Exhibit 10: Parent market
    • Exhibit 11: Market Characteristics

3 Market Sizing

  • 3.1 Market definition
    • Exhibit 12: Offerings of vendors included in the market definition
  • 3.2 Market segment analysis
    • Exhibit 13: Market segments
  • 3.3 Market size 2023
    • 3.4 Market outlook: Forecast for 2023-2028
      • Exhibit 14: Chart on Global - Market size and forecast 2023-2028 ($ million)
      • Exhibit 15: Data Table on Global - Market size and forecast 2023-2028 ($ million)
      • Exhibit 16: Chart on Global Market: Year-over-year growth 2023-2028 (%)
      • Exhibit 17: Data Table on Global Market: Year-over-year growth 2023-2028 (%)

    4 Historic Market Size

    • 4.1 Global electrolyzers market 2018 - 2022
      • Exhibit 18: Historic Market Size – Data Table on global electrolyzers market 2018 - 2022 ($ million)
    • 4.2 Application Segment Analysis 2018 - 2022
      • Exhibit 19: Historic Market Size – Application Segment 2018 - 2022 ($ million)
    • 4.3 Technology Segment Analysis 2018 - 2022
      • Exhibit 20: Historic Market Size – Technology Segment 2018 - 2022 ($ million)
    • 4.4 Geography Segment Analysis 2018 - 2022
      • Exhibit 21: Historic Market Size – Geography Segment 2018 - 2022 ($ million)
    • 4.5 Country Segment Analysis 2018 - 2022
      • Exhibit 22: Historic Market Size – Country Segment 2018 - 2022 ($ million)

    5 Five Forces Analysis

    • 5.1 Five forces summary
      • Exhibit 23: Five forces analysis - Comparison between 2023 and 2028
    • 5.2 Bargaining power of buyers
      • Exhibit 24: Chart on Bargaining power of buyers – Impact of key factors 2023 and 2028
    • 5.3 Bargaining power of suppliers
      • Exhibit 25: Bargaining power of suppliers – Impact of key factors in 2023 and 2028
    • 5.4 Threat of new entrants
      • Exhibit 26: Threat of new entrants – Impact of key factors in 2023 and 2028
    • 5.5 Threat of substitutes
      • Exhibit 27: Threat of substitutes – Impact of key factors in 2023 and 2028
    • 5.6 Threat of rivalry
      • Exhibit 28: Threat of rivalry – Impact of key factors in 2023 and 2028
    • 5.7 Market condition
      • Exhibit 29: Chart on Market condition - Five forces 2023 and 2028

    6 Market Segmentation by Application

    • 6.1 Market segments
      • Exhibit 30: Chart on Application - Market share 2023-2028 (%)
      • Exhibit 31: Data Table on Application - Market share 2023-2028 (%)
    • 6.2 Comparison by Application
      • Exhibit 32: Chart on Comparison by Application
      • Exhibit 33: Data Table on Comparison by Application
    • 6.3 Energy - Market size and forecast 2023-2028
      • Exhibit 34: Chart on Energy - Market size and forecast 2023-2028 ($ million)
      • Exhibit 35: Data Table on Energy - Market size and forecast 2023-2028 ($ million)
      • Exhibit 36: Chart on Energy - Year-over-year growth 2023-2028 (%)
      • Exhibit 37: Data Table on Energy - Year-over-year growth 2023-2028 (%)
    • 6.4 Mobility - Market size and forecast 2023-2028
      • Exhibit 38: Chart on Mobility - Market size and forecast 2023-2028 ($ million)
      • Exhibit 39: Data Table on Mobility - Market size and forecast 2023-2028 ($ million)
      • Exhibit 40: Chart on Mobility - Year-over-year growth 2023-2028 (%)
      • Exhibit 41: Data Table on Mobility - Year-over-year growth 2023-2028 (%)
    • 6.5 Industrial - Market size and forecast 2023-2028
      • Exhibit 42: Chart on Industrial - Market size and forecast 2023-2028 ($ million)
      • Exhibit 43: Data Table on Industrial - Market size and forecast 2023-2028 ($ million)
      • Exhibit 44: Chart on Industrial - Year-over-year growth 2023-2028 (%)
      • Exhibit 45: Data Table on Industrial - Year-over-year growth 2023-2028 (%)
    • 6.6 Grid injection - Market size and forecast 2023-2028
      • Exhibit 46: Chart on Grid injection - Market size and forecast 2023-2028 ($ million)
      • Exhibit 47: Data Table on Grid injection - Market size and forecast 2023-2028 ($ million)
      • Exhibit 48: Chart on Grid injection - Year-over-year growth 2023-2028 (%)
      • Exhibit 49: Data Table on Grid injection - Year-over-year growth 2023-2028 (%)
    • 6.7 Market opportunity by Application
      • Exhibit 50: Market opportunity by Application ($ million)
      • Exhibit 51: Data Table on Market opportunity by Application ($ million)

    7 Market Segmentation by Technology

    • 7.1 Market segments
      • Exhibit 52: Chart on Technology - Market share 2023-2028 (%)
      • Exhibit 53: Data Table on Technology - Market share 2023-2028 (%)
    • 7.2 Comparison by Technology
      • Exhibit 54: Chart on Comparison by Technology
      • Exhibit 55: Data Table on Comparison by Technology
    • 7.3 Alkaline electrolyzers - Market size and forecast 2023-2028
      • Exhibit 56: Chart on Alkaline electrolyzers - Market size and forecast 2023-2028 ($ million)
      • Exhibit 57: Data Table on Alkaline electrolyzers - Market size and forecast 2023-2028 ($ million)
      • Exhibit 58: Chart on Alkaline electrolyzers - Year-over-year growth 2023-2028 (%)
      • Exhibit 59: Data Table on Alkaline electrolyzers - Year-over-year growth 2023-2028 (%)
    • 7.4 Proton exchange membrane - Market size and forecast 2023-2028
      • Exhibit 60: Chart on Proton exchange membrane - Market size and forecast 2023-2028 ($ million)
      • Exhibit 61: Data Table on Proton exchange membrane - Market size and forecast 2023-2028 ($ million)
      • Exhibit 62: Chart on Proton exchange membrane - Year-over-year growth 2023-2028 (%)
      • Exhibit 63: Data Table on Proton exchange membrane - Year-over-year growth 2023-2028 (%)
    • 7.5 Solid oxide - Market size and forecast 2023-2028
      • Exhibit 64: Chart on Solid oxide - Market size and forecast 2023-2028 ($ million)
      • Exhibit 65: Data Table on Solid oxide - Market size and forecast 2023-2028 ($ million)
      • Exhibit 66: Chart on Solid oxide - Year-over-year growth 2023-2028 (%)
      • Exhibit 67: Data Table on Solid oxide - Year-over-year growth 2023-2028 (%)
    • 7.6 Anion exchange membrane - Market size and forecast 2023-2028
      • Exhibit 68: Chart on Anion exchange membrane - Market size and forecast 2023-2028 ($ million)
      • Exhibit 69: Data Table on Anion exchange membrane - Market size and forecast 2023-2028 ($ million)
      • Exhibit 70: Chart on Anion exchange membrane - Year-over-year growth 2023-2028 (%)
      • Exhibit 71: Data Table on Anion exchange membrane - Year-over-year growth 2023-2028 (%)
    • 7.7 Market opportunity by Technology
      • Exhibit 72: Market opportunity by Technology ($ million)
      • Exhibit 73: Data Table on Market opportunity by Technology ($ million)

    8 Customer Landscape

    • 8.1 Customer landscape overview
      • Exhibit 74: Analysis of price sensitivity, lifecycle, customer purchase basket, adoption rates, and purchase criteria

    9 Geographic Landscape

    • 9.1 Geographic segmentation
      • Exhibit 75: Chart on Market share by geography 2023-2028 (%)
      • Exhibit 76: Data Table on Market share by geography 2023-2028 (%)
    • 9.2 Geographic comparison
      • Exhibit 77: Chart on Geographic comparison
      • Exhibit 78: Data Table on Geographic comparison
    • 9.3 APAC - Market size and forecast 2023-2028
      • Exhibit 79: Chart on APAC - Market size and forecast 2023-2028 ($ million)
      • Exhibit 80: Data Table on APAC - Market size and forecast 2023-2028 ($ million)
      • Exhibit 81: Chart on APAC - Year-over-year growth 2023-2028 (%)
      • Exhibit 82: Data Table on APAC - Year-over-year growth 2023-2028 (%)
    • 9.4 Europe - Market size and forecast 2023-2028
      • Exhibit 83: Chart on Europe - Market size and forecast 2023-2028 ($ million)
      • Exhibit 84: Data Table on Europe - Market size and forecast 2023-2028 ($ million)
      • Exhibit 85: Chart on Europe - Year-over-year growth 2023-2028 (%)
      • Exhibit 86: Data Table on Europe - Year-over-year growth 2023-2028 (%)
    • 9.5 North America - Market size and forecast 2023-2028
      • Exhibit 87: Chart on North America - Market size and forecast 2023-2028 ($ million)
      • Exhibit 88: Data Table on North America - Market size and forecast 2023-2028 ($ million)
      • Exhibit 89: Chart on North America - Year-over-year growth 2023-2028 (%)
      • Exhibit 90: Data Table on North America - Year-over-year growth 2023-2028 (%)
    • 9.6 South America - Market size and forecast 2023-2028
      • Exhibit 91: Chart on South America - Market size and forecast 2023-2028 ($ million)
      • Exhibit 92: Data Table on South America - Market size and forecast 2023-2028 ($ million)
      • Exhibit 93: Chart on South America - Year-over-year growth 2023-2028 (%)
      • Exhibit 94: Data Table on South America - Year-over-year growth 2023-2028 (%)
    • 9.7 Middle East and Africa - Market size and forecast 2023-2028
      • Exhibit 95: Chart on Middle East and Africa - Market size and forecast 2023-2028 ($ million)
      • Exhibit 96: Data Table on Middle East and Africa - Market size and forecast 2023-2028 ($ million)
      • Exhibit 97: Chart on Middle East and Africa - Year-over-year growth 2023-2028 (%)
      • Exhibit 98: Data Table on Middle East and Africa - Year-over-year growth 2023-2028 (%)
    • 9.8 China - Market size and forecast 2023-2028
      • Exhibit 99: Chart on China - Market size and forecast 2023-2028 ($ million)
      • Exhibit 100: Data Table on China - Market size and forecast 2023-2028 ($ million)
      • Exhibit 101: Chart on China - Year-over-year growth 2023-2028 (%)
      • Exhibit 102: Data Table on China - Year-over-year growth 2023-2028 (%)
    • 9.9 US - Market size and forecast 2023-2028
      • Exhibit 103: Chart on US - Market size and forecast 2023-2028 ($ million)
      • Exhibit 104: Data Table on US - Market size and forecast 2023-2028 ($ million)
      • Exhibit 105: Chart on US - Year-over-year growth 2023-2028 (%)
      • Exhibit 106: Data Table on US - Year-over-year growth 2023-2028 (%)
    • 9.10 Germany - Market size and forecast 2023-2028
      • Exhibit 107: Chart on Germany - Market size and forecast 2023-2028 ($ million)
      • Exhibit 108: Data Table on Germany - Market size and forecast 2023-2028 ($ million)
      • Exhibit 109: Chart on Germany - Year-over-year growth 2023-2028 (%)
      • Exhibit 110: Data Table on Germany - Year-over-year growth 2023-2028 (%)
    • 9.11 UK - Market size and forecast 2023-2028
      • Exhibit 111: Chart on UK - Market size and forecast 2023-2028 ($ million)
      • Exhibit 112: Data Table on UK - Market size and forecast 2023-2028 ($ million)
      • Exhibit 113: Chart on UK - Year-over-year growth 2023-2028 (%)
      • Exhibit 114: Data Table on UK - Year-over-year growth 2023-2028 (%)
    • 9.12 Japan - Market size and forecast 2023-2028
      • Exhibit 115: Chart on Japan - Market size and forecast 2023-2028 ($ million)
      • Exhibit 116: Data Table on Japan - Market size and forecast 2023-2028 ($ million)
      • Exhibit 117: Chart on Japan - Year-over-year growth 2023-2028 (%)
      • Exhibit 118: Data Table on Japan - Year-over-year growth 2023-2028 (%)
    • 9.13 Market opportunity by geography
      • Exhibit 119: Market opportunity by geography ($ million)
      • Exhibit 120: Data Tables on Market opportunity by geography ($ million)

    10 Drivers, Challenges, and Trends

    • 10.1 Market drivers
      • 10.2 Market challenges
        • 10.3 Impact of drivers and challenges
          • Exhibit 121: Impact of drivers and challenges in 2023 and 2028
        • 10.4 Market trends

          11 Vendor Landscape

          • 11.1 Overview
            • 11.2 Vendor landscape
              • Exhibit 122: Overview on Criticality of inputs and Factors of differentiation
            • 11.3 Landscape disruption
              • Exhibit 123: Overview on factors of disruption
            • 11.4 Industry risks
              • Exhibit 124: Impact of key risks on business

            12 Vendor Analysis

            • 12.1 Vendors covered
              • Exhibit 125: Vendors covered
            • 12.2 Market positioning of vendors
              • Exhibit 126: Matrix on vendor position and classification
            • 12.3 Asahi Kasei Corp.
              • Exhibit 127: Asahi Kasei Corp. - Overview
              • Exhibit 128: Asahi Kasei Corp. - Business segments
              • Exhibit 129: Asahi Kasei Corp. - Key news
              • Exhibit 130: Asahi Kasei Corp. - Key offerings
              • Exhibit 131: Asahi Kasei Corp. - Segment focus
            • 12.4 Bloom Energy Corp.
              • Exhibit 132: Bloom Energy Corp. - Overview
              • Exhibit 133: Bloom Energy Corp. - Product / Service
              • Exhibit 134: Bloom Energy Corp. - Key news
              • Exhibit 135: Bloom Energy Corp. - Key offerings
            • 12.5 Cummins Inc.
              • Exhibit 136: Cummins Inc. - Overview
              • Exhibit 137: Cummins Inc. - Business segments
              • Exhibit 138: Cummins Inc. - Key offerings
              • Exhibit 139: Cummins Inc. - Segment focus
            • 12.6 Enapter S.r.l.
              • Exhibit 140: Enapter S.r.l. - Overview
              • Exhibit 141: Enapter S.r.l. - Product / Service
              • Exhibit 142: Enapter S.r.l. - Key offerings
            • 12.7 ITM Power plc
              • Exhibit 143: ITM Power plc - Overview
              • Exhibit 144: ITM Power plc - Product / Service
              • Exhibit 145: ITM Power plc - Key offerings
            • 12.8 Kobe Steel Ltd.
              • Exhibit 146: Kobe Steel Ltd. - Overview
              • Exhibit 147: Kobe Steel Ltd. - Business segments
              • Exhibit 148: Kobe Steel Ltd. - Key offerings
              • Exhibit 149: Kobe Steel Ltd. - Segment focus
            • 12.9 MAN Energy Solutions SE
              • Exhibit 150: MAN Energy Solutions SE - Overview
              • Exhibit 151: MAN Energy Solutions SE - Product / Service
              • Exhibit 152: MAN Energy Solutions SE - Key offerings
            • 12.10 McPhy Energy SA
              • Exhibit 153: McPhy Energy SA - Overview
              • Exhibit 154: McPhy Energy SA - Product / Service
              • Exhibit 155: McPhy Energy SA - Key news
              • Exhibit 156: McPhy Energy SA - Key offerings
            • 12.11 Nel ASA
              • Exhibit 157: Nel ASA - Overview
              • Exhibit 158: Nel ASA - Business segments
              • Exhibit 159: Nel ASA - Key offerings
              • Exhibit 160: Nel ASA - Segment focus
            • 12.12 Plug Power Inc.
              • Exhibit 161: Plug Power Inc. - Overview
              • Exhibit 162: Plug Power Inc. - Product / Service
              • Exhibit 163: Plug Power Inc. - Key offerings
            • 12.13 Siemens AG
              • Exhibit 164: Siemens AG - Overview
              • Exhibit 165: Siemens AG - Business segments
              • Exhibit 166: Siemens AG - Key news
              • Exhibit 167: Siemens AG - Key offerings
              • Exhibit 168: Siemens AG - Segment focus
            • 12.14 Sunfire GmbH
              • Exhibit 169: Sunfire GmbH - Overview
              • Exhibit 170: Sunfire GmbH - Product / Service
              • Exhibit 171: Sunfire GmbH - Key offerings
            • 12.15 Teledyne Technologies Inc.
              • Exhibit 172: Teledyne Technologies Inc. - Overview
              • Exhibit 173: Teledyne Technologies Inc. - Business segments
              • Exhibit 174: Teledyne Technologies Inc. - Key news
              • Exhibit 175: Teledyne Technologies Inc. - Key offerings
              • Exhibit 176: Teledyne Technologies Inc. - Segment focus
            • 12.16 thyssenkrupp AG
              • Exhibit 177: thyssenkrupp AG - Overview
              • Exhibit 178: thyssenkrupp AG - Business segments
              • Exhibit 179: thyssenkrupp AG - Key offerings
              • Exhibit 180: thyssenkrupp AG - Segment focus
            • 12.17 Topsoe AS
              • Exhibit 181: Topsoe AS - Overview
              • Exhibit 182: Topsoe AS - Product / Service
              • Exhibit 183: Topsoe AS - Key offerings

            13 Appendix

            • 13.1 Scope of the report
              • 13.2 Inclusions and exclusions checklist
                • Exhibit 184: Inclusions checklist
                • Exhibit 185: Exclusions checklist
              • 13.3 Currency conversion rates for US$
                • Exhibit 186: Currency conversion rates for US$
              • 13.4 Research methodology
                • Exhibit 187: Research methodology
                • Exhibit 188: Validation techniques employed for market sizing
                • Exhibit 189: Information sources
              • 13.5 List of abbreviations
                • Exhibit 190: List of abbreviations

              Research Methodology

              Technavio presents a detailed picture of the market by way of study, synthesis, and summation of data from multiple sources. The analysts have presented the various facets of the market with a particular focus on identifying the key industry influencers. The data thus presented is comprehensive, reliable, and the result of extensive research, both primary and secondary.

              INFORMATION SOURCES

              Primary sources

              • Manufacturers and suppliers
              • Channel partners
              • Industry experts
              • Strategic decision makers

              Secondary sources

              • Industry journals and periodicals
              • Government data
              • Financial reports of key industry players
              • Historical data
              • Press releases

              DATA ANALYSIS

              Data Synthesis

              • Collation of data
              • Estimation of key figures
              • Analysis of derived insights

              Data Validation

              • Triangulation with data models
              • Reference against proprietary databases
              • Corroboration with industry experts

              REPORT WRITING

              Qualitative

              • Market drivers
              • Market challenges
              • Market trends
              • Five forces analysis

              Quantitative

              • Market size and forecast
              • Market segmentation
              • Geographical insights
              • Competitive landscape

              Interested in this report?

              Get your sample now to see our research methodology and insights!

              Download Now

              Frequently Asked Questions

              Electrolyzers market growth will increase by $ 1003.29 mn during 2024-2028.

              The Electrolyzers market is expected to grow at a CAGR of 26.71% during 2024-2028.

              Electrolyzers market is segmented by Application( Energy, Mobility, Industrial, Grid injection) Technology( Alkaline electrolyzers, Proton exchange membrane, Solid oxide, Anion exchange membrane)

              Advanced Ionics, Air Liquide SA, ALFA LAVAL, Asahi Kasei Corp., Bloom Energy Corp., Brise Chemical Pvt. Ltd., Cummins Inc., DENSO Corp., ELECTRIC HYDROGEN, Enapter S.r.l., General Electric Co., ITM Power plc, John Cockerill, Kobe Steel Ltd., LONGi Green Energy Technology Co. Ltd., MAN Energy Solutions SE, McPhy Energy SA, Nel ASA, Ohmium International Inc., Plug Power Inc., Siemens AG, Sunfire GmbH, Sungrow Power Supply Co. Ltd., Teledyne Technologies Inc., thyssenkrupp AG, Topsoe AS, Verdagy are a few of the key vendors in the Electrolyzers market.

              APAC will register the highest growth rate of 41% among the other regions. Therefore, the Electrolyzers market in APAC is expected to garner significant business opportunities for the vendors during the forecast period.

              US, China, Japan, Germany, UK

              • Increasing launch of electrolyzers by vendorsThe introduction of new electrolyzer models or product lines by vendors expands the range of options available to customers. This increased variety allows customers to choose electrolyzers that best fit their specific needs in terms of capacity is the driving factor this market.
              • efficiency is the driving factor this market.
              • technology is the driving factor this market.
              • and cost is the driving factor this market.
              • thereby stimulating the market demand. Vendors target new geographic regions is the driving factor this market.
              • industries is the driving factor this market.
              • or customer segments with their electrolyzer launches is the driving factor this market.
              • thereby expanding the overall market. For example is the driving factor this market.
              • vendors may tailor their products to meet the specific needs of sectors such as transportation is the driving factor this market.
              • industrial manufacturing is the driving factor this market.
              • power generation is the driving factor this market.
              • or energy storage is the driving factor this market.
              • unlocking new growth opportunities and market potentials. In November 2023 is the driving factor this market.
              • ALFA LAVAL is the driving factor this market.
              • a Sweden-based industrial product manufacturer is the driving factor this market.
              • announced the launch of electrolyzer and fuel cell technologies is the driving factor this market.
              • a new business unit aimed at capturing business opportunities in the global transition to clean energy sources. In August 2023 is the driving factor this market.
              • Toyota automotive parts supplier DENSO Corp. announced the commercial launch of a solid-oxide electrolyzer (SOE). Denso announced it would develop an in-house SOE in 2025. In February 2023 is the driving factor this market.
              • LONGi H2 is the driving factor this market.
              • a subsidiary of LONGi Green Energy Technology Co. Ltd. is the driving factor this market.
              • launched its new alkaline electrolyzed water H2 production equipment ALK Hi1. In September 2022 is the driving factor this market.
              • Verdagy is the driving factor this market.
              • a pioneer in scaling electrolyzer technologies is the driving factor this market.
              • launched the commercial electrolyzer module eDynamic. The same year is the driving factor this market.
              • in August is the driving factor this market.
              • Verdagy launched its three-cell 500 kW commercial electrolyzer module at its Moss Landing pilot plant. Each cell incorporates the largest AEMs in the world at 28 is the driving factor this market.
              • 500 cm2. New electrolyzer launches may align with evolving regulatory requirements is the driving factor this market.
              • industry standards is the driving factor this market.
              • and certification processes is the driving factor this market.
              • which will drive the growth of the global electrolyzers market during the forecast period. is the driving factor this market.

              The Electrolyzers market vendors should focus on grabbing business opportunities from the Energy segment as it accounted for the largest market share in the base year.
              RIA - Research AI Assistant
              Ask RIA