Green Hydrogen Market Analysis, Size, and Forecast 2026-2030: APAC (China, India, and Japan), Europe (Germany, France, and UK), North America (US, Canada, and Mexico), Middle East and Africa (Saudi Arabia and UAE), South America (Brazil and Argentina), and Rest of World (ROW)

Green Hydrogen Market Analysis, Size, and Forecast 2026-2030:
APAC (China, India, and Japan), Europe (Germany, France, and UK), North America (US, Canada, and Mexico), Middle East and Africa (Saudi Arabia and UAE), South America (Brazil and Argentina), and Rest of World (ROW)

Published: Dec 2025 289 Pages SKU: IRTNTR73409

Market Overview at a Glance

$113.57 B
Market Opportunity
68.1%
CAGR 2025 - 2030
57.4%
APAC Growth
$2.04 B
Chemical segment 2024

Green Hydrogen Market Size 2026-2030

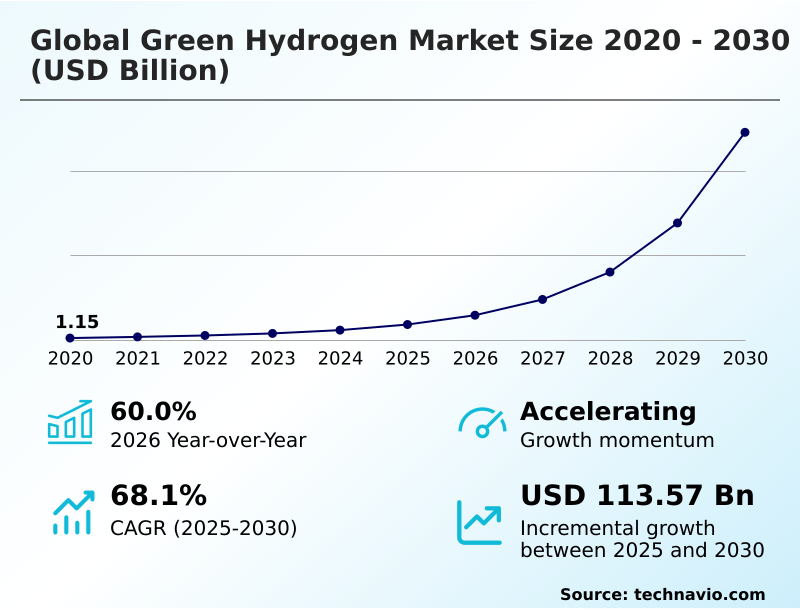
The green hydrogen market size is valued to increase by USD 113.57 billion, at a CAGR of 68.1% from 2025 to 2030. Supportive government policies and climate goals will drive the green hydrogen market.

Major Market Trends & Insights

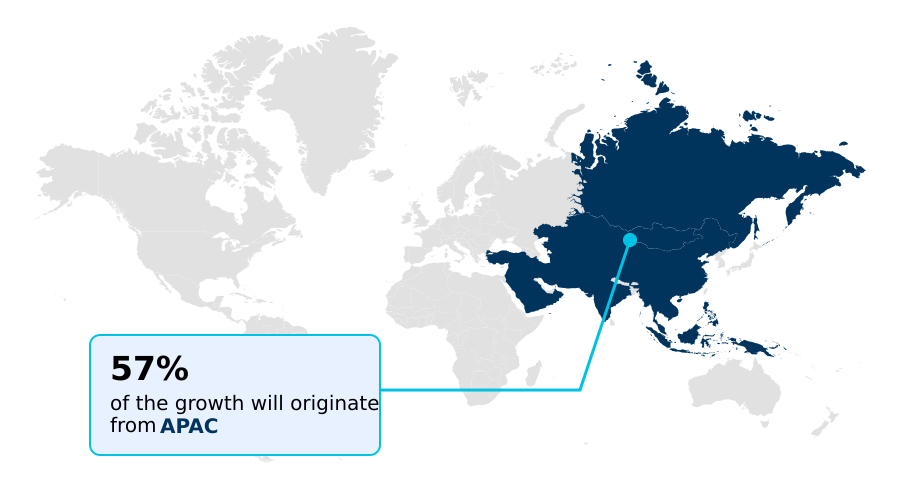
  • APAC dominated the market and accounted for a 57.4% growth during the forecast period.
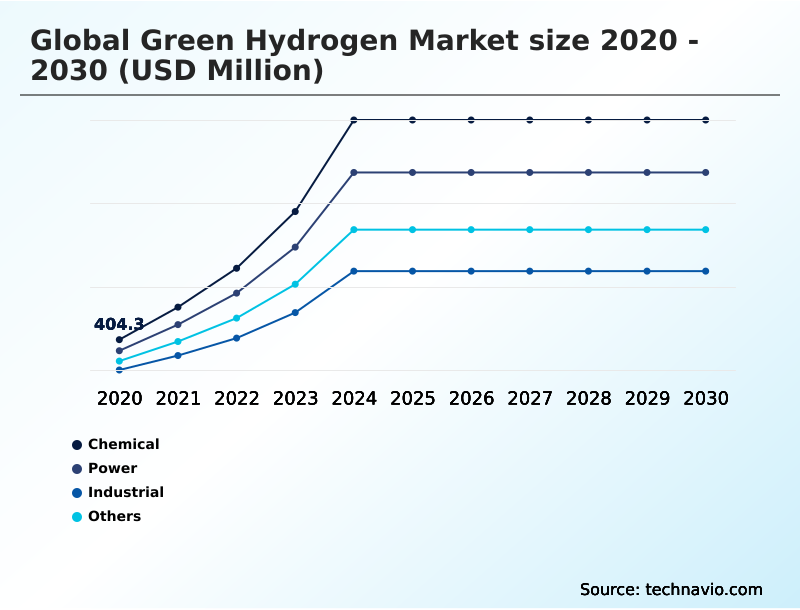
  • By End-user - Chemical segment was valued at USD 2.04 billion in 2024
  • By Technology - Alkaline electrolyzer segment accounted for the largest market revenue share in 2024

Market Size & Forecast

  • Market Opportunities: USD 121.57 billion
  • Market Future Opportunities: USD 113.57 billion
  • CAGR from 2025 to 2030 : 68.1%

Market Summary

  • The green hydrogen market is advancing as a cornerstone of the global energy transition, driven by the urgent need to decarbonize industrial operations and power systems. Its development is characterized by the scaling of electrolysis technology and the integration of renewable energy sources to produce a carbon-free fuel.
  • A key trend is the establishment of comprehensive national strategies and financial incentives, such as the hydrogen production tax credit, which aim to reduce the levelized cost of hydrogen and stimulate investment in the hydrogen value chain. For instance, a heavy industry manufacturer seeking to reduce its carbon footprint might transition to using green hydrogen as a decarbonization feedstock.
  • This move involves navigating complex offtake agreements for a stable supply, investing in on-site hydrogen production, or connecting to regional clean hydrogen hubs. Despite the high initial capital outlay for electrolyzers and storage, the long-term benefits include compliance with emissions trading schemes and enhanced brand reputation.
  • The market's trajectory is further influenced by the build-out of essential hydrogen infrastructure development, including pipelines and hydrogen refueling stations, to support applications in mobility and power generation.

What will be the Size of the Green Hydrogen Market during the forecast period?

Get Key Insights on Market Forecast (PDF) Request Free Sample

How is the Green Hydrogen Market Segmented?

The green hydrogen industry research report provides comprehensive data (region-wise segment analysis), with forecasts and estimates in "USD million" for the period 2026-2030, as well as historical data from 2020-2024 for the following segments.

  • End-user
    • Chemical
    • Power
    • Industrial
    • Others
  • Technology
    • Alkaline electrolyzer
    • Polymer electrolyte membrane (PEM) electrolyzer
  • Distribution channel
    • Pipeline
    • Cargo
  • Geography
    • APAC
      • China
      • India
      • Japan
    • Europe
      • Germany
      • France
      • UK
    • North America
      • US
      • Canada
      • Mexico
    • Middle East and Africa
      • Saudi Arabia
      • UAE
    • South America
      • Brazil
      • Argentina
    • Rest of World (ROW)

By End-user Insights

The chemical segment is estimated to witness significant growth during the forecast period.

The chemical segment is a important area for the global green hydrogen market 2026-2030, driven by the adoption of decarbonization feedstock in industrial processes.

Green ammonia production and the synthesis of methanol rely on low-carbon hydrogen to reduce the carbon footprint of fertilizers, polymers, and other essential chemical products.

Utilizing hydrogen in chemical process synthesis is pivotal for hard-to-abate sectors facing stringent carbon pricing impacts. The industry's shift is supported by a growing hydrogen value chain and expanding industrial gas services, which facilitate the transition away from fossil-based feedstocks.

For instance, optimizing production with green hydrogen has demonstrated the potential to lower carbon intensity in ammonia synthesis by more than 90%, showcasing its transformative impact on the sector's sustainability targets and operational efficiency.

Request Free Sample

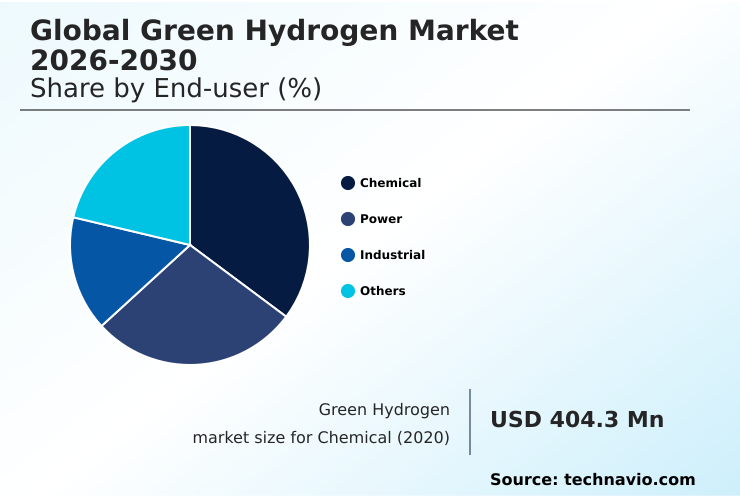
The Chemical segment was valued at USD 2.04 billion in 2024 and showed a gradual increase during the forecast period.

Request Free Sample

Regional Analysis

APAC is estimated to contribute 57.4% to the growth of the global market during the forecast period.Technavio’s analysts have elaborately explained the regional trends and drivers that shape the market during the forecast period.

See How Green Hydrogen Market Demand is Rising in APAC Request Free Sample

The geographic landscape of the global green hydrogen market 2026-2030 is increasingly centered on APAC, which accounts for over 57% of the global incremental growth opportunity, significantly outpacing Europe's 21%.

This dominance is fueled by aggressive national policies and massive investments in hydrogen infrastructure development, particularly for clean ammonia production and industrial decarbonization.

Countries are leveraging advanced technologies like solid oxide electrolyzer and fuel cell systems to build out capabilities for both domestic use and export.

Applications are expanding from industrial feedstock to include grid injection and fuel for zero-emission vehicles, supported by advancements in hydrogen combustion engines.

The region's focus on creating a complete ecosystem, including hydrogen blending into existing gas networks, positions it as a critical hub in the evolving water electrolysis technology landscape, driving both supply and demand.

Market Dynamics

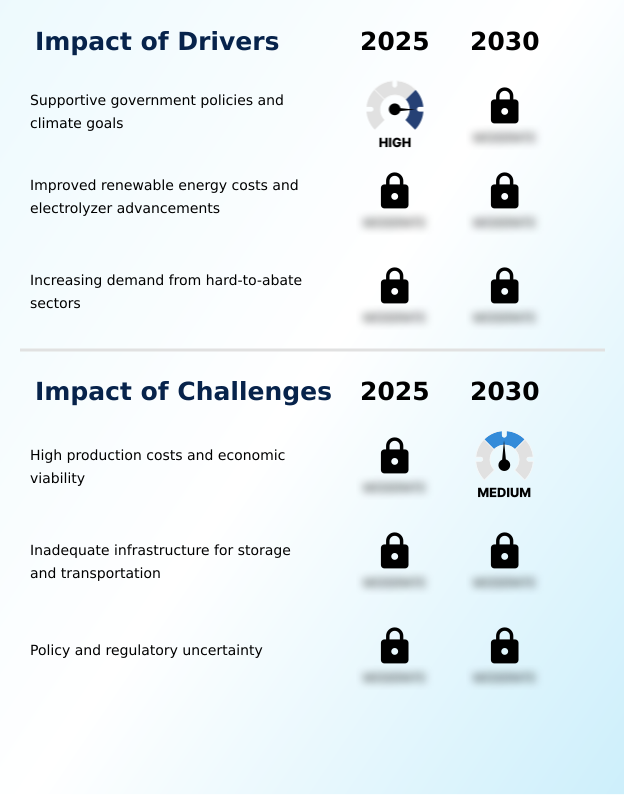
Our researchers analyzed the data with 2025 as the base year, along with the key drivers, trends, and challenges. A holistic analysis of drivers will help companies refine their marketing strategies to gain a competitive advantage.

  • Analyzing the future of the global green hydrogen market 2026-2030 requires a deep dive into several interconnected factors. The comparative cost of green hydrogen vs grey hydrogen remains a central challenge, though this gap is narrowing due to technological progress and supportive policies.
  • A key consideration is the debate over PEM vs alkaline electrolyzer efficiency, where PEM technology offers faster response times ideal for grid balancing, while alkaline systems currently provide a lower-cost pathway for large-scale, continuous production.
  • The role of green hydrogen in steel manufacturing and other heavy industries is a primary demand driver, as it offers one of the few viable routes for deep industrial decarbonization. However, significant hurdles remain, particularly the challenges in hydrogen transportation infrastructure.
  • The prospect of converting natural gas pipelines for hydrogen is promising for reducing costs but involves technical and safety evaluations. The impact of government subsidies on LCOH is profound, with incentives capable of reducing project costs by over 40% in some regions, thereby accelerating final investment decisions.
  • Furthermore, the application of green hydrogen for heavy-duty transport and the industrial-scale deployment of solid oxide electrolyzer technology are set to unlock new market segments. Its use in chemical process synthesis, replacing fossil-based feedstocks, underscores its versatility and importance in the broader energy transition.

What are the key market drivers leading to the rise in the adoption of Green Hydrogen Industry?

  • Supportive government policies and ambitious climate goals are primary drivers stimulating investment and development across the green hydrogen market.

  • Supportive government policies are a primary driver for the global green hydrogen market 2026-2030, de-risking investments and accelerating commercialization.
  • Financial incentives like the hydrogen production tax credit directly address cost barriers, while the formation of regional clean hydrogen hubs fosters ecosystem development.
  • These programs stimulate on-site hydrogen production and large-scale electrolysis projects through mechanisms like renewable power purchase agreement support, which can lower operational expenditures by up to 30%.
  • The focus on building domestic electrolyzer manufacturing capabilities strengthens the entire hydrogen value chain.
  • Furthermore, government-backed initiatives for creating hydrogen export corridor networks enhance global trade prospects, enabling renewable energy integration on an international scale and boosting project bankability by over 40% in some cases.

What are the market trends shaping the Green Hydrogen Industry?

  • The market is shaped by intensifying global decarbonization mandates and supportive government policies. These factors are accelerating the adoption of green hydrogen as a pivotal solution for climate targets.

  • Key trends in the global green hydrogen market 2026-2030 are driven by robust policy support and corporate decarbonization goals. Governments are enacting national hydrogen strategy frameworks and establishing emissions trading schemes, creating a favorable investment climate. This has spurred a significant increase in hydrogen production capacity, with projects leveraging both alkaline electrolyzer and polymer electrolyte membrane electrolyzer technologies.
  • For instance, some jurisdictions now permit hydrogen blending of up to 20% in natural gas grids, expanding offtake opportunities. Concurrently, corporations are driving demand through fuel cell deployment in logistics and transport, supported by a growing network of hydrogen refueling stations.
  • These initiatives have led to an 18% improvement in the cost-efficiency of certain electrolysis projects over the past two years, accelerating market adoption.

What challenges does the Green Hydrogen Industry face during its growth?

  • High production costs relative to conventional alternatives and the ongoing challenge of achieving broad economic viability remain significant barriers for the industry.

  • High production cost remains a formidable challenge for the global green hydrogen market 2026-2030, directly impacting its competitiveness. The levelized cost of hydrogen is heavily influenced by electrolysis technology efficiency and the price of renewable electricity. Securing long-term offtake agreements is difficult as buyers hesitate due to price volatility, creating a significant hurdle for project financing.
  • Regulatory uncertainty, such as the stringent hourly time matching and regional proximity requirement rules for tax credits, can increase compliance costs for some developers by over 15%. These factors complicate the development of critical hydrogen storage solutions and hydrogen delivery systems.
  • While innovations in modular alkaline electrolysers and solid oxide fuel cells are improving electrolyzer efficiency, achieving cost parity with conventional hydrogen without substantial, stable subsidies remains a key barrier to widespread market adoption.

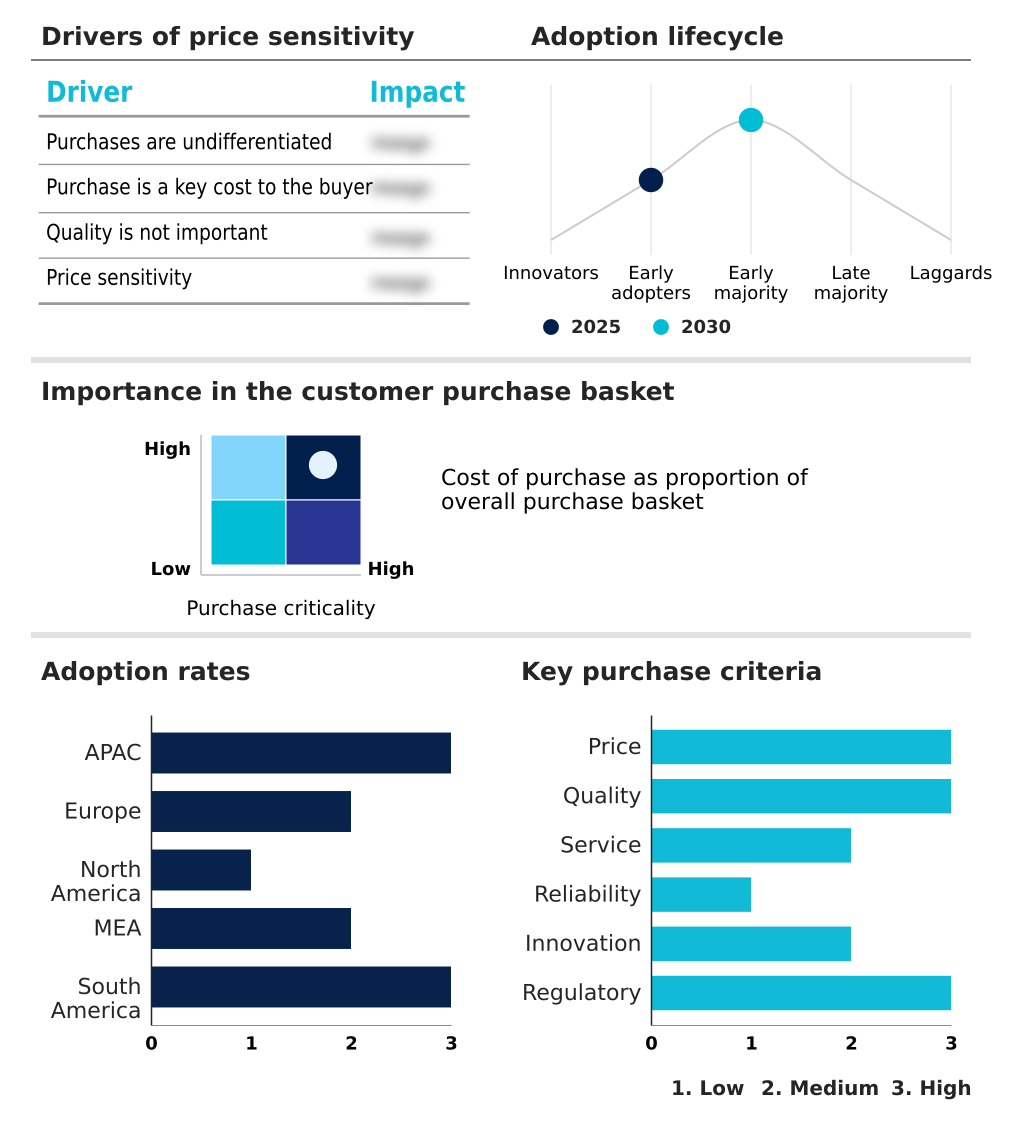
Exclusive Technavio Analysis on Customer Landscape

The green hydrogen market forecasting report includes the adoption lifecycle of the market, covering from the innovator’s stage to the laggard’s stage. It focuses on adoption rates in different regions based on penetration. Furthermore, the green hydrogen market report also includes key purchase criteria and drivers of price sensitivity to help companies evaluate and develop their market growth analysis strategies.

Customer Landscape of Green Hydrogen Industry

Competitive Landscape

Companies are implementing various strategies, such as strategic alliances, green hydrogen market forecast, partnerships, mergers and acquisitions, geographical expansion, and product/service launches, to enhance their presence in the industry.

Acwa Power Co. - Develops and operates large-scale, renewable-powered electrolysis projects focused on clean ammonia production for global markets.

The industry research and growth report includes detailed analyses of the competitive landscape of the market and information about key companies, including:

  • Acwa Power Co.
  • Air Liquide SA
  • Air Products and Chemicals Inc
  • Ballard Power Systems Inc.
  • Bloom Energy Corp.
  • Ceres Power Holdings plc
  • Cummins Inc.
  • Green Hydrogen Systems
  • Guangdong Nation Synergy
  • Indian Oil Corp. Ltd.
  • Jindal Steel and Power Ltd.
  • Larsen and Toubro Ltd.
  • Linde Plc
  • Nel ASA
  • Nikola Corp.
  • Plug Power Inc.
  • Siemens Energy AG
  • Teralta Hydrogen Solutions

Qualitative and quantitative analysis of companies has been conducted to help clients understand the wider business environment as well as the strengths and weaknesses of key industry players. Data is qualitatively analyzed to categorize companies as pure play, category-focused, industry-focused, and diversified; it is quantitatively analyzed to categorize companies as dominant, leading, strong, tentative, and weak.

Recent Development and News in Green hydrogen market

  • In May 2025, Daye Green Power reportedly commenced production at its facility in Hubei province, marking a significant milestone in China's transition toward hydrogen derived from renewable sources.
  • In March 2025, ChinaCoal Linxi Bioenergy Co. Ltd. obtained approval for its integrated wind-solar-to-hydrogen project in Chifeng Linxi County, backed by an initial investment of approximately $232.4 million.
  • In February 2025, reports indicated that a prominent green hydrogen export project in Queensland, Australia, was halted after the state government withdrew its financial support, citing escalating infrastructure and development costs.
  • In January 2025, the U.S. Treasury Department released its definitive guidance concerning the 45V hydrogen production tax credit, upholding a rigorous framework that includes hourly time-matching requirements for electricity sources.

Dive into Technavio’s robust research methodology, blending expert interviews, extensive data synthesis, and validated models for unparalleled Green Hydrogen Market insights. See full methodology.

Market Scope
Page number 289
Base year 2025
Historic period 2020-2024
Forecast period 2026-2030
Growth momentum & CAGR Accelerate at a CAGR of 68.1%
Market growth 2026-2030 USD 113574.0 million
Market structure Fragmented
YoY growth 2025-2026(%) 60.0%
Key countries China, India, Japan, Australia, South Korea, Indonesia, Germany, France, UK, The Netherlands, Spain, Italy, US, Canada, Mexico, Saudi Arabia, UAE, Egypt, Oman, Qatar, Brazil, Chile and Argentina
Competitive landscape Leading Companies, Market Positioning of Companies, Competitive Strategies, and Industry Risks

Request Free Sample

Research Analyst Overview

  • The global green hydrogen market 2026-2030 is rapidly advancing, driven by innovations across its value chain. Central to this is the evolution of electrolysis technology, with both alkaline electrolyzer and polymer electrolyte membrane electrolyzer systems scaling up.
  • The development of modular alkaline electrolysers is enabling more flexible on-site hydrogen production, while advancements in solid oxide fuel cells and solid oxide electrolyzer technology promise higher efficiency for industrial applications.
  • This increasing hydrogen production capacity is critical for supplying a range of end-uses, from fuel for hydrogen combustion engines and fuel cell electric vehicles to feedstock for clean ammonia production. The build-out of infrastructure, including hydrogen refueling stations and regional clean hydrogen hubs, is essential for enabling widespread adoption of zero-emission vehicles.
  • Industrial gas services are expanding to include low-carbon hydrogen and comprehensive hydrogen delivery systems, supported by incentives like the hydrogen production tax credit. For projects, securing long-term offtake agreements for large-scale electrolysis projects remains a key milestone, with successful ventures often reducing financial risk by over 30% before construction begins.

What are the Key Data Covered in this Green Hydrogen Market Research and Growth Report?

  • What is the expected growth of the Green Hydrogen Market between 2026 and 2030?

    • USD 113.57 billion, at a CAGR of 68.1%

  • What segmentation does the market report cover?

    • The report is segmented by End-user (Chemical, Power, Industrial, and Others), Technology (Alkaline electrolyzer, and Polymer electrolyte membrane (PEM) electrolyzer), Distribution Channel (Pipeline, and Cargo) and Geography (APAC, Europe, North America, Middle East and Africa, South America)

  • Which regions are analyzed in the report?

    • APAC, Europe, North America, Middle East and Africa and South America

  • What are the key growth drivers and market challenges?

    • Supportive government policies and climate goals, High production costs and economic viability

  • Who are the major players in the Green Hydrogen Market?

    • Acwa Power Co., Air Liquide SA, Air Products and Chemicals Inc, Ballard Power Systems Inc., Bloom Energy Corp., Ceres Power Holdings plc, Cummins Inc., Green Hydrogen Systems, Guangdong Nation Synergy, Indian Oil Corp. Ltd., Jindal Steel and Power Ltd., Larsen and Toubro Ltd., Linde Plc, Nel ASA, Nikola Corp., Plug Power Inc., Siemens Energy AG and Teralta Hydrogen Solutions

Market Research Insights

  • Market dynamics are shaped by a confluence of supportive policies and technological advancements, fostering an environment of rapid expansion. The industry is witnessing accelerated adoption rates approaching 60% annually, driven by national strategies promoting fuel cell deployment and electrolyzer manufacturing.
  • This growth is not uniform, as investment returns are closely tied to regional incentives and the maturity of local hydrogen infrastructure development. For instance, projects with secured renewable power purchase agreements demonstrate up to 25% greater financial viability compared to those exposed to volatile spot electricity prices.
  • The market expansion reflects a compound growth trajectory exceeding 68%, highlighting the significant momentum behind industrial decarbonization and the increasing competitiveness of water electrolysis technology in hard-to-abate sectors.

We can help! Our analysts can customize this green hydrogen market research report to meet your requirements.

Get in touch

1. Executive Summary

1.1 Market overview

Executive Summary - Chart on Market Overview
Executive Summary - Data Table on Market Overview
Executive Summary - Chart on Global Market Characteristics
Executive Summary - Chart on Market by Geography
Executive Summary - Chart on Market Segmentation by End-user
Executive Summary - Chart on Market Segmentation by Technology
Executive Summary - Chart on Market Segmentation by Distribution Channel
Executive Summary - Chart on Incremental Growth
Executive Summary - Data Table on Incremental Growth
Executive Summary - Chart on Company Market Positioning

2. Technavio Analysis

2.1 Analysis of price sensitivity, lifecycle, customer purchase basket, adoption rates, and purchase criteria

2.2 Criticality of inputs and Factors of differentiation

Chart on Overview on criticality of inputs and factors of differentiation

2.3 Factors of disruption

Chart on Overview on factors of disruption

2.4 Impact of drivers and challenges

Chart on Impact of drivers and challenges in 2025 and 2030

3. Market Landscape

3.1 Market ecosystem

Chart on Parent Market
Data Table on - Parent Market

3.2 Market characteristics

Chart on Market characteristics analysis

3.3 Value chain analysis

Chart on Value chain analysis

4. Market Sizing

4.1 Market definition

Data Table on Offerings of companies included in the market definition

4.2 Market segment analysis

Market segments

4.3 Market size 2025

4.4 Market outlook: Forecast for 2025-2030

Chart on Global - Market size and forecast 2025-2030 ($ million)
Data Table on Global - Market size and forecast 2025-2030 ($ million)
Chart on Global Market: Year-over-year growth 2025-2030 (%)
Data Table on Global Market: Year-over-year growth 2025-2030 (%)

5. Historic Market Size

5.1 Global Green Hydrogen Market 2020 - 2024

Historic Market Size - Data Table on Global Green Hydrogen Market 2020 - 2024 ($ million)

5.2 End-user segment analysis 2020 - 2024

Historic Market Size - End-user Segment 2020 - 2024 ($ million)

5.3 Technology segment analysis 2020 - 2024

Historic Market Size - Technology Segment 2020 - 2024 ($ million)

5.4 Distribution Channel segment analysis 2020 - 2024

Historic Market Size - Distribution Channel Segment 2020 - 2024 ($ million)

5.5 Geography segment analysis 2020 - 2024

Historic Market Size - Geography Segment 2020 - 2024 ($ million)

5.6 Country segment analysis 2020 - 2024

Historic Market Size - Country Segment 2020 - 2024 ($ million)

6. Qualitative Analysis

6.1 Impact of Artificial Intelligence on the Global Green Hydrogen Market

7. Five Forces Analysis

7.1 Five forces summary

Five forces analysis - Comparison between 2025 and 2030

7.2 Bargaining power of buyers

Bargaining power of buyers - Impact of key factors 2025 and 2030

7.3 Bargaining power of suppliers

Bargaining power of suppliers - Impact of key factors in 2025 and 2030

7.4 Threat of new entrants

Threat of new entrants - Impact of key factors in 2025 and 2030

7.5 Threat of substitutes

Threat of substitutes - Impact of key factors in 2025 and 2030

7.6 Threat of rivalry

Threat of rivalry - Impact of key factors in 2025 and 2030

7.7 Market condition

Chart on Market condition - Five forces 2025 and 2030

8. Market Segmentation by End-user

8.1 Market segments

Chart on End-user - Market share 2025-2030 (%)
Data Table on End-user - Market share 2025-2030 (%)

8.2 Comparison by End-user

Chart on Comparison by End-user
Data Table on Comparison by End-user

8.3 Chemical - Market size and forecast 2025-2030

Chart on Chemical - Market size and forecast 2025-2030 ($ million)
Data Table on Chemical - Market size and forecast 2025-2030 ($ million)
Chart on Chemical - Year-over-year growth 2025-2030 (%)
Data Table on Chemical - Year-over-year growth 2025-2030 (%)

8.4 Power - Market size and forecast 2025-2030

Chart on Power - Market size and forecast 2025-2030 ($ million)
Data Table on Power - Market size and forecast 2025-2030 ($ million)
Chart on Power - Year-over-year growth 2025-2030 (%)
Data Table on Power - Year-over-year growth 2025-2030 (%)

8.5 Industrial - Market size and forecast 2025-2030

Chart on Industrial - Market size and forecast 2025-2030 ($ million)
Data Table on Industrial - Market size and forecast 2025-2030 ($ million)
Chart on Industrial - Year-over-year growth 2025-2030 (%)
Data Table on Industrial - Year-over-year growth 2025-2030 (%)

8.6 Others - Market size and forecast 2025-2030

Chart on Others - Market size and forecast 2025-2030 ($ million)
Data Table on Others - Market size and forecast 2025-2030 ($ million)
Chart on Others - Year-over-year growth 2025-2030 (%)
Data Table on Others - Year-over-year growth 2025-2030 (%)

8.7 Market opportunity by End-user

Market opportunity by End-user ($ million)
Data Table on Market opportunity by End-user ($ million)

9. Market Segmentation by Technology

9.1 Market segments

Chart on Technology - Market share 2025-2030 (%)
Data Table on Technology - Market share 2025-2030 (%)

9.2 Comparison by Technology

Chart on Comparison by Technology
Data Table on Comparison by Technology

9.3 Alkaline electrolyzer - Market size and forecast 2025-2030

Chart on Alkaline electrolyzer - Market size and forecast 2025-2030 ($ million)
Data Table on Alkaline electrolyzer - Market size and forecast 2025-2030 ($ million)
Chart on Alkaline electrolyzer - Year-over-year growth 2025-2030 (%)
Data Table on Alkaline electrolyzer - Year-over-year growth 2025-2030 (%)

9.4 Polymer electrolyte membrane (PEM) electrolyzer - Market size and forecast 2025-2030

Chart on Polymer electrolyte membrane (PEM) electrolyzer - Market size and forecast 2025-2030 ($ million)
Data Table on Polymer electrolyte membrane (PEM) electrolyzer - Market size and forecast 2025-2030 ($ million)
Chart on Polymer electrolyte membrane (PEM) electrolyzer - Year-over-year growth 2025-2030 (%)
Data Table on Polymer electrolyte membrane (PEM) electrolyzer - Year-over-year growth 2025-2030 (%)

9.5 Market opportunity by Technology

Market opportunity by Technology ($ million)
Data Table on Market opportunity by Technology ($ million)

10. Market Segmentation by Distribution Channel

10.1 Market segments

Chart on Distribution Channel - Market share 2025-2030 (%)
Data Table on Distribution Channel - Market share 2025-2030 (%)

10.2 Comparison by Distribution Channel

Chart on Comparison by Distribution Channel
Data Table on Comparison by Distribution Channel

10.3 Pipeline - Market size and forecast 2025-2030

Chart on Pipeline - Market size and forecast 2025-2030 ($ million)
Data Table on Pipeline - Market size and forecast 2025-2030 ($ million)
Chart on Pipeline - Year-over-year growth 2025-2030 (%)
Data Table on Pipeline - Year-over-year growth 2025-2030 (%)

10.4 Cargo - Market size and forecast 2025-2030

Chart on Cargo - Market size and forecast 2025-2030 ($ million)
Data Table on Cargo - Market size and forecast 2025-2030 ($ million)
Chart on Cargo - Year-over-year growth 2025-2030 (%)
Data Table on Cargo - Year-over-year growth 2025-2030 (%)

10.5 Market opportunity by Distribution Channel

Market opportunity by Distribution Channel ($ million)
Data Table on Market opportunity by Distribution Channel ($ million)

11. Customer Landscape

11.1 Customer landscape overview

Analysis of price sensitivity, lifecycle, customer purchase basket, adoption rates, and purchase criteria

12. Geographic Landscape

12.1 Geographic segmentation

Chart on Market share by geography 2025-2030 (%)
Data Table on Market share by geography 2025-2030 (%)

12.2 Geographic comparison

Chart on Geographic comparison
Data Table on Geographic comparison

12.3 APAC - Market size and forecast 2025-2030

Chart on APAC - Market size and forecast 2025-2030 ($ million)
Data Table on APAC - Market size and forecast 2025-2030 ($ million)
Chart on APAC - Year-over-year growth 2025-2030 (%)
Data Table on APAC - Year-over-year growth 2025-2030 (%)
Chart on Regional Comparison - APAC
Data Table on Regional Comparison - APAC

12.3.1 China - Market size and forecast 2025-2030

Chart on China - Market size and forecast 2025-2030 ($ million)
Data Table on China - Market size and forecast 2025-2030 ($ million)
Chart on China - Year-over-year growth 2025-2030 (%)
Data Table on China - Year-over-year growth 2025-2030 (%)

12.3.2 India - Market size and forecast 2025-2030

Chart on India - Market size and forecast 2025-2030 ($ million)
Data Table on India - Market size and forecast 2025-2030 ($ million)
Chart on India - Year-over-year growth 2025-2030 (%)
Data Table on India - Year-over-year growth 2025-2030 (%)

12.3.3 Japan - Market size and forecast 2025-2030

Chart on Japan - Market size and forecast 2025-2030 ($ million)
Data Table on Japan - Market size and forecast 2025-2030 ($ million)
Chart on Japan - Year-over-year growth 2025-2030 (%)
Data Table on Japan - Year-over-year growth 2025-2030 (%)

12.3.4 Australia - Market size and forecast 2025-2030

Chart on Australia - Market size and forecast 2025-2030 ($ million)
Data Table on Australia - Market size and forecast 2025-2030 ($ million)
Chart on Australia - Year-over-year growth 2025-2030 (%)
Data Table on Australia - Year-over-year growth 2025-2030 (%)

12.3.5 South Korea - Market size and forecast 2025-2030

Chart on South Korea - Market size and forecast 2025-2030 ($ million)
Data Table on South Korea - Market size and forecast 2025-2030 ($ million)
Chart on South Korea - Year-over-year growth 2025-2030 (%)
Data Table on South Korea - Year-over-year growth 2025-2030 (%)

12.3.6 Indonesia - Market size and forecast 2025-2030

Chart on Indonesia - Market size and forecast 2025-2030 ($ million)
Data Table on Indonesia - Market size and forecast 2025-2030 ($ million)
Chart on Indonesia - Year-over-year growth 2025-2030 (%)
Data Table on Indonesia - Year-over-year growth 2025-2030 (%)

12.4 Europe - Market size and forecast 2025-2030

Chart on Europe - Market size and forecast 2025-2030 ($ million)
Data Table on Europe - Market size and forecast 2025-2030 ($ million)
Chart on Europe - Year-over-year growth 2025-2030 (%)
Data Table on Europe - Year-over-year growth 2025-2030 (%)
Chart on Regional Comparison - Europe
Data Table on Regional Comparison - Europe

12.4.1 Germany - Market size and forecast 2025-2030

Chart on Germany - Market size and forecast 2025-2030 ($ million)
Data Table on Germany - Market size and forecast 2025-2030 ($ million)
Chart on Germany - Year-over-year growth 2025-2030 (%)
Data Table on Germany - Year-over-year growth 2025-2030 (%)

12.4.2 France - Market size and forecast 2025-2030

Chart on France - Market size and forecast 2025-2030 ($ million)
Data Table on France - Market size and forecast 2025-2030 ($ million)
Chart on France - Year-over-year growth 2025-2030 (%)
Data Table on France - Year-over-year growth 2025-2030 (%)

12.4.3 UK - Market size and forecast 2025-2030

Chart on UK - Market size and forecast 2025-2030 ($ million)
Data Table on UK - Market size and forecast 2025-2030 ($ million)
Chart on UK - Year-over-year growth 2025-2030 (%)
Data Table on UK - Year-over-year growth 2025-2030 (%)

12.4.4 The Netherlands - Market size and forecast 2025-2030

Chart on The Netherlands - Market size and forecast 2025-2030 ($ million)
Data Table on The Netherlands - Market size and forecast 2025-2030 ($ million)
Chart on The Netherlands - Year-over-year growth 2025-2030 (%)
Data Table on The Netherlands - Year-over-year growth 2025-2030 (%)

12.4.5 Spain - Market size and forecast 2025-2030

Chart on Spain - Market size and forecast 2025-2030 ($ million)
Data Table on Spain - Market size and forecast 2025-2030 ($ million)
Chart on Spain - Year-over-year growth 2025-2030 (%)
Data Table on Spain - Year-over-year growth 2025-2030 (%)

12.4.6 Italy - Market size and forecast 2025-2030

Chart on Italy - Market size and forecast 2025-2030 ($ million)
Data Table on Italy - Market size and forecast 2025-2030 ($ million)
Chart on Italy - Year-over-year growth 2025-2030 (%)
Data Table on Italy - Year-over-year growth 2025-2030 (%)

12.5 North America - Market size and forecast 2025-2030

Chart on North America - Market size and forecast 2025-2030 ($ million)
Data Table on North America - Market size and forecast 2025-2030 ($ million)
Chart on North America - Year-over-year growth 2025-2030 (%)
Data Table on North America - Year-over-year growth 2025-2030 (%)
Chart on Regional Comparison - North America
Data Table on Regional Comparison - North America

12.5.1 US - Market size and forecast 2025-2030

Chart on US - Market size and forecast 2025-2030 ($ million)
Data Table on US - Market size and forecast 2025-2030 ($ million)
Chart on US - Year-over-year growth 2025-2030 (%)
Data Table on US - Year-over-year growth 2025-2030 (%)

12.5.2 Canada - Market size and forecast 2025-2030

Chart on Canada - Market size and forecast 2025-2030 ($ million)
Data Table on Canada - Market size and forecast 2025-2030 ($ million)
Chart on Canada - Year-over-year growth 2025-2030 (%)
Data Table on Canada - Year-over-year growth 2025-2030 (%)

12.5.3 Mexico - Market size and forecast 2025-2030

Chart on Mexico - Market size and forecast 2025-2030 ($ million)
Data Table on Mexico - Market size and forecast 2025-2030 ($ million)
Chart on Mexico - Year-over-year growth 2025-2030 (%)
Data Table on Mexico - Year-over-year growth 2025-2030 (%)

12.6 Middle East and Africa - Market size and forecast 2025-2030

Chart on Middle East and Africa - Market size and forecast 2025-2030 ($ million)
Data Table on Middle East and Africa - Market size and forecast 2025-2030 ($ million)
Chart on Middle East and Africa - Year-over-year growth 2025-2030 (%)
Data Table on Middle East and Africa - Year-over-year growth 2025-2030 (%)
Chart on Regional Comparison - Middle East and Africa
Data Table on Regional Comparison - Middle East and Africa

12.6.1 Saudi Arabia - Market size and forecast 2025-2030

Chart on Saudi Arabia - Market size and forecast 2025-2030 ($ million)
Data Table on Saudi Arabia - Market size and forecast 2025-2030 ($ million)
Chart on Saudi Arabia - Year-over-year growth 2025-2030 (%)
Data Table on Saudi Arabia - Year-over-year growth 2025-2030 (%)

12.6.2 UAE - Market size and forecast 2025-2030

Chart on UAE - Market size and forecast 2025-2030 ($ million)
Data Table on UAE - Market size and forecast 2025-2030 ($ million)
Chart on UAE - Year-over-year growth 2025-2030 (%)
Data Table on UAE - Year-over-year growth 2025-2030 (%)

12.6.3 Egypt - Market size and forecast 2025-2030

Chart on Egypt - Market size and forecast 2025-2030 ($ million)
Data Table on Egypt - Market size and forecast 2025-2030 ($ million)
Chart on Egypt - Year-over-year growth 2025-2030 (%)
Data Table on Egypt - Year-over-year growth 2025-2030 (%)

12.6.4 Oman - Market size and forecast 2025-2030

Chart on Oman - Market size and forecast 2025-2030 ($ million)
Data Table on Oman - Market size and forecast 2025-2030 ($ million)
Chart on Oman - Year-over-year growth 2025-2030 (%)
Data Table on Oman - Year-over-year growth 2025-2030 (%)

12.6.5 Qatar - Market size and forecast 2025-2030

Chart on Qatar - Market size and forecast 2025-2030 ($ million)
Data Table on Qatar - Market size and forecast 2025-2030 ($ million)
Chart on Qatar - Year-over-year growth 2025-2030 (%)
Data Table on Qatar - Year-over-year growth 2025-2030 (%)

12.7 South America - Market size and forecast 2025-2030

Chart on South America - Market size and forecast 2025-2030 ($ million)
Data Table on South America - Market size and forecast 2025-2030 ($ million)
Chart on South America - Year-over-year growth 2025-2030 (%)
Data Table on South America - Year-over-year growth 2025-2030 (%)
Chart on Regional Comparison - South America
Data Table on Regional Comparison - South America

12.7.1 Brazil - Market size and forecast 2025-2030

Chart on Brazil - Market size and forecast 2025-2030 ($ million)
Data Table on Brazil - Market size and forecast 2025-2030 ($ million)
Chart on Brazil - Year-over-year growth 2025-2030 (%)
Data Table on Brazil - Year-over-year growth 2025-2030 (%)

12.7.2 Chile - Market size and forecast 2025-2030

Chart on Chile - Market size and forecast 2025-2030 ($ million)
Data Table on Chile - Market size and forecast 2025-2030 ($ million)
Chart on Chile - Year-over-year growth 2025-2030 (%)
Data Table on Chile - Year-over-year growth 2025-2030 (%)

12.7.3 Argentina - Market size and forecast 2025-2030

Chart on Argentina - Market size and forecast 2025-2030 ($ million)
Data Table on Argentina - Market size and forecast 2025-2030 ($ million)
Chart on Argentina - Year-over-year growth 2025-2030 (%)
Data Table on Argentina - Year-over-year growth 2025-2030 (%)

12.8 Market opportunity by geography

Market opportunity by geography ($ million)
Data Tables on Market opportunity by geography ($ million)

13. Drivers, Challenges, and Opportunity

13.1 Market drivers

Supportive government policies and climate goals
Improved renewable energy costs and electrolyzer advancements
Increasing demand from hard-to-abate sectors

13.2 Market challenges

High production costs and economic viability
Inadequate infrastructure for storage and transportation
Policy and regulatory uncertainty

13.3 Impact of drivers and challenges

Impact of drivers and challenges in 2025 and 2030

13.4 Market opportunities

Intensifying global decarbonization mandates and supportive government policies
Corporate decarbonization commitments and quest for green industrial processes
Technological advancements and accelerating cost reductions in production

14. Competitive Landscape

14.1 Overview

14.2

Overview on criticality of inputs and factors of differentiation

14.3 Landscape disruption

Overview on factors of disruption

14.4 Industry risks

Impact of key risks on business

15. Competitive Analysis

15.1 Companies profiled

Companies covered

15.2 Company ranking index

15.3 Market positioning of companies

Matrix on companies position and classification

15.4 Acwa Power Co.

Acwa Power Co. - Overview
Acwa Power Co. - Product / Service
Acwa Power Co. - Key offerings
SWOT

15.5 Air Liquide SA

Air Liquide SA - Overview
Air Liquide SA - Product / Service
Air Liquide SA - Key news
Air Liquide SA - Key offerings
SWOT

15.6 Air Products and Chemicals Inc

Air Products and Chemicals Inc - Overview
Air Products and Chemicals Inc - Business segments
Air Products and Chemicals Inc - Key news
Air Products and Chemicals Inc - Key offerings
Air Products and Chemicals Inc - Segment focus
SWOT

15.7 Ballard Power Systems Inc.

Ballard Power Systems Inc. - Overview
Ballard Power Systems Inc. - Product / Service
Ballard Power Systems Inc. - Key offerings
SWOT

15.8 Bloom Energy Corp.

Bloom Energy Corp. - Overview
Bloom Energy Corp. - Product / Service
Bloom Energy Corp. - Key offerings
SWOT

15.9 Ceres Power Holdings plc

Ceres Power Holdings plc - Overview
Ceres Power Holdings plc - Business segments
Ceres Power Holdings plc - Key offerings
Ceres Power Holdings plc - Segment focus
SWOT

15.10 Cummins Inc.

Cummins Inc. - Overview
Cummins Inc. - Business segments
Cummins Inc. - Key news
Cummins Inc. - Key offerings
Cummins Inc. - Segment focus
SWOT

15.11 Green Hydrogen Systems

Green Hydrogen Systems - Overview
Green Hydrogen Systems - Product / Service
Green Hydrogen Systems - Key offerings
SWOT

15.12 Guangdong Nation Synergy

Guangdong Nation Synergy - Overview
Guangdong Nation Synergy - Product / Service
Guangdong Nation Synergy - Key offerings
SWOT

15.13 Indian Oil Corp. Ltd.

Indian Oil Corp. Ltd. - Overview
Indian Oil Corp. Ltd. - Business segments
Indian Oil Corp. Ltd. - Key news
Indian Oil Corp. Ltd. - Key offerings
Indian Oil Corp. Ltd. - Segment focus
SWOT

15.14 Jindal Steel and Power Ltd.

Jindal Steel and Power Ltd. - Overview
Jindal Steel and Power Ltd. - Product / Service
Jindal Steel and Power Ltd. - Key offerings
SWOT

15.15 Linde Plc

Linde Plc - Overview
Linde Plc - Business segments
Linde Plc - Key news
Linde Plc - Key offerings
Linde Plc - Segment focus
SWOT

15.16 Nel ASA

Nel ASA - Overview
Nel ASA - Business segments
Nel ASA - Key offerings
Nel ASA - Segment focus
SWOT

15.17 Nikola Corp.

Nikola Corp. - Overview
Nikola Corp. - Product / Service
Nikola Corp. - Key news
Nikola Corp. - Key offerings
SWOT

15.18 Teralta Hydrogen Solutions

Teralta Hydrogen Solutions - Overview
Teralta Hydrogen Solutions - Product / Service
Teralta Hydrogen Solutions - Key offerings
SWOT

16. Appendix

16.1 Scope of the report

Market definition
Objectives
Notes and caveats

16.2 Inclusions and exclusions checklist

Inclusions checklist
Exclusions checklist

16.3 Currency conversion rates for US$

16.4 Research methodology

16.5 Data procurement

Information sources

16.6 Data validation

16.7 Validation techniques employed for market sizing

16.8 Data synthesis

16.9 360 degree market analysis

16.10 List of abbreviations

Research Methodology

Technavio presents a detailed picture of the market by way of study, synthesis, and summation of data from multiple sources. The analysts have presented the various facets of the market with a particular focus on identifying the key industry influencers. The data thus presented is comprehensive, reliable, and the result of extensive research, both primary and secondary.

INFORMATION SOURCES

Primary sources

  • Manufacturers and suppliers
  • Channel partners
  • Industry experts
  • Strategic decision makers

Secondary sources

  • Industry journals and periodicals
  • Government data
  • Financial reports of key industry players
  • Historical data
  • Press releases

DATA ANALYSIS

Data Synthesis

  • Collation of data
  • Estimation of key figures
  • Analysis of derived insights

Data Validation

  • Triangulation with data models
  • Reference against proprietary databases
  • Corroboration with industry experts

REPORT WRITING

Qualitative

  • Market drivers
  • Market challenges
  • Market trends
  • Five forces analysis

Quantitative

  • Market size and forecast
  • Market segmentation
  • Geographical insights
  • Competitive landscape

Interested in this report?

Get your sample now to see our research methodology and insights!

Download Now

Frequently Asked Questions

Green Hydrogen market growth will increase by USD 113574.0 million during 2026-2030 .

The Green Hydrogen market is expected to grow at a CAGR of 68.1% during 2026-2030 .

Green Hydrogen market is segmented by End-user (Chemical, Power, Industrial, Others) Technology (Alkaline electrolyzer, Polymer electrolyte membrane (PEM) electrolyzer) Distribution channel (Pipeline, Cargo)

Acwa Power Co., Air Liquide SA, Air Products and Chemicals Inc, Ballard Power Systems Inc., Bloom Energy Corp., Ceres Power Holdings plc, Cummins Inc., Green Hydrogen Systems, Guangdong Nation Synergy, Indian Oil Corp. Ltd., Jindal Steel and Power Ltd., Larsen and Toubro Ltd., Linde Plc, Nel ASA, Nikola Corp., Plug Power Inc., Siemens Energy AG, Teralta Hydrogen Solutions are a few of the key vendors in the Green Hydrogen market.

APAC will register the highest growth rate of 57.4% among the other regions. Therefore, the Green Hydrogen market in APAC is expected to garner significant business opportunities for the vendors during the forecast period.

China, India, Japan, Australia, South Korea, Indonesia, Germany, France, UK, The Netherlands, Spain, Italy, US, Canada, Mexico, Saudi Arabia, UAE, Egypt, Oman, Qatar, Brazil, Chile, Argentina

  • Supportive government policies and climate goals is the driving factor this market.

The Green Hydrogen market vendors should focus on grabbing business opportunities from the End-user segment as it accounted for the largest market share in the base year.