
Fuel Cell Market Size 2026-2030
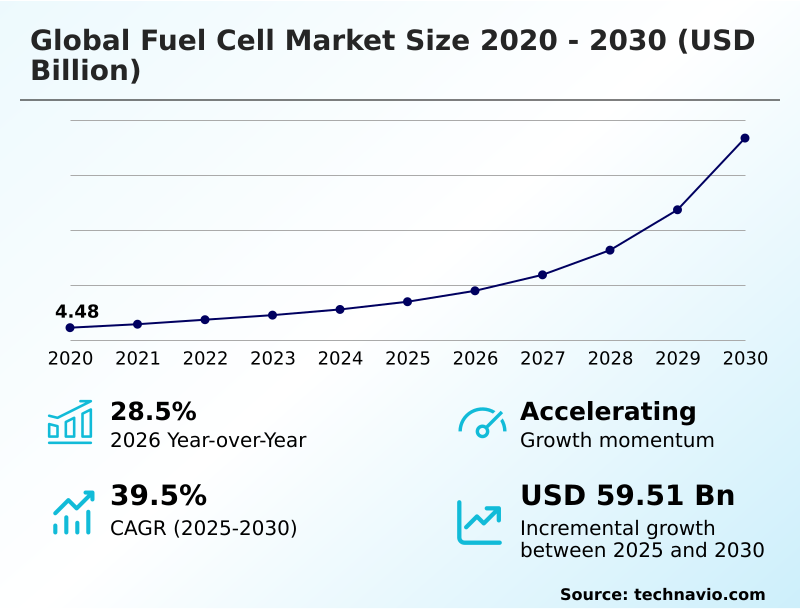
The fuel cell market size is valued to increase by USD 59.51 billion, at a CAGR of 39.5% from 2025 to 2030. Growing demand for efficient and clean energy sources will drive the fuel cell market.
Major Market Trends & Insights
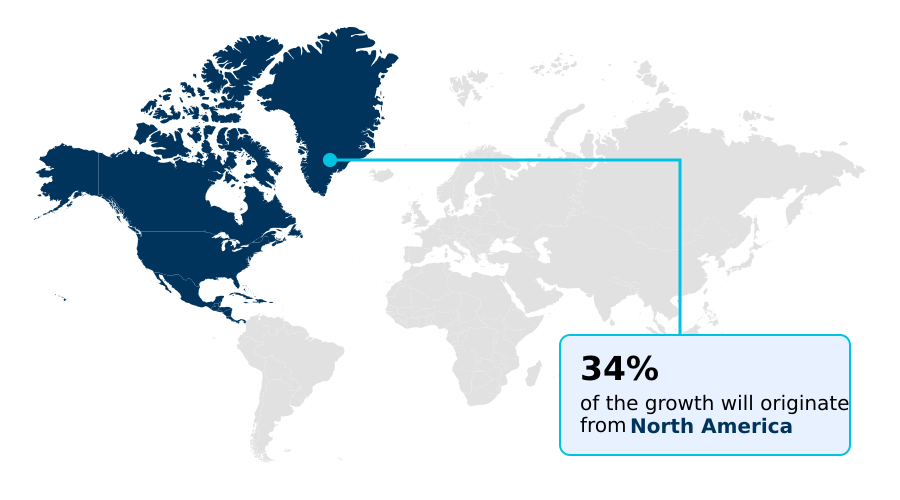
- North America dominated the market and accounted for a 33.6% growth during the forecast period.
- By Product - PEMFC segment was valued at USD 6.32 billion in 2024
- By Application - Transport segment accounted for the largest market revenue share in 2024
Market Size & Forecast
- Market Opportunities: USD 68.95 billion
- Market Future Opportunities: USD 59.51 billion
- CAGR from 2025 to 2030 : 39.5%
Market Summary
- The fuel cell market is defined by its core technology, an electrochemical device that cleanly converts chemical fuel into electrical energy. This process is central to achieving global decarbonization targets, offering a high-efficiency, zero-emission power alternative to combustion. Growth is propelled by strong government incentives for clean energy and a rising emphasis on environmental sustainability.
- Key applications include stationary power for grid stability, material handling equipment, and the electrification of heavy-duty transport, where fuel cells provide advantages in range and refueling time over battery-electric systems. For instance, a logistics company can adopt a fleet of fuel cell trucks to achieve near-zero tailpipe emissions and meet stringent new environmental mandates, ensuring operational continuity with rapid refueling.
- However, the industry faces challenges, including the high cost of platinum-group metal catalysts and the underdeveloped hydrogen refueling infrastructure. Ongoing R&D into alternative catalysts and scalable green hydrogen production are critical trends shaping the competitive landscape, paving the way for broader adoption in the clean energy transition.
What will be the Size of the Fuel Cell Market during the forecast period?
Get Key Insights on Market Forecast (PDF) Get Free Sample
How is the Fuel Cell Market Segmented?
The fuel cell industry research report provides comprehensive data (region-wise segment analysis), with forecasts and estimates in "USD million" for the period 2026-2030, as well as historical data from 2020-2024 for the following segments.
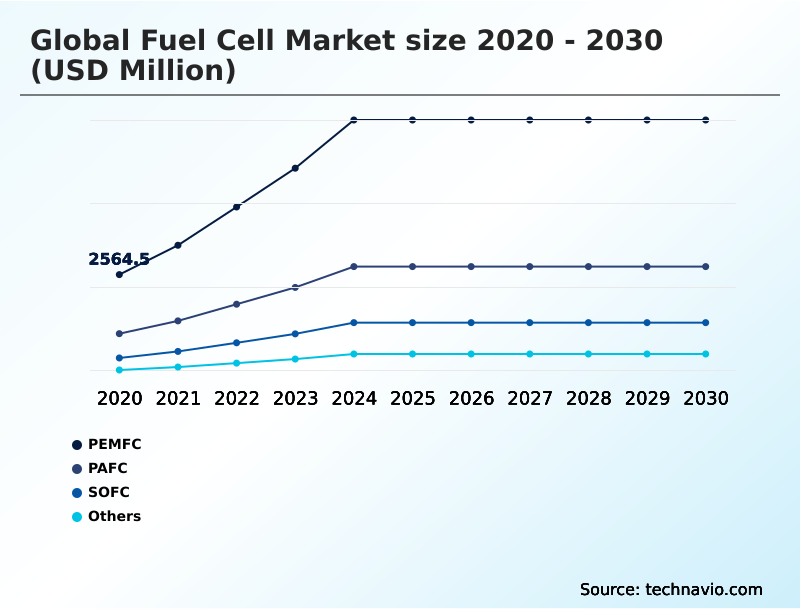
- Product
- PEMFC
- PAFC
- SOFC
- Others
- Application
- Transport
- Stationary
- Portable
- Source
- Hydrogen powered
- Natural gas powered
- Methanol powered
- Biogas powered
- Hydrocarbons powered
- Geography
- North America
- US
- Canada
- Mexico
- Europe
- Germany
- UK
- France
- APAC
- China
- India
- South Korea
- Middle East and Africa
- Saudi Arabia
- UAE
- South Africa
- South America
- Brazil
- Argentina
- Rest of World (ROW)
- North America
By Product Insights
The pemfc segment is estimated to witness significant growth during the forecast period.
The market is segmented by product, application, and source. Proton exchange membrane fuel cells (PEMFC) represent a primary segment, driven by high power density and rapid start-up capabilities ideal for the transportation sector.
The technical architecture, using a solid polymer electrolyte and platinum catalyst, allows for low-temperature operation. This reduces warm-up time, making PEMFCs suitable for on-demand zero-emission power, contributing to decarbonization targets.
Key advancements in membrane electrode assemblies (MEA) have enhanced system efficiency by over 15%, ensuring their dominant position.
Ongoing research focuses on reducing platinum-group metal catalysts loading to lower costs, a critical step for mass-market adoption in commercial vehicle electrification and enabling the broader clean energy transition.
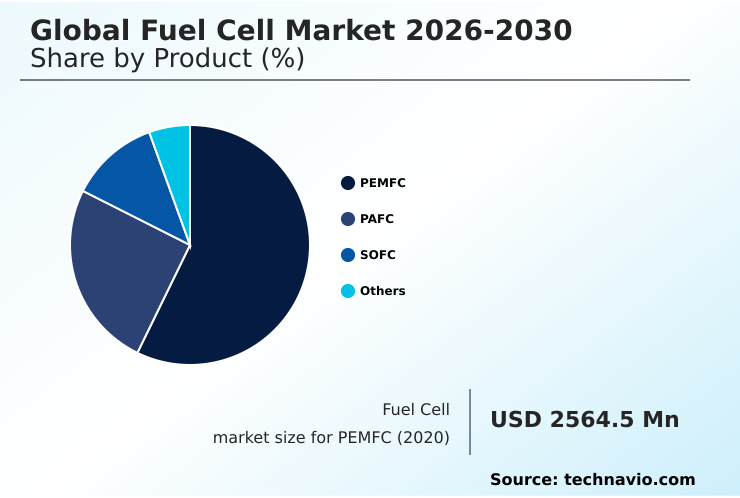
The PEMFC segment was valued at USD 6.32 billion in 2024 and showed a gradual increase during the forecast period.
Regional Analysis
North America is estimated to contribute 33.6% to the growth of the global market during the forecast period.Technavio’s analysts have elaborately explained the regional trends and drivers that shape the market during the forecast period.
See How Fuel Cell Market Demand is Rising in North America Get Free Sample
The global landscape is led by APAC, which holds the largest market share due to aggressive national hydrogen strategies in countries like China, Japan, and South Korea.
North America is the fastest-growing region, projected to contribute 33.6% of the market's incremental growth, driven by robust federal incentives in the United States for green hydrogen production and the build-out of hydrogen refueling infrastructure for heavy-duty mobility.
Europe's market is defined by strong policy integration, particularly emission reduction mandates that accelerate adoption in public transport and maritime propulsion. The Middle East is an emerging hub, leveraging its low-cost renewable energy to develop large-scale hydrogen production projects.
Fuel cell integration in microgrids and the expansion of stationary power generation are key focus areas across all regions, supporting energy security and decarbonization targets.
Market Dynamics
Our researchers analyzed the data with 2025 as the base year, along with the key drivers, trends, and challenges. A holistic analysis of drivers will help companies refine their marketing strategies to gain a competitive advantage.
- Strategic decision-making in the global fuel cell market 2026-2030 hinges on a nuanced understanding of specific use cases and competitive positioning. When evaluating fuel cell vs battery for heavy transport, a key consideration is the superior range and faster refueling times offered by hydrogen-powered systems, which is critical for long-haul logistics.
- The deployment of solid oxide fuel cells for data centers provides a reliable, high-efficiency power source that supports sustainability goals. However, a detailed cost analysis of hydrogen refueling stations reveals significant capital investment is required, a primary barrier to widespread adoption. The environmental benefits of fuel cell technology are substantial, offering a pathway to decarbonize hard-to-abate sectors.
- For instance, the use of molten carbonate fuel cell carbon capture systems in industrial settings can reduce emissions by over 90% compared to legacy processes, directly impacting compliance planning. As the maritime industry faces stricter regulations, fuel cell systems for the maritime industry are becoming increasingly viable.
- Efforts to improve fuel cell stack durability and promote fuel cell integration in microgrids are enhancing their value proposition for remote power and commercial buildings. Advancements in anion exchange membrane technology and PEMFC catalyst cost reduction strategies are addressing key cost challenges.
- Simultaneously, challenges in green hydrogen production and the growing use of hydrogen fuel cells for public transit highlight the interconnected nature of technology and infrastructure development.
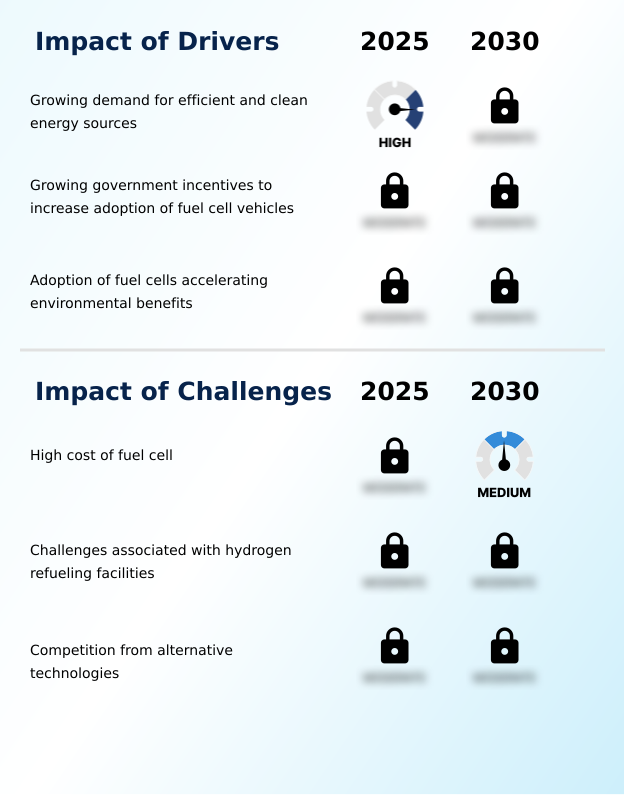
What are the key market drivers leading to the rise in the adoption of Fuel Cell Industry?
- The growing demand for efficient and clean energy sources is a primary driver fueling the market's expansion across transportation and stationary power sectors.
- Market growth is primarily driven by the global demand for clean energy and stringent emission reduction mandates. Governments worldwide are providing incentives to accelerate the clean energy transition, supporting the adoption of zero-emission power solutions.
- Fuel cells offer significant environmental benefits, with systems running on green hydrogen producing only water as a byproduct, directly contributing to corporate sustainability goals.
- The technology's high efficiency, with some stationary power generation systems exceeding 60% electrical efficiency, makes it an attractive alternative to conventional power.
- The need for enhanced energy security and grid balancing is also a major driver, as fuel cells can provide a continuous and reliable baseload power supply, unlike intermittent renewables. This is particularly critical for backup power solutions in essential facilities.
What are the market trends shaping the Fuel Cell Industry?
- Increasing investment in research and development activities is a key market trend. This is driving innovation in materials and system efficiency, accelerating commercial viability.
- Key trends are reshaping the market, driven by intense R&D to enhance electrical efficiency and reduce costs. The rising adoption of microgrids is creating significant opportunities, as fuel cells provide reliable decentralized energy systems for commercial and industrial users seeking energy resilience. In these applications, uptime can be improved by over 25% compared to grid-only power.
- The global push to expand the hydrogen economy is leading to major investments in hydrogen production and refueling infrastructure, which is essential for heavy-duty mobility. Advances in thermal management systems and the development of molten carbonate fuel cell (MCFC) technology are expanding applications in industrial cogeneration.
- These trends are supported by a focus on improving catalyst durability and achieving decarbonization targets across multiple sectors, including aviation power systems.
What challenges does the Fuel Cell Industry face during its growth?
- The high initial cost of fuel cell systems remains a key challenge, affecting the pace of widespread adoption and market growth.
- Despite strong drivers, significant challenges persist, primarily the high upfront cost of fuel cell systems compared to incumbent technologies. The reliance on expensive materials, such as platinum in a proton exchange membrane fuel cell (PEMFC), contributes to this cost barrier, with catalysts accounting for up to 40% of the stack cost.
- Another major hurdle is the lack of widespread hydrogen refueling infrastructure, which creates a classic chicken-and-egg problem limiting the adoption of fuel cell vehicles for long-haul transport solutions. Competition from rapidly improving battery technology, especially in the passenger vehicle segment, also presents a formidable challenge.
- Furthermore, developing cost-effective and safe onboard hydrogen storage systems and scaling up green hydrogen production via electrolysis technology remain critical obstacles to mass-market commercialization.
Exclusive Technavio Analysis on Customer Landscape
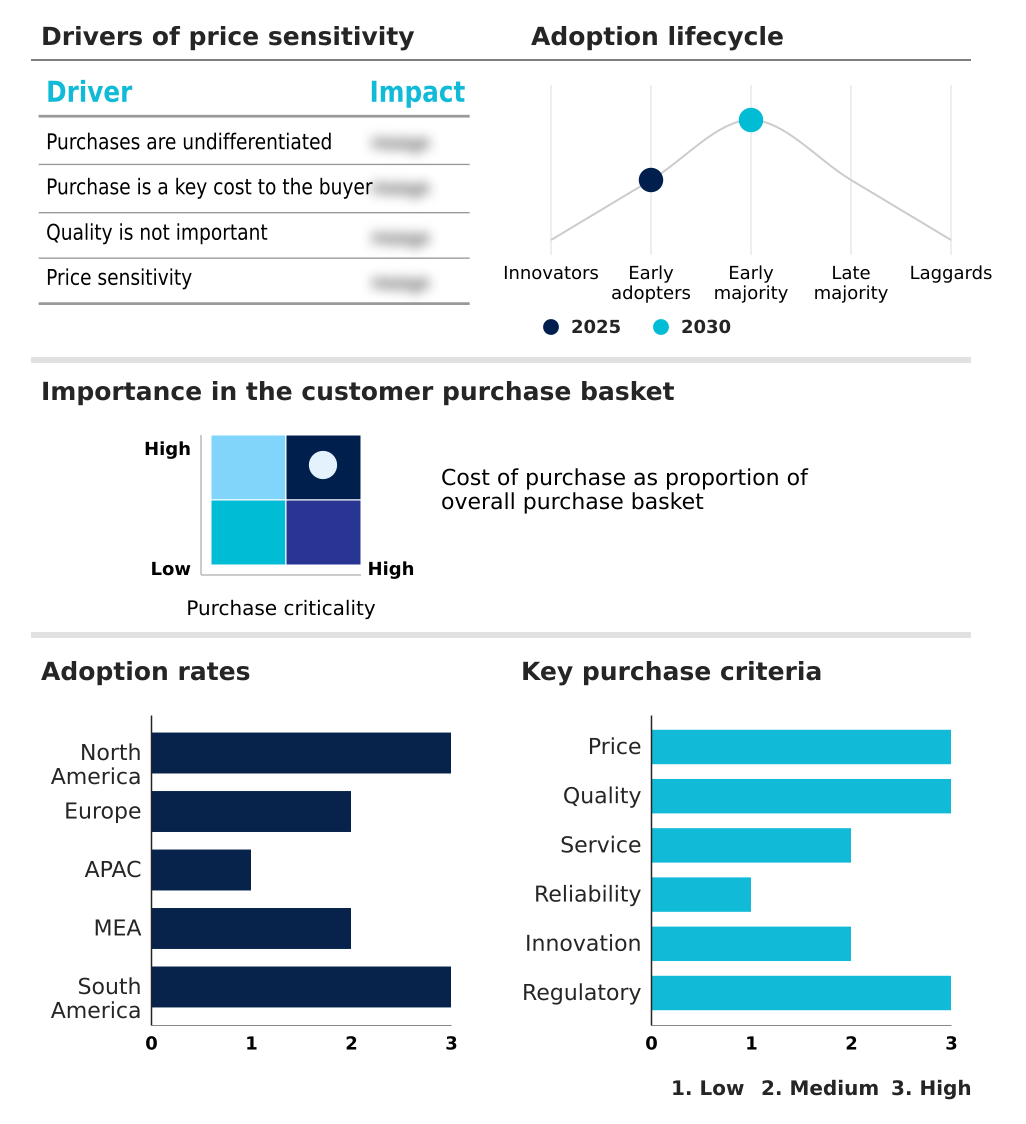
The fuel cell market forecasting report includes the adoption lifecycle of the market, covering from the innovator’s stage to the laggard’s stage. It focuses on adoption rates in different regions based on penetration. Furthermore, the fuel cell market report also includes key purchase criteria and drivers of price sensitivity to help companies evaluate and develop their market growth analysis strategies.
Customer Landscape of Fuel Cell Industry
Competitive Landscape
Companies are implementing various strategies, such as strategic alliances, fuel cell market forecast, partnerships, mergers and acquisitions, geographical expansion, and product/service launches, to enhance their presence in the industry.
Ballard Power Systems Inc. - Offerings include clean energy fuel cell solutions engineered for high performance and reliability across a range of applications, supporting the global shift toward decarbonization.
The industry research and growth report includes detailed analyses of the competitive landscape of the market and information about key companies, including:
- Ballard Power Systems Inc.
- Bloom Energy Corp.
- Blue World Technologies ApS
- Ceres Power Holdings plc
- Doosan Corp.
- FuelCell Energy Inc.
- Fuji Electric Co. Ltd.
- Honda Motor Co. Ltd.
- Kyocera Corp.
- General Motors Co.
- Horizon Fuel Cell Technologies
- Hyundai Motor Co.
- Intelligent Energy Ltd.
- Mitsubishi Heavy Industries
- Niterra Co. Ltd.
- Panasonic Holdings Corp.
- Plug Power Inc.
- PowerCell Sweden AB
- Toshiba Corp.
- Watt Fuel Cell Corp.
Qualitative and quantitative analysis of companies has been conducted to help clients understand the wider business environment as well as the strengths and weaknesses of key industry players. Data is qualitatively analyzed to categorize companies as pure play, category-focused, industry-focused, and diversified; it is quantitatively analyzed to categorize companies as dominant, leading, strong, tentative, and weak.
Recent Development and News in Fuel cell market
- In August 2025, Honda Motor Co. Ltd. initiated production of its 2025 CR-V e:FCEV in the United States, the first domestically manufactured plug-in hydrogen fuel cell electric vehicle, developed in collaboration with General Motors Co.
- In November 2025, Doosan Fuel Cell secured a twenty-year agreement with the Korea Electric Power Corporation to supply and maintain hydrogen fuel cell power systems, reinforcing South Korea's national hydrogen economy.
- In January 2026, General Motors Co. and Honda Motor Co. Ltd. announced plans to conclude their joint venture for fuel cell system manufacturing in Michigan by the end of the year, as GM shifts its capital focus to battery-electric platforms.
- In April 2025, Hyundai Motor Co. launched the all-new NEXO, featuring a redesigned fuel cell system that delivers an extended range of over 800 kilometers, reaffirming its commitment to the passenger fuel cell vehicle segment.
Dive into Technavio’s robust research methodology, blending expert interviews, extensive data synthesis, and validated models for unparalleled Fuel Cell Market insights. See full methodology.
| Market Scope | |
|---|---|
| Page number | 310 |
| Base year | 2025 |
| Historic period | 2020-2024 |
| Forecast period | 2026-2030 |
| Growth momentum & CAGR | Accelerate at a CAGR of 39.5% |
| Market growth 2026-2030 | USD 59512.4 million |
| Market structure | Fragmented |
| YoY growth 2025-2026(%) | 28.5% |
| Key countries | US, Canada, Mexico, Germany, UK, France, Italy, Spain, The Netherlands, China, India, South Korea, Japan, Australia, Indonesia, Saudi Arabia, UAE, South Africa, Israel, Turkey, Brazil, Argentina and Chile |
| Competitive landscape | Leading Companies, Market Positioning of Companies, Competitive Strategies, and Industry Risks |
Research Analyst Overview
- The fuel cell market is advancing through critical innovations in core components and system integration. Progress in materials science is central, with a focus on developing more efficient anode and cathode materials and improving catalyst durability.
- A key objective is reducing reliance on expensive platinum-group metal catalysts through new formulations and enhanced anion exchange membrane technology, with some labs achieving a 30% reduction in platinum loading without sacrificing power density. Developments in membrane electrode assembly (MEA) and bipolar plates are improving the overall efficiency and longevity of the fuel cell stack.
- Beyond the stack, advancements in balance of plant (BOP) components, including thermal management systems and fuel reforming technologies, are crucial for commercial viability. The market is also heavily dependent on breakthroughs in hydrogen production, particularly scalable electrolysis technology for green hydrogen production, and more efficient hydrogen storage systems.
- These technological shifts directly influence boardroom decisions regarding capital investment in R&D for next-generation systems with greater fuel flexibility and integrated carbon capture capabilities versus procuring current-generation technology.
What are the Key Data Covered in this Fuel Cell Market Research and Growth Report?
-
What is the expected growth of the Fuel Cell Market between 2026 and 2030?
-
USD 59.51 billion, at a CAGR of 39.5%
-
-
What segmentation does the market report cover?
-
The report is segmented by Product (PEMFC, PAFC, SOFC, and Others), Application (Transport, Stationary, and Portable), Source (Hydrogen powered, Natural gas powered, Methanol powered, Biogas powered, and Hydrocarbons powered) and Geography (North America, Europe, APAC, Middle East and Africa, South America)
-
-
Which regions are analyzed in the report?
-
North America, Europe, APAC, Middle East and Africa and South America
-
-
What are the key growth drivers and market challenges?
-
Growing demand for efficient and clean energy sources, High cost of fuel cell
-
-
Who are the major players in the Fuel Cell Market?
-
Ballard Power Systems Inc., Bloom Energy Corp., Blue World Technologies ApS, Ceres Power Holdings plc, Doosan Corp., FuelCell Energy Inc., Fuji Electric Co. Ltd., Honda Motor Co. Ltd., Kyocera Corp., General Motors Co., Horizon Fuel Cell Technologies, Hyundai Motor Co., Intelligent Energy Ltd., Mitsubishi Heavy Industries, Niterra Co. Ltd., Panasonic Holdings Corp., Plug Power Inc., PowerCell Sweden AB, Toshiba Corp. and Watt Fuel Cell Corp.
-
Market Research Insights
- The market dynamics are increasingly shaped by the push for energy resilience and the build-out of a global hydrogen economy. The adoption of decentralized energy systems is accelerating, with fuel cells offering a reliable baseload power supply that improves grid stability. In critical facilities, these systems have demonstrated over 99.9% uptime, a significant improvement compared to grid-dependent solutions.
- This reliability supports microgrid applications and provides robust backup power solutions. The move toward public transport decarbonization is another key dynamic, where fuel cell buses offer longer operational ranges than their battery counterparts. Stationary power generation, especially for data centers and industrial cogeneration, is expanding as fuel cells achieve electrical efficiencies exceeding 60%, directly reducing operational costs and supporting decarbonization targets.
We can help! Our analysts can customize this fuel cell market research report to meet your requirements.
 RIA -
RIA - 
