Electromagnetic Compatibility (EMC) Test Equipment Market Analysis, Size, and Forecast 2026-2030: APAC (China, Japan, and South Korea), North America (US, Canada, and Mexico), Europe (Germany, UK, and France), South America (Brazil and Argentina), Middle East and Africa (Saudi Arabia, UAE, and South Africa), and Rest of World (ROW)

Electromagnetic Compatibility (EMC) Test Equipment Market Analysis, Size, and Forecast 2026-2030:
APAC (China, Japan, and South Korea), North America (US, Canada, and Mexico), Europe (Germany, UK, and France), South America (Brazil and Argentina), Middle East and Africa (Saudi Arabia, UAE, and South Africa), and Rest of World (ROW)

Published: Apr 2026 315 Pages SKU: IRTNTR46530

Market Overview at a Glance

$2.45 B
Market Opportunity
5.6%
CAGR 2025 - 2030
43.4%
APAC Growth
$2.66 B
Consumer electronics segment 2024

Electromagnetic Compatibility (EMC) Test Equipment Market Size 2026-2030

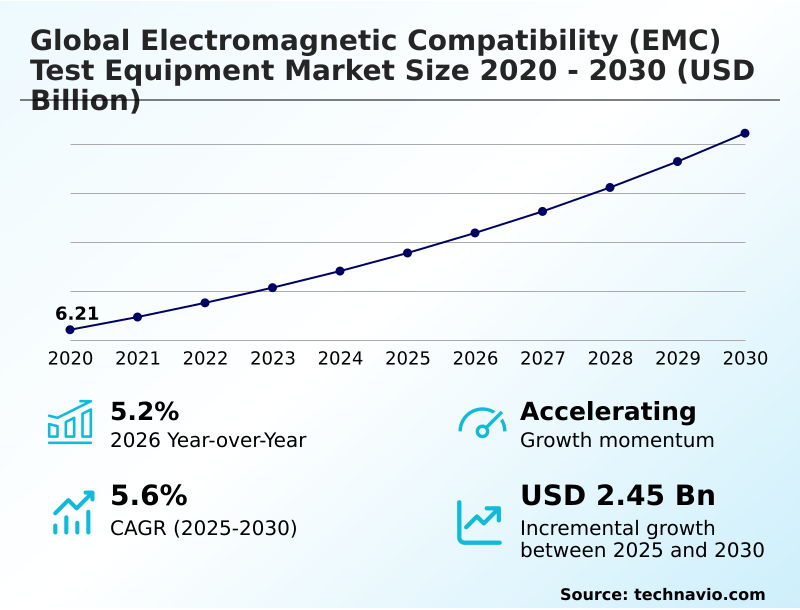
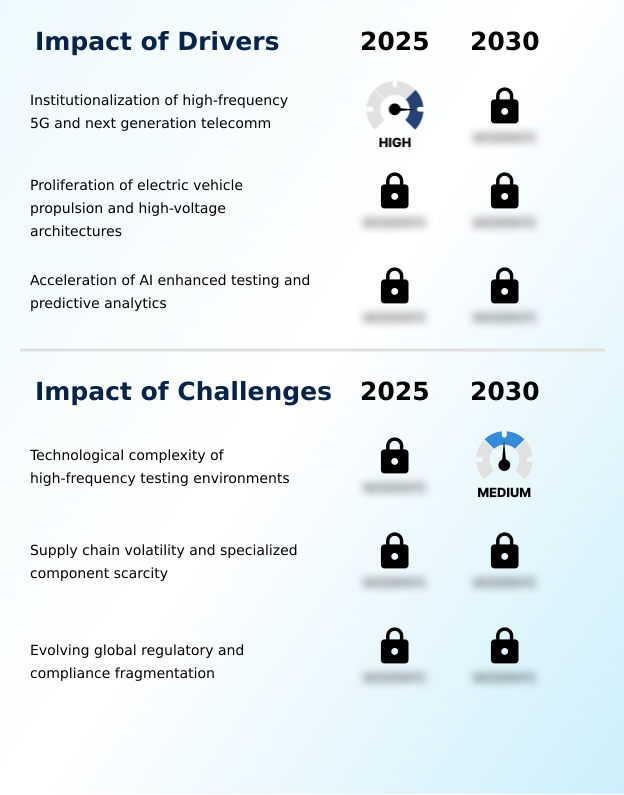
The electromagnetic compatibility (emc) test equipment market size is valued to increase by USD 2.45 billion, at a CAGR of 5.6% from 2025 to 2030. Institutionalization of high-frequency 5G and next generation telecomm will drive the electromagnetic compatibility (emc) test equipment market.

Major Market Trends & Insights

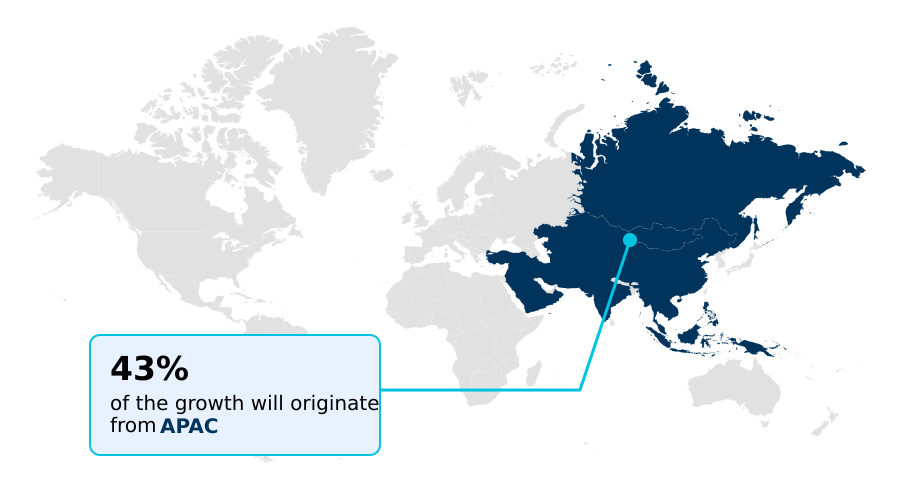
  • APAC dominated the market and accounted for a 43.4% growth during the forecast period.
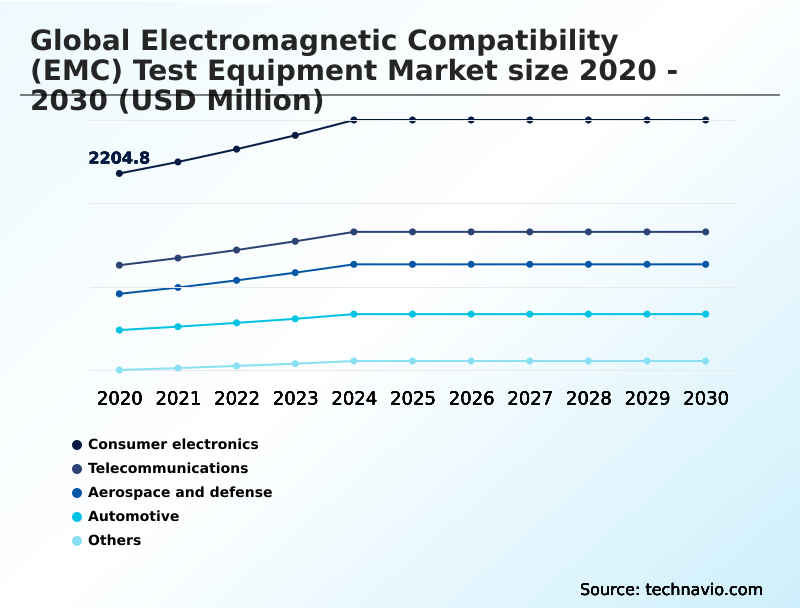
  • By End-user - Consumer electronics segment was valued at USD 2.66 billion in 2024
  • By Product - EMI test receiver segment accounted for the largest market revenue share in 2024

Market Size & Forecast

  • Market Opportunities: USD 4.02 billion
  • Market Future Opportunities: USD 2.45 billion
  • CAGR from 2025 to 2030 : 5.6%

Market Summary

  • The electromagnetic compatibility (EMC) test equipment market is defined by the critical need to ensure electronic devices function without causing or succumbing to interference. Growth is fueled by the proliferation of high-frequency 5G networks and the complex high-voltage architectures of electric vehicles. Key trends include the integration of AI-powered predictive analytics to accelerate validation, with automated compliance frameworks becoming standard.
  • For instance, an automotive OEM developing an electric SUV utilizes hardware-in-the-loop simulation and digital twin integration for pre-compliance testing of its powertrain. This allows engineers to assess electromagnetic immunity and manage conducted emissions from the battery management system early in the design phase, ensuring the vehicle's advanced driver-assistance systems are not compromised.
  • However, challenges persist, including the technical complexity of millimeter-wave frequency testing and supply chain constraints on specialized radio-frequency components. The industry is responding with modular, software-defined solutions, from advanced EMI test receivers and spectrum analyzers to full anechoic chambers, to address these evolving requirements for robust electromagnetic shielding and signal integrity validation.

What will be the Size of the Electromagnetic Compatibility (EMC) Test Equipment Market during the forecast period?

Get Key Insights on Market Forecast (PDF) Get Free Sample

How is the Electromagnetic Compatibility (EMC) Test Equipment Market Segmented?

The electromagnetic compatibility (emc) test equipment industry research report provides comprehensive data (region-wise segment analysis), with forecasts and estimates in "USD million" for the period 2026-2030, as well as historical data from 2020-2024 for the following segments.

  • End-user
    • Consumer electronics
    • Telecommunications
    • Aerospace and defense
    • Automotive
    • Others
  • Product
    • EMI test receiver
    • Signal generator
    • Broadband amplifiers
    • Spectrum analyzer
    • Others
  • Application
    • Third-party laboratories
    • In-house laboratories
    • Governments
  • Geography
    • APAC
      • China
      • Japan
      • South Korea
    • North America
      • US
      • Canada
      • Mexico
    • Europe
      • Germany
      • UK
      • France
    • South America
      • Brazil
      • Argentina
    • Middle East and Africa
      • Saudi Arabia
      • UAE
      • South Africa
    • Rest of World (ROW)

By End-user Insights

The consumer electronics segment is estimated to witness significant growth during the forecast period.

The consumer electronics segment mandates rapid, high-fidelity validation to support compressed product launch cycles. The integration of high-frequency wireless protocols into compact devices complicates internal electromagnetic shielding, elevating the importance of pre-compliance testing.

Engineering teams now leverage digital twin integration and hardware-in-the-loop simulation to model complex component interactions and forecast performance early in the design phase.

This proactive approach, focused on EMC design for compliance, aims to ensure devices pass stringent radiated immunity testing and conducted susceptibility testing during final certification.

Firms are increasingly performing shielding effectiveness measurement and other forms of EMC troubleshooting in-house, reducing dependency on external labs with EMC laboratory accreditation.

While full validation may require reverberation chambers, the use of on-site EMC testing and specialized EMC consulting services for complex products is growing, with advanced EMI filter bandwidths analysis improving diagnostic precision by over 15%.

Get Free Sample

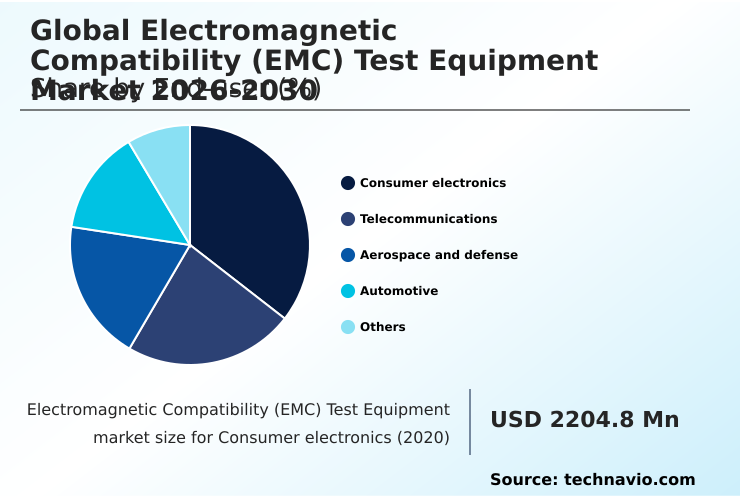
The Consumer electronics segment was valued at USD 2.66 billion in 2024 and showed a gradual increase during the forecast period.

Get Free Sample

Regional Analysis

APAC is estimated to contribute 43.4% to the growth of the global market during the forecast period.Technavio’s analysts have elaborately explained the regional trends and drivers that shape the market during the forecast period.

See How Electromagnetic Compatibility (EMC) Test Equipment Market Demand is Rising in APAC Get Free Sample

The market's geographic landscape is characterized by distinct regional priorities.

APAC is poised to contribute over 43% of the market's incremental growth, fueled by its dominance in high-volume electronics manufacturing, which drives demand for production-line tools like ESD simulators and EMI probes.

In contrast, North America and Europe emphasize research and development in high-stakes industries, creating strong demand for specialized test solutions that meet stringent aerospace EMC requirements and defense EMC standards.

This includes the use of high-gain antennas for long-range communication testing and surge generators for immunity validation.

Globally, medical device EMC compliance is a non-negotiable standard, while evolving telecommunication EMC regulations for 5G require advanced network analyzers and RF power meters.

Concurrently, the rise of industrial automation EMC is increasing the need for portable field probes to conduct on-site verification and diagnostics.

Market Dynamics

Our researchers analyzed the data with 2025 as the base year, along with the key drivers, trends, and challenges. A holistic analysis of drivers will help companies refine their marketing strategies to gain a competitive advantage.

  • Ensuring electronic product reliability in a dense signal environment requires a multifaceted approach to validation. For instance, developing compliant connected products necessitates robust emc testing for iot devices to prevent interference.
  • In the automotive sector, the focus is on emi shielding for consumer electronics integrated into the dashboard and comprehensive emc testing for electric vehicles, which includes the emc validation of electric drivetrains to ensure safety and performance. The process often begins with using a spectrum analyzer for emi troubleshooting at the component level.
  • For high-stakes applications, adherence to strict protocols is mandatory, such as following mil-std-461 emc test procedures in defense and emc testing for medical device certification in healthcare. Achieving certification requires measuring radiated emissions in anechoic chambers and following cispr standards for emc compliance.
  • Both emi test receiver for compliance testing and broadband amplifiers for susceptibility testing are foundational tools in this process. The industrial sector is also seeing increased focus on emc testing for industrial automation, while the aerospace and defense sector requires specialized emc test for aerospace and defense.
  • This rigorous testing ecosystem ensures that devices from all sectors operate safely and effectively.

What are the key market drivers leading to the rise in the adoption of Electromagnetic Compatibility (EMC) Test Equipment Industry?

  • The institutionalization of high-frequency 5G and next-generation telecommunications infrastructure serves as a key market driver, increasing demand for advanced testing solutions.

  • Market growth is fundamentally driven by the dual trends of next-generation telecommunications and vehicle electrification. The rollout of 5G and 6G networks necessitates sophisticated high-frequency testing at millimeter-wave frequencies, demanding advanced signal integrity validation.
  • Concurrently, the automotive industry's shift to electric vehicles requires extensive full-vehicle antenna testing and validation of components within specialized EMC test chambers to manage conducted emissions and ensure electromagnetic immunity.
  • This has spurred demand for comprehensive EMC testing services and EMC certification solutions that include wireless testing solutions and over-the-air calibration.
  • Essential technologies like electromagnetic shielding and specialized RF shielding components are critical for ensuring that densely packed electronic systems coexist without interference, making robust compliance a prerequisite for market entry.

What are the market trends shaping the Electromagnetic Compatibility (EMC) Test Equipment Industry?

  • The industrialization of AI-driven automated compliance frameworks represents a significant market trend. This evolution is set to streamline complex testing protocols and improve the overall efficiency of regulatory validation.

  • Key market trends are centered on automation and advanced simulation to manage increasing product complexity. The adoption of automated compliance frameworks, which leverage predictive analytics in testing, has been shown to reduce certification timelines for complex 5G infrastructure by nearly 30%.
  • This shift toward intelligent validation is supported by next-generation instrumentation, including the EMI test receiver, signal generator, and spectrum analyzer, all capable of real-time spectrum analysis. For immunity assessments, high-power broadband amplifiers and transient generators are essential for simulating high-intensity radiated fields and electromagnetic pulse simulation.
  • These tests are conducted in controlled environments like anechoic chambers to accurately measure radiated emissions. The industry is also seeing advancements in sub-terahertz materials characterization, pushing the boundaries of high-frequency measurement.

What challenges does the Electromagnetic Compatibility (EMC) Test Equipment Industry face during its growth?

  • The technological complexity inherent in high-frequency testing environments poses a key challenge that affects the industry's growth trajectory.

  • Navigating the market's challenges requires addressing technical complexity, supply chain instability, and regulatory fragmentation. Adherence to evolving standards like CISPR 16-1-1 for commercial goods and MIL-STD-461 for defense applications is increasingly difficult. The rise of high-voltage architectures in electric vehicles, governed by standards such as ISO 7637, creates significant validation hurdles.
  • While technologies like time-domain scanning and quasi-peak detectors enhance measurement speed, the scarcity of critical radio-frequency components has inflated costs by over 28%. This impacts the price of essential hardware, including line impedance stabilization networks and high-power transient generators.
  • Although electromagnetic simulation software aids in early design, verifying electromagnetic susceptibility and performing reliable transient interference detection still requires rigorous physical testing guided by comprehensive EMC test plans.

Exclusive Technavio Analysis on Customer Landscape

The electromagnetic compatibility (emc) test equipment market forecasting report includes the adoption lifecycle of the market, covering from the innovator’s stage to the laggard’s stage. It focuses on adoption rates in different regions based on penetration. Furthermore, the electromagnetic compatibility (emc) test equipment market report also includes key purchase criteria and drivers of price sensitivity to help companies evaluate and develop their market growth analysis strategies.

Customer Landscape of Electromagnetic Compatibility (EMC) Test Equipment Industry

Competitive Landscape

Companies are implementing various strategies, such as strategic alliances, electromagnetic compatibility (emc) test equipment market forecast, partnerships, mergers and acquisitions, geographical expansion, and product/service launches, to enhance their presence in the industry.

AMETEK Inc. - Offers specialized EMC test equipment, including signal generators and analytical instruments, for verifying device compliance in complex electromagnetic environments.

The industry research and growth report includes detailed analyses of the competitive landscape of the market and information about key companies, including:

  • AMETEK Inc.
  • Amplifier Research
  • Anritsu Corp.
  • Bureau Veritas
  • Com Power Corp.
  • DEKRA SE
  • ESCO Technologies Inc.
  • Eurofins Scientific SE
  • Fortive Corp.
  • Frankonia Solutions GmbH
  • GAUSS INSTRUMENTS Intl. GmbH
  • Good Will Instrument Co. Ltd.
  • Intertek Group Plc
  • Keysight Technologies Inc.
  • Laird Connectivity
  • Parker Hannifin Corp.
  • Rohde and Schwarz GmbH
  • SGS SA
  • TUV SUD AG

Qualitative and quantitative analysis of companies has been conducted to help clients understand the wider business environment as well as the strengths and weaknesses of key industry players. Data is qualitatively analyzed to categorize companies as pure play, category-focused, industry-focused, and diversified; it is quantitatively analyzed to categorize companies as dominant, leading, strong, tentative, and weak.

Recent Development and News in Electromagnetic compatibility (emc) test equipment market

  • In October 2024, Keysight Technologies released a significant upgrade to its PXE EMI Receiver, introducing real-time Time Domain Scanning up to 1 GHz to accelerate the certification process for high-speed consumer devices.
  • In November 2024, Rohde and Schwarz introduced a comprehensive new hardware-in-the-loop simulation environment that allows engineers to perform full-spectrum electromagnetic compatibility validation of electric drivetrains before physical prototypes are constructed.
  • In January 2025, Anritsu Corp. enhanced its field testing portfolio by launching an ultra-portable millimeter-wave spectrum analyzer engineered to address complex interference patterns in dense standalone 5G network environments.
  • In April 2025, TUV Rheinland launched an AI-assisted pre-compliance screening service for data center compute clusters, utilizing machine learning for failure prediction and automated spectrum analysis to identify interference issues more rapidly.

Dive into Technavio’s robust research methodology, blending expert interviews, extensive data synthesis, and validated models for unparalleled Electromagnetic Compatibility (EMC) Test Equipment Market insights. See full methodology.

Market Scope
Page number 315
Base year 2025
Historic period 2020-2024
Forecast period 2026-2030
Growth momentum & CAGR Accelerate at a CAGR of 5.6%
Market growth 2026-2030 USD 2449.8 million
Market structure Fragmented
YoY growth 2025-2026(%) 5.2%
Key countries China, Japan, South Korea, India, Australia, Indonesia, US, Canada, Mexico, Germany, UK, France, Italy, The Netherlands, Spain, Brazil, Argentina, Chile, Saudi Arabia, UAE, South Africa, Israel and Turkey
Competitive landscape Leading Companies, Market Positioning of Companies, Competitive Strategies, and Industry Risks

Request Free Sample

Research Analyst Overview

  • The electromagnetic compatibility (EMC) test equipment market is evolving beyond simple compliance, becoming a strategic enabler of technological innovation. The convergence of high-frequency testing for 5G and the demands of high-voltage architectures in electric vehicles necessitates a new class of instrumentation.
  • Boardroom decisions increasingly center on upfront investment in pre-compliance testing and digital twin integration to de-risk product launches, a strategy validated by data showing AI-driven platforms can reduce certification timelines by up to 30%. Core instrumentation, including the EMI test receiver, signal generator, and spectrum analyzer, now features advanced time-domain scanning.
  • Broadband amplifiers and transient generators are crucial for radiated immunity testing and conducted susceptibility testing. Validation occurs within anechoic chambers or reverberation chambers, using tools like EMI probes, field probes, and high-gain antennas.
  • Adherence to standards such as CISPR 16-1-1, MIL-STD-461, and ISO 7637 is managed with specialized equipment like ESD simulators, surge generators, and line impedance stabilization networks, all underpinned by precise network analyzers and RF power meters to ensure complete system integrity.

What are the Key Data Covered in this Electromagnetic Compatibility (EMC) Test Equipment Market Research and Growth Report?

  • What is the expected growth of the Electromagnetic Compatibility (EMC) Test Equipment Market between 2026 and 2030?

    • USD 2.45 billion, at a CAGR of 5.6%

  • What segmentation does the market report cover?

    • The report is segmented by End-user (Consumer electronics, Telecommunications, Aerospace and defense, Automotive, and Others), Product (EMI test receiver, Signal generator, Broadband amplifiers, Spectrum analyzer, and Others), Application (Third-party laboratories, In-house laboratories, and Governments) and Geography (APAC, North America, Europe, South America, Middle East and Africa)

  • Which regions are analyzed in the report?

    • APAC, North America, Europe, South America and Middle East and Africa

  • What are the key growth drivers and market challenges?

    • Institutionalization of high-frequency 5G and next generation telecomm, Technological complexity of high-frequency testing environments

  • Who are the major players in the Electromagnetic Compatibility (EMC) Test Equipment Market?

    • AMETEK Inc., Amplifier Research, Anritsu Corp., Bureau Veritas, Com Power Corp., DEKRA SE, ESCO Technologies Inc., Eurofins Scientific SE, Fortive Corp., Frankonia Solutions GmbH, GAUSS INSTRUMENTS Intl. GmbH, Good Will Instrument Co. Ltd., Intertek Group Plc, Keysight Technologies Inc., Laird Connectivity, Parker Hannifin Corp., Rohde and Schwarz GmbH, SGS SA and TUV SUD AG

Market Research Insights

  • The market is shaped by a strategic shift toward proactive validation, where automated compliance frameworks are reducing certification timelines by up to 30%. Organizations are adopting advanced EMC testing services and comprehensive EMC certification solutions to mitigate risks associated with regulatory non-compliance, which can necessitate retrofits in nearly 40% of new industrial automation systems.
  • The proliferation of electric vehicles is driving investment in full-vehicle antenna testing, while the aerospace sector relies on sophisticated over-the-air calibration for mission-critical systems. Predictive analytics in testing, combined with advanced wireless testing solutions, enables engineers to forecast and resolve potential interference issues, ensuring robust signal integrity validation across a complex and crowded electromagnetic spectrum.

We can help! Our analysts can customize this electromagnetic compatibility (emc) test equipment market research report to meet your requirements.

Get in touch

1. Executive Summary

1.1 Market overview

Executive Summary - Chart on Market Overview
Executive Summary - Data Table on Market Overview
Executive Summary - Chart on Global Market Characteristics
Executive Summary - Chart on Market by Geography
Executive Summary - Chart on Market Segmentation by End-user
Executive Summary - Chart on Market Segmentation by Product
Executive Summary - Chart on Market Segmentation by Application
Executive Summary - Chart on Incremental Growth
Executive Summary - Data Table on Incremental Growth
Executive Summary - Chart on Company Market Positioning

2. Technavio Analysis

2.1 Analysis of price sensitivity, lifecycle, customer purchase basket, adoption rates, and purchase criteria

2.2 Criticality of inputs and Factors of differentiation

Chart on Overview on criticality of inputs and factors of differentiation

2.3 Factors of disruption

Chart on Overview on factors of disruption

2.4 Impact of drivers and challenges

Chart on Impact of drivers and challenges in 2025 and 2030

3. Market Landscape

3.1 Market ecosystem

Chart on Parent Market
Data Table on - Parent Market

3.2 Market characteristics

Chart on Market characteristics analysis

3.3 Value chain analysis

Chart on Value chain analysis

4. Market Sizing

4.1 Market definition

Data Table on Offerings of companies included in the market definition

4.2 Market segment analysis

Market segments

4.3 Market size 2025

4.4 Market outlook: Forecast for 2025-2030

Chart on Global - Market size and forecast 2025-2030 ($ million)
Data Table on Global - Market size and forecast 2025-2030 ($ million)
Chart on Global Market: Year-over-year growth 2025-2030 (%)
Data Table on Global Market: Year-over-year growth 2025-2030 (%)

5. Historic Market Size

5.1 Global Electromagnetic Compatibility (EMC) Test Equipment Market 2020 - 2024

Historic Market Size - Data Table on Global Electromagnetic Compatibility (EMC) Test Equipment Market 2020 - 2024 ($ million)

5.2 End-user segment analysis 2020 - 2024

Historic Market Size - End-user Segment 2020 - 2024 ($ million)

5.3 Product segment analysis 2020 - 2024

Historic Market Size - Product Segment 2020 - 2024 ($ million)

5.4 Application segment analysis 2020 - 2024

Historic Market Size - Application Segment 2020 - 2024 ($ million)

5.5 Geography segment analysis 2020 - 2024

Historic Market Size - Geography Segment 2020 - 2024 ($ million)

5.6 Country segment analysis 2020 - 2024

Historic Market Size - Country Segment 2020 - 2024 ($ million)

6. Qualitative Analysis

6.1 Impact of AI on global electromagnetic compatibility (EMC) test equipment market

6.2 Impact of geopolitical conflict on global electromagnetic compatibility (EMC) test equipment market

7. Five Forces Analysis

7.1 Five forces summary

Five forces analysis - Comparison between 2025 and 2030

7.2 Bargaining power of buyers

Bargaining power of buyers - Impact of key factors 2025 and 2030

7.3 Bargaining power of suppliers

Bargaining power of suppliers - Impact of key factors in 2025 and 2030

7.4 Threat of new entrants

Threat of new entrants - Impact of key factors in 2025 and 2030

7.5 Threat of substitutes

Threat of substitutes - Impact of key factors in 2025 and 2030

7.6 Threat of rivalry

Threat of rivalry - Impact of key factors in 2025 and 2030

7.7 Market condition

Chart on Market condition - Five forces 2025 and 2030

8. Market Segmentation by End-user

8.1 Market segments

Chart on End-user - Market share 2025-2030 (%)
Data Table on End-user - Market share 2025-2030 (%)

8.2 Comparison by End-user

Chart on Comparison by End-user
Data Table on Comparison by End-user

8.3 Consumer electronics - Market size and forecast 2025-2030

Chart on Consumer electronics - Market size and forecast 2025-2030 ($ million)
Data Table on Consumer electronics - Market size and forecast 2025-2030 ($ million)
Chart on Consumer electronics - Year-over-year growth 2025-2030 (%)
Data Table on Consumer electronics - Year-over-year growth 2025-2030 (%)

8.4 Telecommunications - Market size and forecast 2025-2030

Chart on Telecommunications - Market size and forecast 2025-2030 ($ million)
Data Table on Telecommunications - Market size and forecast 2025-2030 ($ million)
Chart on Telecommunications - Year-over-year growth 2025-2030 (%)
Data Table on Telecommunications - Year-over-year growth 2025-2030 (%)

8.5 Aerospace and defense - Market size and forecast 2025-2030

Chart on Aerospace and defense - Market size and forecast 2025-2030 ($ million)
Data Table on Aerospace and defense - Market size and forecast 2025-2030 ($ million)
Chart on Aerospace and defense - Year-over-year growth 2025-2030 (%)
Data Table on Aerospace and defense - Year-over-year growth 2025-2030 (%)

8.6 Automotive - Market size and forecast 2025-2030

Chart on Automotive - Market size and forecast 2025-2030 ($ million)
Data Table on Automotive - Market size and forecast 2025-2030 ($ million)
Chart on Automotive - Year-over-year growth 2025-2030 (%)
Data Table on Automotive - Year-over-year growth 2025-2030 (%)

8.7 Others - Market size and forecast 2025-2030

Chart on Others - Market size and forecast 2025-2030 ($ million)
Data Table on Others - Market size and forecast 2025-2030 ($ million)
Chart on Others - Year-over-year growth 2025-2030 (%)
Data Table on Others - Year-over-year growth 2025-2030 (%)

8.8 Market opportunity by End-user

Market opportunity by End-user ($ million)
Data Table on Market opportunity by End-user ($ million)

9. Market Segmentation by Product

9.1 Market segments

Chart on Product - Market share 2025-2030 (%)
Data Table on Product - Market share 2025-2030 (%)

9.2 Comparison by Product

Chart on Comparison by Product
Data Table on Comparison by Product

9.3 EMI test receiver - Market size and forecast 2025-2030

Chart on EMI test receiver - Market size and forecast 2025-2030 ($ million)
Data Table on EMI test receiver - Market size and forecast 2025-2030 ($ million)
Chart on EMI test receiver - Year-over-year growth 2025-2030 (%)
Data Table on EMI test receiver - Year-over-year growth 2025-2030 (%)

9.4 Signal generator - Market size and forecast 2025-2030

Chart on Signal generator - Market size and forecast 2025-2030 ($ million)
Data Table on Signal generator - Market size and forecast 2025-2030 ($ million)
Chart on Signal generator - Year-over-year growth 2025-2030 (%)
Data Table on Signal generator - Year-over-year growth 2025-2030 (%)

9.5 Broadband amplifiers - Market size and forecast 2025-2030

Chart on Broadband amplifiers - Market size and forecast 2025-2030 ($ million)
Data Table on Broadband amplifiers - Market size and forecast 2025-2030 ($ million)
Chart on Broadband amplifiers - Year-over-year growth 2025-2030 (%)
Data Table on Broadband amplifiers - Year-over-year growth 2025-2030 (%)

9.6 Spectrum analyzer - Market size and forecast 2025-2030

Chart on Spectrum analyzer - Market size and forecast 2025-2030 ($ million)
Data Table on Spectrum analyzer - Market size and forecast 2025-2030 ($ million)
Chart on Spectrum analyzer - Year-over-year growth 2025-2030 (%)
Data Table on Spectrum analyzer - Year-over-year growth 2025-2030 (%)

9.7 Others - Market size and forecast 2025-2030

Chart on Others - Market size and forecast 2025-2030 ($ million)
Data Table on Others - Market size and forecast 2025-2030 ($ million)
Chart on Others - Year-over-year growth 2025-2030 (%)
Data Table on Others - Year-over-year growth 2025-2030 (%)

9.8 Market opportunity by Product

Market opportunity by Product ($ million)
Data Table on Market opportunity by Product ($ million)

10. Market Segmentation by Application

10.1 Market segments

Chart on Application - Market share 2025-2030 (%)
Data Table on Application - Market share 2025-2030 (%)

10.2 Comparison by Application

Chart on Comparison by Application
Data Table on Comparison by Application

10.3 Third-party laboratories - Market size and forecast 2025-2030

Chart on Third-party laboratories - Market size and forecast 2025-2030 ($ million)
Data Table on Third-party laboratories - Market size and forecast 2025-2030 ($ million)
Chart on Third-party laboratories - Year-over-year growth 2025-2030 (%)
Data Table on Third-party laboratories - Year-over-year growth 2025-2030 (%)

10.4 In-house laboratories - Market size and forecast 2025-2030

Chart on In-house laboratories - Market size and forecast 2025-2030 ($ million)
Data Table on In-house laboratories - Market size and forecast 2025-2030 ($ million)
Chart on In-house laboratories - Year-over-year growth 2025-2030 (%)
Data Table on In-house laboratories - Year-over-year growth 2025-2030 (%)

10.5 Governments - Market size and forecast 2025-2030

Chart on Governments - Market size and forecast 2025-2030 ($ million)
Data Table on Governments - Market size and forecast 2025-2030 ($ million)
Chart on Governments - Year-over-year growth 2025-2030 (%)
Data Table on Governments - Year-over-year growth 2025-2030 (%)

10.6 Market opportunity by Application

Market opportunity by Application ($ million)
Data Table on Market opportunity by Application ($ million)

11. Customer Landscape

11.1 Customer landscape overview

Analysis of price sensitivity, lifecycle, customer purchase basket, adoption rates, and purchase criteria

12. Geographic Landscape

12.1 Geographic segmentation

Chart on Market share by geography 2025-2030 (%)
Data Table on Market share by geography 2025-2030 (%)

12.2 Geographic comparison

Chart on Geographic comparison
Data Table on Geographic comparison

12.3 APAC - Market size and forecast 2025-2030

Chart on APAC - Market size and forecast 2025-2030 ($ million)
Data Table on APAC - Market size and forecast 2025-2030 ($ million)
Chart on APAC - Year-over-year growth 2025-2030 (%)
Data Table on APAC - Year-over-year growth 2025-2030 (%)
Chart on Regional Comparison - APAC
Data Table on Regional Comparison - APAC

12.3.1 China - Market size and forecast 2025-2030

Chart on China - Market size and forecast 2025-2030 ($ million)
Data Table on China - Market size and forecast 2025-2030 ($ million)
Chart on China - Year-over-year growth 2025-2030 (%)
Data Table on China - Year-over-year growth 2025-2030 (%)

12.3.2 Japan - Market size and forecast 2025-2030

Chart on Japan - Market size and forecast 2025-2030 ($ million)
Data Table on Japan - Market size and forecast 2025-2030 ($ million)
Chart on Japan - Year-over-year growth 2025-2030 (%)
Data Table on Japan - Year-over-year growth 2025-2030 (%)

12.3.3 South Korea - Market size and forecast 2025-2030

Chart on South Korea - Market size and forecast 2025-2030 ($ million)
Data Table on South Korea - Market size and forecast 2025-2030 ($ million)
Chart on South Korea - Year-over-year growth 2025-2030 (%)
Data Table on South Korea - Year-over-year growth 2025-2030 (%)

12.3.4 India - Market size and forecast 2025-2030

Chart on India - Market size and forecast 2025-2030 ($ million)
Data Table on India - Market size and forecast 2025-2030 ($ million)
Chart on India - Year-over-year growth 2025-2030 (%)
Data Table on India - Year-over-year growth 2025-2030 (%)

12.3.5 Australia - Market size and forecast 2025-2030

Chart on Australia - Market size and forecast 2025-2030 ($ million)
Data Table on Australia - Market size and forecast 2025-2030 ($ million)
Chart on Australia - Year-over-year growth 2025-2030 (%)
Data Table on Australia - Year-over-year growth 2025-2030 (%)

12.3.6 Indonesia - Market size and forecast 2025-2030

Chart on Indonesia - Market size and forecast 2025-2030 ($ million)
Data Table on Indonesia - Market size and forecast 2025-2030 ($ million)
Chart on Indonesia - Year-over-year growth 2025-2030 (%)
Data Table on Indonesia - Year-over-year growth 2025-2030 (%)

12.4 North America - Market size and forecast 2025-2030

Chart on North America - Market size and forecast 2025-2030 ($ million)
Data Table on North America - Market size and forecast 2025-2030 ($ million)
Chart on North America - Year-over-year growth 2025-2030 (%)
Data Table on North America - Year-over-year growth 2025-2030 (%)
Chart on Regional Comparison - North America
Data Table on Regional Comparison - North America

12.4.1 US - Market size and forecast 2025-2030

Chart on US - Market size and forecast 2025-2030 ($ million)
Data Table on US - Market size and forecast 2025-2030 ($ million)
Chart on US - Year-over-year growth 2025-2030 (%)
Data Table on US - Year-over-year growth 2025-2030 (%)

12.4.2 Canada - Market size and forecast 2025-2030

Chart on Canada - Market size and forecast 2025-2030 ($ million)
Data Table on Canada - Market size and forecast 2025-2030 ($ million)
Chart on Canada - Year-over-year growth 2025-2030 (%)
Data Table on Canada - Year-over-year growth 2025-2030 (%)

12.4.3 Mexico - Market size and forecast 2025-2030

Chart on Mexico - Market size and forecast 2025-2030 ($ million)
Data Table on Mexico - Market size and forecast 2025-2030 ($ million)
Chart on Mexico - Year-over-year growth 2025-2030 (%)
Data Table on Mexico - Year-over-year growth 2025-2030 (%)

12.5 Europe - Market size and forecast 2025-2030

Chart on Europe - Market size and forecast 2025-2030 ($ million)
Data Table on Europe - Market size and forecast 2025-2030 ($ million)
Chart on Europe - Year-over-year growth 2025-2030 (%)
Data Table on Europe - Year-over-year growth 2025-2030 (%)
Chart on Regional Comparison - Europe
Data Table on Regional Comparison - Europe

12.5.1 Germany - Market size and forecast 2025-2030

Chart on Germany - Market size and forecast 2025-2030 ($ million)
Data Table on Germany - Market size and forecast 2025-2030 ($ million)
Chart on Germany - Year-over-year growth 2025-2030 (%)
Data Table on Germany - Year-over-year growth 2025-2030 (%)

12.5.2 UK - Market size and forecast 2025-2030

Chart on UK - Market size and forecast 2025-2030 ($ million)
Data Table on UK - Market size and forecast 2025-2030 ($ million)
Chart on UK - Year-over-year growth 2025-2030 (%)
Data Table on UK - Year-over-year growth 2025-2030 (%)

12.5.3 France - Market size and forecast 2025-2030

Chart on France - Market size and forecast 2025-2030 ($ million)
Data Table on France - Market size and forecast 2025-2030 ($ million)
Chart on France - Year-over-year growth 2025-2030 (%)
Data Table on France - Year-over-year growth 2025-2030 (%)

12.5.4 Italy - Market size and forecast 2025-2030

Chart on Italy - Market size and forecast 2025-2030 ($ million)
Data Table on Italy - Market size and forecast 2025-2030 ($ million)
Chart on Italy - Year-over-year growth 2025-2030 (%)
Data Table on Italy - Year-over-year growth 2025-2030 (%)

12.5.5 The Netherlands - Market size and forecast 2025-2030

Chart on The Netherlands - Market size and forecast 2025-2030 ($ million)
Data Table on The Netherlands - Market size and forecast 2025-2030 ($ million)
Chart on The Netherlands - Year-over-year growth 2025-2030 (%)
Data Table on The Netherlands - Year-over-year growth 2025-2030 (%)

12.5.6 Spain - Market size and forecast 2025-2030

Chart on Spain - Market size and forecast 2025-2030 ($ million)
Data Table on Spain - Market size and forecast 2025-2030 ($ million)
Chart on Spain - Year-over-year growth 2025-2030 (%)
Data Table on Spain - Year-over-year growth 2025-2030 (%)

12.6 South America - Market size and forecast 2025-2030

Chart on South America - Market size and forecast 2025-2030 ($ million)
Data Table on South America - Market size and forecast 2025-2030 ($ million)
Chart on South America - Year-over-year growth 2025-2030 (%)
Data Table on South America - Year-over-year growth 2025-2030 (%)
Chart on Regional Comparison - South America
Data Table on Regional Comparison - South America

12.6.1 Brazil - Market size and forecast 2025-2030

Chart on Brazil - Market size and forecast 2025-2030 ($ million)
Data Table on Brazil - Market size and forecast 2025-2030 ($ million)
Chart on Brazil - Year-over-year growth 2025-2030 (%)
Data Table on Brazil - Year-over-year growth 2025-2030 (%)

12.6.2 Argentina - Market size and forecast 2025-2030

Chart on Argentina - Market size and forecast 2025-2030 ($ million)
Data Table on Argentina - Market size and forecast 2025-2030 ($ million)
Chart on Argentina - Year-over-year growth 2025-2030 (%)
Data Table on Argentina - Year-over-year growth 2025-2030 (%)

12.6.3 Chile - Market size and forecast 2025-2030

Chart on Chile - Market size and forecast 2025-2030 ($ million)
Data Table on Chile - Market size and forecast 2025-2030 ($ million)
Chart on Chile - Year-over-year growth 2025-2030 (%)
Data Table on Chile - Year-over-year growth 2025-2030 (%)

12.7 Middle East and Africa - Market size and forecast 2025-2030

Chart on Middle East and Africa - Market size and forecast 2025-2030 ($ million)
Data Table on Middle East and Africa - Market size and forecast 2025-2030 ($ million)
Chart on Middle East and Africa - Year-over-year growth 2025-2030 (%)
Data Table on Middle East and Africa - Year-over-year growth 2025-2030 (%)
Chart on Regional Comparison - Middle East and Africa
Data Table on Regional Comparison - Middle East and Africa

12.7.1 Saudi Arabia - Market size and forecast 2025-2030

Chart on Saudi Arabia - Market size and forecast 2025-2030 ($ million)
Data Table on Saudi Arabia - Market size and forecast 2025-2030 ($ million)
Chart on Saudi Arabia - Year-over-year growth 2025-2030 (%)
Data Table on Saudi Arabia - Year-over-year growth 2025-2030 (%)

12.7.2 UAE - Market size and forecast 2025-2030

Chart on UAE - Market size and forecast 2025-2030 ($ million)
Data Table on UAE - Market size and forecast 2025-2030 ($ million)
Chart on UAE - Year-over-year growth 2025-2030 (%)
Data Table on UAE - Year-over-year growth 2025-2030 (%)

12.7.3 South Africa - Market size and forecast 2025-2030

Chart on South Africa - Market size and forecast 2025-2030 ($ million)
Data Table on South Africa - Market size and forecast 2025-2030 ($ million)
Chart on South Africa - Year-over-year growth 2025-2030 (%)
Data Table on South Africa - Year-over-year growth 2025-2030 (%)

12.7.4 Israel - Market size and forecast 2025-2030

Chart on Israel - Market size and forecast 2025-2030 ($ million)
Data Table on Israel - Market size and forecast 2025-2030 ($ million)
Chart on Israel - Year-over-year growth 2025-2030 (%)
Data Table on Israel - Year-over-year growth 2025-2030 (%)

12.7.5 Turkey - Market size and forecast 2025-2030

Chart on Turkey - Market size and forecast 2025-2030 ($ million)
Data Table on Turkey - Market size and forecast 2025-2030 ($ million)
Chart on Turkey - Year-over-year growth 2025-2030 (%)
Data Table on Turkey - Year-over-year growth 2025-2030 (%)

12.8 Market opportunity by geography

Market opportunity by geography ($ million)
Data Tables on Market opportunity by geography ($ million)

13. Drivers, Challenges, and Opportunity

13.1 Market drivers

Institutionalization of high-frequency 5G and next generation telecomm
Proliferation of electric vehicle propulsion and high-voltage architectures
Acceleration of AI enhanced testing and predictive analytics

13.2 Market challenges

Technological complexity of high-frequency testing environments
Supply chain volatility and specialized component scarcity
Evolving global regulatory and compliance fragmentation

13.3 Impact of drivers and challenges

Impact of drivers and challenges in 2025 and 2030

13.4 Market opportunities

Industrialization of AI-driven automated compliance frameworks
Integration of high-voltage testing for electrification
Advancements in modular pre-compliance digital twin integration

14. Competitive Landscape

14.1 Overview

14.2

Overview on criticality of inputs and factors of differentiation

14.3 Landscape disruption

Overview on factors of disruption

14.4 Industry risks

Impact of key risks on business

15. Competitive Analysis

15.1 Companies profiled

Companies covered

15.2 Company ranking index

15.3 Market positioning of companies

Matrix on companies position and classification

15.4 AMETEK Inc.

AMETEK Inc. - Overview
AMETEK Inc. - Business segments
AMETEK Inc. - Key offerings
AMETEK Inc. - Segment focus
SWOT

15.5 Anritsu Corp.

Anritsu Corp. - Overview
Anritsu Corp. - Business segments
Anritsu Corp. - Key offerings
Anritsu Corp. - Segment focus
SWOT

15.6 Bureau Veritas

Bureau Veritas - Overview
Bureau Veritas - Business segments
Bureau Veritas - Key offerings
Bureau Veritas - Segment focus
SWOT

15.7 DEKRA SE

DEKRA SE - Overview
DEKRA SE - Product / Service
DEKRA SE - Key offerings
SWOT

15.8 ESCO Technologies Inc.

ESCO Technologies Inc. - Overview
ESCO Technologies Inc. - Business segments
ESCO Technologies Inc. - Key offerings
ESCO Technologies Inc. - Segment focus
SWOT

15.9 Eurofins Scientific SE

Eurofins Scientific SE - Overview
Eurofins Scientific SE - Business segments
Eurofins Scientific SE - Key offerings
Eurofins Scientific SE - Segment focus
SWOT

15.10 Fortive Corp.

Fortive Corp. - Overview
Fortive Corp. - Business segments
Fortive Corp. - Key offerings
Fortive Corp. - Segment focus
SWOT

15.11 GAUSS INSTRUMENTS Intl. GmbH

GAUSS INSTRUMENTS Intl. GmbH - Overview
GAUSS INSTRUMENTS Intl. GmbH - Product / Service
GAUSS INSTRUMENTS Intl. GmbH - Key offerings
SWOT

15.12 Good Will Instrument Co. Ltd.

Good Will Instrument Co. Ltd. - Overview
Good Will Instrument Co. Ltd. - Product / Service
Good Will Instrument Co. Ltd. - Key offerings
SWOT

15.13 Intertek Group Plc

Intertek Group Plc - Overview
Intertek Group Plc - Business segments
Intertek Group Plc - Key offerings
Intertek Group Plc - Segment focus
SWOT

15.14 Keysight Technologies Inc.

Keysight Technologies Inc. - Overview
Keysight Technologies Inc. - Business segments
Keysight Technologies Inc. - Key offerings
Keysight Technologies Inc. - Segment focus
SWOT

15.15 Laird Connectivity

Laird Connectivity - Overview
Laird Connectivity - Product / Service
Laird Connectivity - Key offerings
SWOT

15.16 Parker Hannifin Corp.

Parker Hannifin Corp. - Overview
Parker Hannifin Corp. - Business segments
Parker Hannifin Corp. - Key offerings
Parker Hannifin Corp. - Segment focus
SWOT

15.17 SGS SA

SGS SA - Overview
SGS SA - Business segments
SGS SA - Key offerings
SGS SA - Segment focus
SWOT

15.18 TUV SUD AG

TUV SUD AG - Overview
TUV SUD AG - Product / Service
TUV SUD AG - Key offerings
SWOT

16. Appendix

16.1 Scope of the report

Market definition
Objectives
Notes and caveats

16.2 Inclusions and exclusions checklist

Inclusions checklist
Exclusions checklist

16.3 Currency conversion rates for US$

16.4 Research methodology

16.5 Data procurement

Information sources

16.6 Data validation

16.7 Validation techniques employed for market sizing

16.8 Data synthesis

16.9 360 degree market analysis

16.10 List of abbreviations

Research Methodology

Technavio presents a detailed picture of the market by way of study, synthesis, and summation of data from multiple sources. The analysts have presented the various facets of the market with a particular focus on identifying the key industry influencers. The data thus presented is comprehensive, reliable, and the result of extensive research, both primary and secondary.

INFORMATION SOURCES

Primary sources

  • Manufacturers and suppliers
  • Channel partners
  • Industry experts
  • Strategic decision makers

Secondary sources

  • Industry journals and periodicals
  • Government data
  • Financial reports of key industry players
  • Historical data
  • Press releases

DATA ANALYSIS

Data Synthesis

  • Collation of data
  • Estimation of key figures
  • Analysis of derived insights

Data Validation

  • Triangulation with data models
  • Reference against proprietary databases
  • Corroboration with industry experts

REPORT WRITING

Qualitative

  • Market drivers
  • Market challenges
  • Market trends
  • Five forces analysis

Quantitative

  • Market size and forecast
  • Market segmentation
  • Geographical insights
  • Competitive landscape

Interested in this report?

Get your sample now to see our research methodology and insights!

Download Now

Frequently Asked Questions

Electromagnetic Compatibility (EMC) Test Equipment market growth will increase by USD 2449.8 million during 2026-2030.

The Electromagnetic Compatibility (EMC) Test Equipment market is expected to grow at a CAGR of 5.6% during 2026-2030.

Electromagnetic Compatibility (EMC) Test Equipment market is segmented by End-user (Consumer electronics, Telecommunications, Aerospace and defense, Automotive, Others) Product (EMI test receiver, Signal generator, Broadband amplifiers, Spectrum analyzer, Others) Application (Third-party laboratories, In-house laboratories, Governments)

AMETEK Inc., Amplifier Research, Anritsu Corp., Bureau Veritas, Com Power Corp., DEKRA SE, ESCO Technologies Inc., Eurofins Scientific SE, Fortive Corp., Frankonia Solutions GmbH, GAUSS INSTRUMENTS Intl. GmbH, Good Will Instrument Co. Ltd., Intertek Group Plc, Keysight Technologies Inc., Laird Connectivity, Parker Hannifin Corp., Rohde and Schwarz GmbH, SGS SA, TUV SUD AG are a few of the key vendors in the Electromagnetic Compatibility (EMC) Test Equipment market.

APAC will register the highest growth rate of 43.4% among the other regions. Therefore, the Electromagnetic Compatibility (EMC) Test Equipment market in APAC is expected to garner significant business opportunities for the vendors during the forecast period.

China, Japan, South Korea, India, Australia, Indonesia, US, Canada, Mexico, Germany, UK, France, Italy, The Netherlands, Spain, Brazil, Argentina, Chile, Saudi Arabia, UAE, South Africa, Israel, Turkey

  • Institutionalization of high-frequency 5G and next generation telecomm is the driving factor this market.

The Electromagnetic Compatibility (EMC) Test Equipment market vendors should focus on grabbing business opportunities from the End-user segment as it accounted for the largest market share in the base year.
RIA - Research AI Assistant
Ask RIA