
SUV Market Size 2025-2029
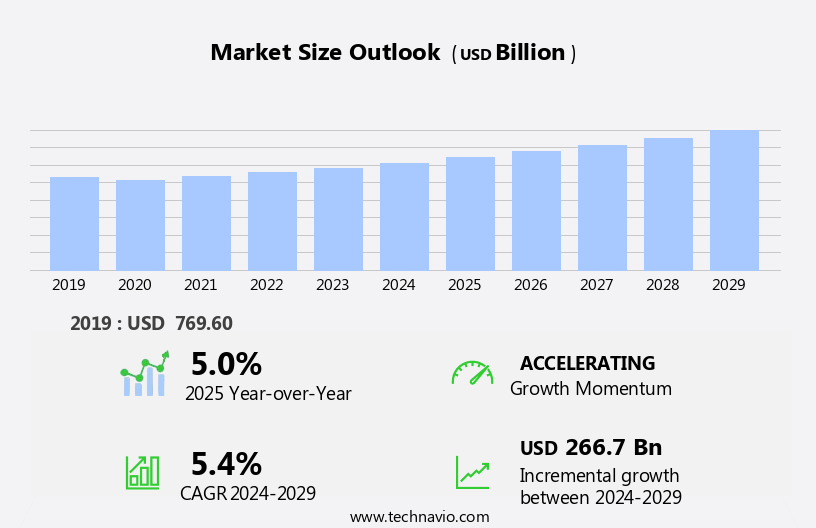
The SUV market size is forecast to increase by USD 266.7 billion at a CAGR of 5.4% between 2024 and 2029.
- The market is experiencing significant growth due to several key factors. One of the primary drivers is the increased preference for safety and comfort, which has led to a rise in sales. Another trend shaping the market is the rapid development of electric and hybrid SUVs offering a sustainable solution with zero emissions during operation, contributing to the decrease in greenhouse gases. Additionally, there is an increasing inclination toward cost-effective and compact SUV models, catering to budget-conscious buyers and those with limited parking space. Engine size is another factor influencing the market, with consumers opting for smaller engines to improve fuel efficiency and reduce greenhouse emissions. These trends are expected to continue shaping the market in the coming years.
What will be the Size of the SUV Market During the Forecast Period?
- The market continues to evolve, with advanced comfort and automatic safety features becoming increasingly important to consumers. Premium SUVs offer spacious interiors and refined driving experiences, while compact SUVs provide versatility and maneuverability. Full-size SUVs cater to those requiring heavy towing capacity and off-roading capabilities. Automakers respond to market demands by introducing multiple drivetrain options, including semi-autonomous and autonomous vehicles. European Commission emission norms and GhG emissions regulations are driving the electrification of SUVs, with automotive OEMs investing in electric SUVs. Ultra-luxurious cars are incorporating the latest connected technologies to offer a seamless and personalized experience to customers.
- Advanced safety features like lane departure warnings, blind-spot detection, and adaptive cruise control are becoming standard. Off-roading capabilities are being improved through advanced suspension systems and terrain management technologies. The market is evolving with the rise of electric & hybrid vehicles, semi-autonomous vehicles, luxury cars, and ultra-luxurious cars, each offering unique features and catering to different consumer preferences. The market is also witnessing significant advancements in autonomous driving technologies. While fully autonomous vehicles are still in development, semi-autonomous features are becoming increasingly common. The future of the market lies in the integration of advanced technologies, electrification, and a focus on safety and comfort.
How is this SUV Industry segmented and which is the largest segment?
The SUV industry research report provides comprehensive data (region-wise segment analysis), with forecasts and estimates in "USD billion" for the period 2025-2029, as well as historical data from 2019-2023 for the following segments.
- Vehicle Type
- Medium-sized SUVs
- Crossover and compact SUVs
- Large-sized SUVs
- Fuel Type
- Gasoline
- Hybrid and electric SUV
- Diesel
- Geography
- APAC
- China
- India
- Japan
- Europe
- Germany
- UK
- France
- North America
- Canada
- US
- Middle East and Africa
- South America
- Brazil
- APAC
By Vehicle Type Insights
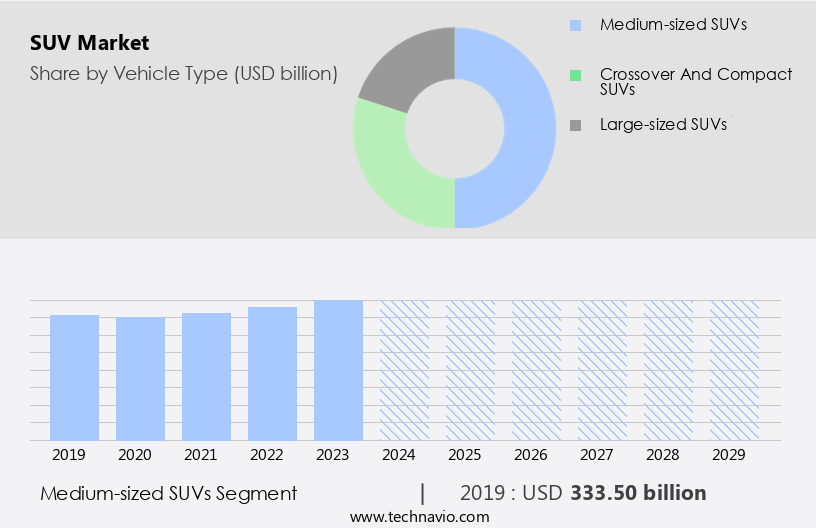
- The medium-sized SUVs segment is estimated to witness significant growth during the forecast period.
Mid-size SUVs represent a significant segment in The market in 2024, offering advanced features and performance without the bulk of full-size SUVs. These vehicles provide premium features such as leather interiors, advanced infotainment systems, high-quality audio systems, and advanced safety features. Mid-size luxury SUVs also deliver impressive performance with powerful engines and responsive handling. Europe and the Asia-Pacific (APAC) region are the major markets for mid-size SUVs due to cost-conscious consumers seeking fuel efficiency.
Get a glance at the SUV Industry report of share of various segments Request Free Sample
The medium-sized SUVs segment was valued at USD 333.50 billion in 2019 and showed a gradual increase during the forecast period.
Regional Analysis
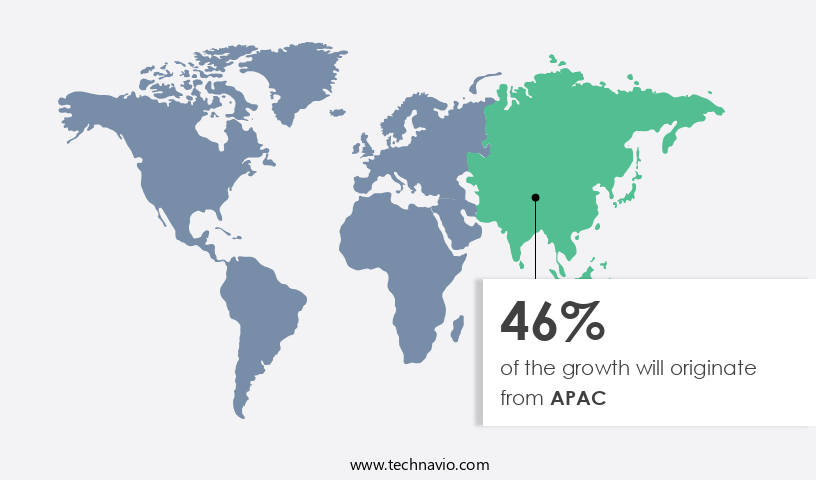
- APAC is estimated to contribute 46% to the growth of the global market during the forecast period.
Technavio's analysts have elaborately explained the regional trends and drivers that shape the market during the forecast period.
For more insights on the market share of various regions, Request Free Sample
The market in the Asia Pacific (APAC) region exhibits significant growth potential, particularly in countries such as China, Japan, India, and South Korea. Factors driving this trend include the utility value of SUVs and their fuel efficiency, which are crucial considerations for cost-sensitive consumers in these markets. The European Commission's stringent emission norms and increasing focus on reducing GHG emissions have led automakers to invest in advanced connected technologies to enhance the fuel efficiency of their SUV models. Notable companies have gained traction in the Chinese market due to their superior features and performance. Overall, the APAC market is poised for strong growth, with increasing demand for fuel-efficient and technologically advanced vehicles.
Market Dynamics
Our SUV market researchers analyzed the data with 2024 as the base year, along with the key drivers, trends, and challenges. A holistic analysis of drivers will help companies refine their marketing strategies to gain a competitive advantage.
What are the key market drivers leading to the rise in adoption of SUV Industry?
Increased preference for safety and comfort driving sales of SUVs is the key driver of the market.
- In the dynamic automotive market of 2024, SUVs continue to evolve, offering advanced comfort and safety features to distinguish themselves from sedans and compact models. Automakers invest heavily in technology to enhance the image of their SUVs as premium offerings, elevating the social status of buyers. These vehicles come equipped with sophisticated driver-assist systems, including intelligent all-wheel-drive and automatic safety features, such as electronic stability control and lane-keeping systems. Versatility remains a key selling point, with multiple drivetrain options catering to various terrain types and heavy towing capacity. The industry also witnesses a shift towards electrification, with electric and hybrid SUVs gaining popularity.
- Semi-autonomous and autonomous vehicles are on the horizon, further enhancing the appeal of SUVs. The European Commission's stringent emission norms, including GHG emissions and CO2 emissions, are driving the demand for fuel-efficient mid-size SUVs with smaller engine sizes. Automotive OEMs are at the forefront of these trends, ensuring their SUV models remain competitive in the market. Connected technologies and electrification are shaping the future of the market, offering consumers a seamless and sustainable driving experience.
What are the market trends shaping the SUV Industry?
Rapid development of electric and hybrid SUVs is the upcoming trend in the market.
- The market in the US is witnessing a notable transition towards advanced comfort and eco-friendly solutions in 2024. Premium SUVs, compact and full-size, are increasingly incorporating automatic safety features, electrification, and connected technologies to cater to consumer preferences. Automotive OEMs are introducing multiple drivetrain options, including electric and hybrid vehicles, to meet the demand for versatility and heavy towing capacity. Electrification is a significant trend, with electric SUVs gaining popularity due to their zero-emission driving capabilities. These vehicles help reduce greenhouse gas emissions, aligning with the European Commission's stricter emission norms. This shift is influenced by heightened environmental consciousness among consumers and regulatory initiatives, as well as advancements in electric vehicle infrastructure. Hybrid SUVs, which combine traditional internal combustion engines with electric propulsion, offer improved fuel economy and a reduced carbon footprint.
- Major automakers are actively responding to this shift, introducing electric and hybrid SUV models to cater to the growing demand for environmentally friendly alternatives. The market dynamics are influenced by consumer awareness of environmental issues, government incentives, and advancements in EV infrastructure. While the market for sedans may be declining, the SUV segment continues to thrive, with mid-size SUVs being a popular choice due to their engine size and off-roading capabilities. The future of the market lies in the integration of semi-autonomous and autonomous vehicles, offering enhanced convenience and safety features.
What challenges does SUV Industry face during its growth?
Increasing inclination toward cost-effective and compact models is a key challenge affecting the industry growth.
- The market is witnessing significant growth due to the increasing demand for advanced comfort and automatic safety features. Premium SUVs, compact SUVs, and full-size SUVs continue to be popular choices among consumers, offering versatility and multiple drivetrain options. However, the market may face challenges from the rising preference for sedans and hatchbacks, which are more fuel-efficient and cost-effective. Regulatory pressures, including emission norms set by the European Commission and the need to reduce GHG emissions, may further influence consumer decisions. As a result, electric and hybrid SUVs, as well as semi-autonomous and autonomous vehicles, are gaining traction.
- Automotive OEMs are responding to these trends by investing in electrification and connected technologies. Pickups and mid-size SUVs with larger engine sizes may continue to dominate the market for heavy towing capacity. However, the focus on fuel economy and CO2 emissions will remain a critical factor in consumer purchasing decisions. As the market evolves, it will be essential for OEMs to adapt to changing consumer preferences and regulatory requirements to maintain market share.
Exclusive Customer Landscape
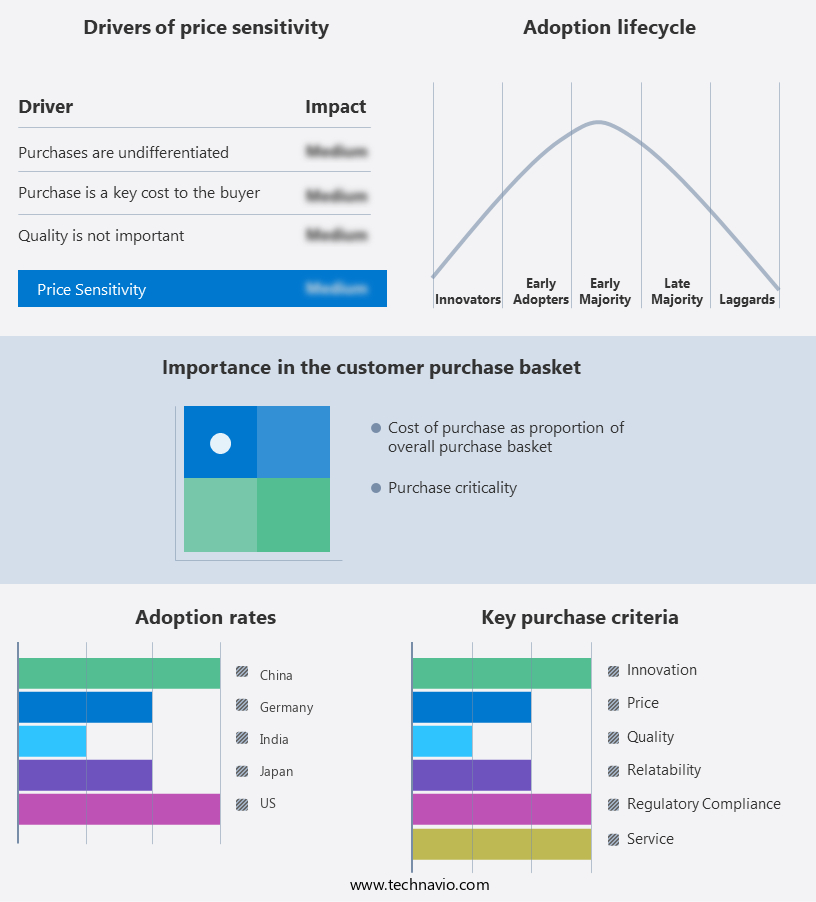
The SUV market forecasting report includes the market's adoption lifecycle, covering the innovator's stage to the laggard's stage. It focuses on adoption rates in different regions based on penetration. Furthermore, the market report also includes key purchase criteria and drivers of price sensitivity to help companies evaluate and develop their market growth analysis strategies.
Customer Landscape
Key Companies & Market Insights
Companies are implementing various strategies, such as strategic alliances, market forecast, partnerships, mergers and acquisitions, geographical expansion, and product/service launches, to enhance their presence in the industry.
AB Volvo: The company offers SUVs such as the XC 90 recharge, XC 90, and XC 60.
The SUV industry research and growth report includes detailed analyses of the competitive landscape of the market and information about key companies, including:
- Bayerische Motoren Werke AG
- BYD Co. Ltd.
- China FAW Group Co. Ltd.
- Ford Motor Co.
- General Motors Co.
- Honda Motor Co. Ltd.
- Hyundai Motor Co.
- Mahindra and Mahindra Ltd.
- Mazda Motor Corp.
- Mercedes Benz Group AG
- Mitsubishi Motors Corp.
- Nissan Motor Co. Ltd.
- Renault SAS
- SAIC Motor Corp. Ltd.
- Stellantis NV
- Tata Motors Ltd.
- Tesla Inc.
- Toyota Motor Corp.
- Volkswagen AG
Qualitative and quantitative analysis of companies has been conducted to help clients understand the wider business environment as well as the strengths and weaknesses of key industry players. Data is qualitatively analyzed to categorize companies as pure play, category-focused, industry-focused, and diversified; it is quantitatively analyzed to categorize companies as dominant, leading, strong, tentative, and weak.
Research Analyst Overview
The Sport Utility Vehicle (SUV) market continues to evolve, offering consumers a diverse range of options that cater to various needs and preferences. From compact to full-size, electric and hybrid to semi-automatic and autonomous, SUVs today represent the pinnacle of automotive innovation and versatility. Advanced comfort is a key selling point for many consumers in the market. Premium SUVs are designed to provide a luxurious driving experience, with features such as heated and cooled seats, panoramic sunroofs, and advanced climate control systems. These vehicles aim to create a serene and comfortable environment for passengers, making long journeys more enjoyable.
In addition, another crucial aspect of the market is safety. Automatic safety features, such as lane departure warning, blind spot monitoring, and adaptive cruise control, are becoming increasingly common. These features help to mitigate potential accidents and provide peace of mind for drivers and passengers alike. Versatility is another essential factor driving the growth of the market. SUVs offer multiple drivetrain options, including all-wheel drive and four-wheel drive, making them suitable for various driving conditions. Additionally, many SUVs boast impressive towing capacities, allowing them to handle heavy loads with ease. The market also caters to those with off-roading aspirations.
Furthermore, full-size SUVs, in particular, are popular among those who enjoy the great outdoors. These vehicles offer superior ground clearance, strong suspension systems, and advanced traction control systems, enabling them to tackle challenging terrain with ease. Electrification is another significant trend in the market. Electric and hybrid SUVs are gaining popularity due to their environmental benefits and impressive performance due to the advancements in battery systems. These vehicles offer reduced greenhouse gas (GHG) emissions and improved fuel economy, making them an attractive option for eco-conscious consumers. Connected technologies are also becoming increasingly important in the market. From infotainment systems to advanced driver assistance systems, these technologies help to enhance the driving experience and provide greater convenience and safety.
|
SUV Market Scope |
|
|
Report Coverage |
Details |
|
Page number |
199 |
|
Base year |
2024 |
|
Historic period |
2019-2023 |
|
Forecast period |
2025-2029 |
|
Growth momentum & CAGR |
Accelerate at a CAGR of 5.4% |
|
Market Growth 2025-2029 |
USD 266.7 billion |
|
Market structure |
Fragmented |
|
YoY growth 2024-2025(%) |
5.0 |
|
Key countries |
China, India, Japan, US, UK, Germany, Canada, France, Australia, and Brazil |
|
Competitive landscape |
Leading Companies, Market Positioning of Companies, Competitive Strategies, and Industry Risks |
What are the Key Data Covered in this Market Research and Growth Report?
- CAGR of the SUV industry during the forecast period
- Detailed information on factors that will drive the market growth and forecasting between 2025 and 2029
- Precise estimation of the size of the market and its contribution of the industry in focus to the parent market
- Accurate predictions about upcoming market growth and trends and changes in consumer behaviour
- Growth of the market across APAC, Europe, North America, Middle East and Africa, and South America
- Thorough analysis of the market's competitive landscape and detailed information about companies
- Comprehensive analysis of factors that will challenge the growth of industry companies
We can help! Our analysts can customize this market research report to meet your requirements. Get in touch
 RIA -
RIA - 
