Energy Management In Railways Market Analysis Europe, North America, APAC, South America, Middle East and Africa - US, France, China, Germany, Japan - Size and Forecast 2024-2028

Energy Management In Railways Market Analysis Europe, North America, APAC, South America, Middle East and Africa - US, France, China, Germany, Japan - Size and Forecast 2024-2028

Published: Jul 2024 192 Pages SKU: IRTNTR76332

Market Overview at a Glance

$1.96 B
Market Opportunity
10.55%
CAGR
9.28
YoY growth 2023-2024(%)

Energy Management In Railways Market Size 2024-2028

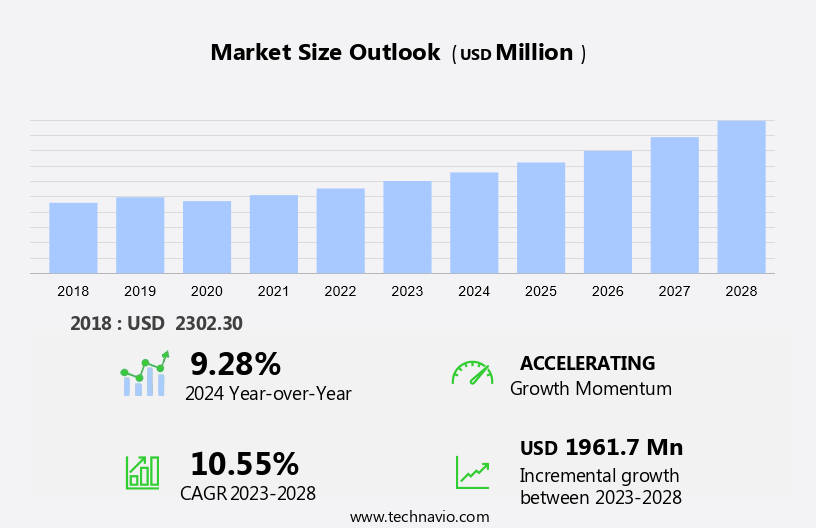
The energy management in railways market size is forecast to increase by USD 1.96 billion at a CAGR of 10.55% between 2023 and 2028.

  • The energy management market in railways is experiencing significant growth due to the increasing demand for energy efficiency and sustainability In the transportation sector. Advanced technologies, such as energy storage systems and smart grid solutions, are being adopted to optimize energy consumption and reduce carbon emissions. However, the high cost of implementing and maintaining energy management systems remains a challenge for many railway operators. To address this, governments and private organizations are investing in research and development to create cost-effective and efficient energy management solutions. Additionally, stringent regulations and growing public awareness of environmental issues are driving the adoption of energy management systems In the railways industry. Overall, the market is expected to grow steadily over the next few years, as railway operators seek to reduce their carbon footprint and improve operational efficiency.

What will be the Size of the Energy Management In Railways Market During the Forecast Period?

Energy Management In Railways Market Size

 Request Free Sample

  • The market encompasses normal and electrified railways, including monorails, and is a significant contributor to the global transportation sector. The energy management market within this industry is gaining momentum due to the increasing focus on energy efficiency and the adoption of renewable energy sources. Freight and passenger rail operations consume substantial energy, making energy management a critical operational function. Railway networks employ software solutions for traffic management, ticketing, maintenance scheduling, and asset tracking to optimize energy usage.
  • Smart grids are being integrated into the railway sector to facilitate two-way power flow, enabling regenerative braking and eco-driving techniques. The railway industry recognizes the importance of reducing its carbon footprint and is implementing various energy management strategies to minimize energy consumption. Overall, the railways market is experiencing growth, driven by the adoption of advanced technologies and the shift towards sustainable energy sources.

How is this Energy Management In Railways Industry segmented and which is the largest segment?

The energy management in railways industry research report provides comprehensive data (region-wise segment analysis), with forecasts and estimates in "USD billion" for the period 2024-2028, as well as historical data from 2018-2022 for the following segments.
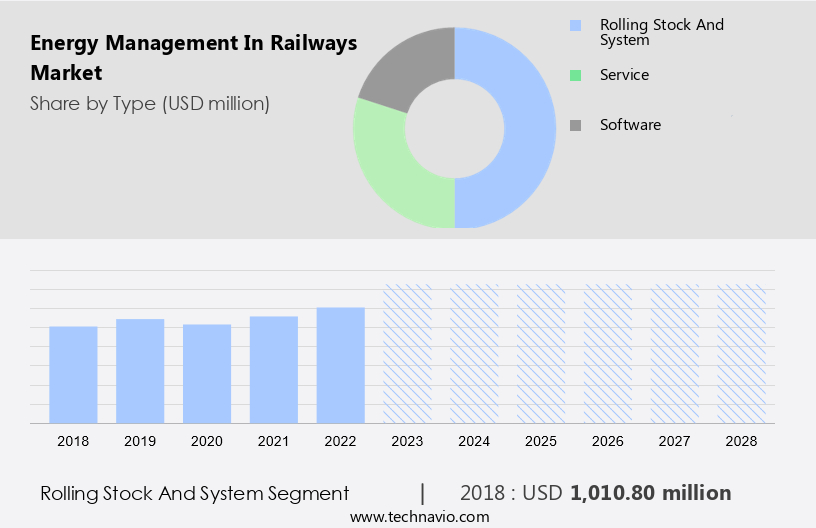
  • Type
    • Rolling stock and system
    • Service
    • Software
  • End-user
    • Freight rail
    • Passenger rail
  • Geography
    • Europe
      • Germany
      • France
    • North America
      • US
    • APAC
      • China
      • Japan
    • South America
    • Middle East and Africa

By Type Insights

  • The rolling stock and system segment is estimated to witness significant growth during the forecast period.

The railways sector is increasingly focusing on energy management to reduce carbon footprint and enhance operational efficiency. In the global railways market, the rolling stock and systems segment play a pivotal role in energy management. Advanced technologies, such as regenerative braking and eco-driving techniques, are being adopted to convert kinetic energy into electrical energy, which can be reused for various purposes. Smart grids and renewable energy integration are other strategies being implemented to optimize energy consumption. Freight and passenger rail operators are leveraging software solutions for traffic management, ticketing, maintenance scheduling, asset tracking, and real-time monitoring. Indian Railways, among others, is investing in artificial intelligence (AI) and cloud computing to improve energy management and passenger experience. Energy management strategies also include smart station management and renewable energy sources. Overall, the railway industry's focus on energy management is essential for environmental sustainability and operational excellence.

Energy Management In Railways Market Size

Get a glance at the market report of share of various segments Request Free Sample

The rolling stock and system segment was valued at USD 1.01 billion in 2018 and showed a gradual increase during the forecast period.

Regional Analysis

  • Europe is estimated to contribute 37% to the growth of the global market during the forecast period.

Technavio's analysts have elaborately explained the regional trends and drivers that shape the market during the forecast period.

Energy Management In Railways Market Share by Geography

For more insights on the market size of various regions, Request Free Sample

Europe is a key player In the global railway energy management market, characterized by the implementation of energy-efficient technologies and practices to minimize carbon emissions and enhance sustainability. The extensive European railway network, spanning approximately 230,000 km, necessitates efficient energy management strategies to optimize energy consumption and reduce carbon footprint. Key drivers for the growth of the energy management market in European railways include the integration of renewable energy sources, smart grids, and advanced software solutions for traffic management, ticketing, maintenance scheduling, asset tracking, and real-time monitoring. Innovative energy management strategies, such as regenerative braking, eco-driving techniques, smart station management, and renewable energy integration, are increasingly being adopted to improve operational functions and enhance passenger experience. Artificial Intelligence (AI) and Cloud Computing are also being leveraged to streamline railway operations and promote environmental sustainability.

Market Dynamics

Our researchers analyzed the data with 2023 as the base year, along with the key drivers, trends, and challenges. A holistic analysis of drivers will help companies refine their marketing strategies to gain a competitive advantage.

What are the key market drivers leading to the rise In the adoption of Energy Management In Railways Industry?

Increasing demand for energy efficiency and sustainability is the key driver of the market.

  • The railway sector is embracing energy management strategies to enhance operational efficiency and reduce carbon footprint. Electrified railways and monorails are increasingly adopting energy management solutions to optimize energy consumption. Regenerative braking systems, a key component of these strategies, convert the energy generated during braking into electrical power. This power can be utilized to power onboard systems or fed back into the grid, thereby decreasing reliance on external energy sources. The integration of renewable energy sources, such as solar and wind, into railway networks is another significant trend. Smart grids and real-time monitoring systems enable the efficient distribution and management of energy.
  • Furthermore, software solutions for freight and passenger rail traffic management, ticketing, maintenance scheduling, asset tracking, and smart station management are streamlining railway industry operations. Innovative solutions like eco-driving techniques and AI-assisted energy management systems are also gaining traction. The Indian Railways is leading the way in implementing these strategies, aiming for environmental sustainability and enhancing passenger experience.

What are the market trends shaping the Energy Management In Railways Industry?

Advancements in technology in railway sector is the upcoming market trend.

  • The railway industry has witnessed significant advancements in energy management, driven by the adoption of smart technologies such as energy-efficient solutions, renewable energy integration, and real-time monitoring. Normal railways and electrified railways, including Monorail systems, have embraced the strategies to reduce their carbon footprint and optimize energy consumption. Smart grids and software solutions have become integral to the railway sector, enabling traffic management, ticketing, maintenance scheduling, asset tracking, and Innovative strategies, such as regenerative braking and eco-driving techniques, are being implemented to enhance energy efficiency. Smart station management and renewable energy integration are key areas of focus for railway operators.
  • Real-time monitoring of energy usage and consumption patterns is facilitated by IoT devices and artificial intelligence (AI) systems. Cloud computing technology is also being leveraged to streamline operational functions and improve environmental sustainability. Passenger experience is another critical aspect of the railway industry, and it plays a vital role in enhancing it. By implementing energy-efficient practices, railways can offer a more comfortable and eco-friendly travel experience. Overall, the railway industry's commitment is a significant step towards creating a more sustainable and efficient transportation system.

What challenges does the Energy Management In Railways Industry face during its growth?

High cost of implementing and maintaining systems is a key challenge affecting the industry growth.

  • The railway sector is embracing strategies to enhance environmental sustainability and operational efficiency. Electrified railways and monorails are leading the charge in this regard, integrating renewable energy sources and implementing advanced technologies such as smart grids and artificial intelligence (AI). Systems are essential for optimizing energy consumption in freight and passenger rail operations, with functions ranging from traffic management and ticketing to maintenance scheduling and asset tracking. One challenge to the adoption of systems in railways is their high implementation and maintenance costs. Smart meters, which provide real-time energy consumption data, are a crucial component of these systems but can be financially burdensome to install across an entire railway network, costing between USD 1,000 and USD 10.000 per unit.
  • However, the benefits of energy efficiency, carbon footprint reduction, and improved passenger experience make the investment worthwhile. Innovative solutions, such as regenerative braking, eco-driving techniques, and smart station management, are also being explored to further optimize energy usage In the railway industry. Cloud computing and real-time monitoring are facilitating the integration of renewable energy sources and enhancing overall system performance.

Exclusive Customer Landscape

The market forecasting report includes the adoption lifecycle of the market, market growth and forecasting, covering from the innovator's stage to the laggard's stage. It focuses on adoption rates in different regions based on penetration. Furthermore, the  market report also includes key purchase criteria and drivers of price sensitivity to help companies evaluate and develop their market growth analysis strategies.
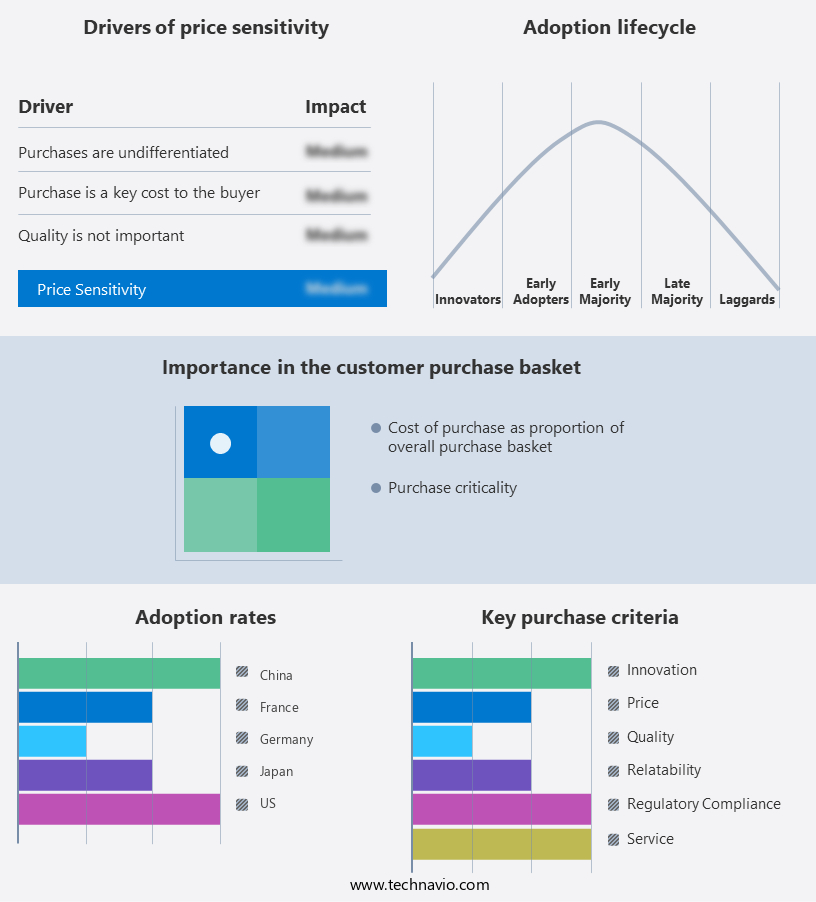
Energy Management In Railways Market Share by Geography

 Customer Landscape

Key Companies & Market Insights

Companies are implementing various strategies, such as strategic alliances, energy management in railways market forecast, partnerships, mergers and acquisitions, geographical expansion, and product/service launches, to enhance their presence In the industry.

The industry research and growth report includes detailed analyses of the competitive landscape of the market and information about key companies, including:

  • ABB Ltd.
  • ALSTOM SA
  • Caterpillar Inc.
  • CONSTRUCCIONES Y AUXILIAR DE FERROCARRILES S.A.
  • CRRC Corp. Ltd.
  • General Electric Co.
  • Hitachi Ltd.
  • Honeywell International Inc.
  • Ingeteam Corp. S.A.
  • International Business Machines Corp.
  • Knorr Bremse AG
  • Mitsubishi Heavy Industries Ltd.
  • REMC Ltd.
  • Schneider Electric SE
  • Siemens AG
  • Thales Group
  • The MathWorks Inc.
  • Toshiba Corp.
  • WAGO GmbH and Co. KG
  • WESTINGHOUSE AIR BRAKE TECHNOLOGIES CORP.

Qualitative and quantitative analysis of companies has been conducted to help clients understand the wider business environment as well as the strengths and weaknesses of key industry players. Data is qualitatively analyzed to categorize companies as pure play, category-focused, industry-focused, and diversified; it is quantitatively analyzed to categorize companies as dominant, leading, strong, tentative, and weak.

Research Analyst Overview

The railway sector has been a significant contributor to the global transportation industry, providing an efficient and sustainable mode of transport for both freight and passenger movements. With the increasing focus on management and environmental sustainability, the railway industry has been exploring various strategies to reduce energy consumption and carbon footprint. It encompasses various operational functions, including traffic management, ticketing, maintenance scheduling, asset tracking, and strategies. The integration of renewable energy sources, such as solar, wind, and hydroelectric power, has become a key focus area for the railway industry. Electrified railways have been a popular choice for energy-efficient transportation, offering significant reductions in energy consumption compared to traditional diesel-powered trains. Monorails, with their streamlined design and automated operational functions, also offer energy savings through optimized energy usage and regenerative braking systems. Smart grids have emerged as a promising solution for managing energy consumption In the railway sector. These systems enable real-time monitoring and control of energy usage, allowing for the optimization of energy supply and demand. The use of artificial intelligence (AI) and cloud computing technologies further enhances the capabilities of smart grids, enabling predictive maintenance and energy forecasting.

Freight and passenger rail operations consume large amounts of energy, making it a critical aspect of railway network efficiency. Strategies such as eco-driving techniques, smart station management, and renewable energy integration have been implemented to reduce energy consumption and improve operational efficiency. Regenerative braking systems, which recapture energy during braking and store it for later use, have become increasingly common In the railway industry. These systems help to reduce energy consumption and improve overall energy efficiency. The railway industry's focus is not only driven by operational efficiency and cost savings but also by the need for environmental sustainability.

Thus, the integration of renewable energy sources and the adoption of innovative solutions, such as smart grids and AI-powered systems, are key areas of investment for the railway sector. Hence, the railway industry's focus is a critical aspect of its ongoing evolution. The integration of renewable energy sources, smart grids, and innovative solutions is driving operational efficiency, reducing energy consumption, and improving environmental sustainability. The railway sector's commitment is a testament to its role as a leader in sustainable transportation.

Market Scope

Report Coverage

Details

Page number

192

Base year

2023

Historic period

2018-2022

Forecast period

2024-2028

Growth momentum & CAGR

Accelerate at a CAGR of 10.55%

Market growth 2024-2028

USD 1.96 billion

Market structure

Fragmented

YoY growth 2023-2024(%)

9.28

Key countries

US, France, China, Germany, and Japan

Competitive landscape

Leading Companies, Market Positioning of Companies, Competitive Strategies, and Industry Risks

Request Free Sample

What are the Key Data Covered in this Energy Management In Railways Market Research and Growth Report?

  • CAGR of the Energy Management In Railways industry during the forecast period
  • Detailed information on factors that will drive the growth and forecasting between 2024 and 2028
  • Precise estimation of the size of the market and its contribution of the industry in focus to the parent market
  • Accurate predictions about upcoming growth and trends and changes in consumer behaviour
  • Growth of the market across Europe, North America, APAC, South America, and Middle East and Africa
  • Thorough analysis of the market's competitive landscape and detailed information about companies
  • Comprehensive analysis of factors that will challenge the energy management in railways market growth of industry companies

We can help! Our analysts can customize this energy management in railways market research report to meet your requirements.

Get in touch

1 Executive Summary

  • 1.1 Market overview
    • Executive Summary - Chart on Market Overview
    • Executive Summary - Data Table on Market Overview
    • Executive Summary - Chart on Global Market Characteristics
    • Executive Summary - Chart on Market by Geography
    • Executive Summary - Chart on Market Segmentation by Type
    • Executive Summary - Chart on Market Segmentation by End-user
    • Executive Summary - Chart on Incremental Growth
    • Executive Summary - Data Table on Incremental Growth
    • Executive Summary - Chart on Company Market Positioning

2 Market Landscape

  • 2.1 Market ecosystem
    • Parent Market
    • Data Table on - Parent Market
  • 2.2 Market characteristics
    • Market characteristics analysis
  • 2.3 Value chain analysis
    • Value Chain Analysis

3 Market Sizing

  • 3.1 Market definition
    • Offerings of companies included in the market definition
  • 3.2 Market segment analysis
    • Market segments
  • 3.3 Market size 2023
    • 3.4 Market outlook: Forecast for 2023-2028
      • Chart on Global - Market size and forecast 2023-2028 ($ million)
      • Data Table on Global - Market size and forecast 2023-2028 ($ million)
      • Chart on Global Market: Year-over-year growth 2023-2028 (%)
      • Data Table on Global Market: Year-over-year growth 2023-2028 (%)

    4 Historic Market Size

    • 4.1 Global Energy Management Market In Railways Market 2018 - 2022
      • Historic Market Size - Data Table on Global Energy Management Market In Railways Market 2018 - 2022 ($ million)
    • 4.2 Type segment analysis 2018 - 2022
      • Historic Market Size - Type Segment 2018 - 2022 ($ million)
    • 4.3 End-user segment analysis 2018 - 2022
      • Historic Market Size - End-user Segment 2018 - 2022 ($ million)
    • 4.4 Geography segment analysis 2018 - 2022
      • Historic Market Size - Geography Segment 2018 - 2022 ($ million)
    • 4.5 Country segment analysis 2018 - 2022
      • Historic Market Size - Country Segment 2018 - 2022 ($ million)

    5 Five Forces Analysis

    • 5.1 Five forces summary
      • Five forces analysis - Comparison between 2023 and 2028
    • 5.2 Bargaining power of buyers
      • Bargaining power of buyers - Impact of key factors 2023 and 2028
    • 5.3 Bargaining power of suppliers
      • Bargaining power of suppliers - Impact of key factors in 2023 and 2028
    • 5.4 Threat of new entrants
      • Threat of new entrants - Impact of key factors in 2023 and 2028
    • 5.5 Threat of substitutes
      • Threat of substitutes - Impact of key factors in 2023 and 2028
    • 5.6 Threat of rivalry
      • Threat of rivalry - Impact of key factors in 2023 and 2028
    • 5.7 Market condition
      • Chart on Market condition - Five forces 2023 and 2028

    6 Market Segmentation by Type

    • 6.1 Market segments
      • Chart on Type - Market share 2023-2028 (%)
      • Data Table on Type - Market share 2023-2028 (%)
    • 6.2 Comparison by Type
      • Chart on Comparison by Type
      • Data Table on Comparison by Type
    • 6.3 Rolling stock and system - Market size and forecast 2023-2028
      • Chart on Rolling stock and system - Market size and forecast 2023-2028 ($ million)
      • Data Table on Rolling stock and system - Market size and forecast 2023-2028 ($ million)
      • Chart on Rolling stock and system - Year-over-year growth 2023-2028 (%)
      • Data Table on Rolling stock and system - Year-over-year growth 2023-2028 (%)
    • 6.4 Service - Market size and forecast 2023-2028
      • Chart on Service - Market size and forecast 2023-2028 ($ million)
      • Data Table on Service - Market size and forecast 2023-2028 ($ million)
      • Chart on Service - Year-over-year growth 2023-2028 (%)
      • Data Table on Service - Year-over-year growth 2023-2028 (%)
    • 6.5 Software - Market size and forecast 2023-2028
      • Chart on Software - Market size and forecast 2023-2028 ($ million)
      • Data Table on Software - Market size and forecast 2023-2028 ($ million)
      • Chart on Software - Year-over-year growth 2023-2028 (%)
      • Data Table on Software - Year-over-year growth 2023-2028 (%)
    • 6.6 Market opportunity by Type
      • Market opportunity by Type ($ million)
      • Data Table on Market opportunity by Type ($ million)

    7 Market Segmentation by End-user

    • 7.1 Market segments
      • Chart on End-user - Market share 2023-2028 (%)
      • Data Table on End-user - Market share 2023-2028 (%)
    • 7.2 Comparison by End-user
      • Chart on Comparison by End-user
      • Data Table on Comparison by End-user
    • 7.3 Freight rail - Market size and forecast 2023-2028
      • Chart on Freight rail - Market size and forecast 2023-2028 ($ million)
      • Data Table on Freight rail - Market size and forecast 2023-2028 ($ million)
      • Chart on Freight rail - Year-over-year growth 2023-2028 (%)
      • Data Table on Freight rail - Year-over-year growth 2023-2028 (%)
    • 7.4 Passenger rail - Market size and forecast 2023-2028
      • Chart on Passenger rail - Market size and forecast 2023-2028 ($ million)
      • Data Table on Passenger rail - Market size and forecast 2023-2028 ($ million)
      • Chart on Passenger rail - Year-over-year growth 2023-2028 (%)
      • Data Table on Passenger rail - Year-over-year growth 2023-2028 (%)
    • 7.5 Market opportunity by End-user
      • Market opportunity by End-user ($ million)
      • Data Table on Market opportunity by End-user ($ million)

    8 Customer Landscape

    • 8.1 Customer landscape overview
      • Analysis of price sensitivity, lifecycle, customer purchase basket, adoption rates, and purchase criteria

    9 Geographic Landscape

    • 9.1 Geographic segmentation
      • Chart on Market share by geography 2023-2028 (%)
      • Data Table on Market share by geography 2023-2028 (%)
    • 9.2 Geographic comparison
      • Chart on Geographic comparison
      • Data Table on Geographic comparison
    • 9.3 Europe - Market size and forecast 2023-2028
      • Chart on Europe - Market size and forecast 2023-2028 ($ million)
      • Data Table on Europe - Market size and forecast 2023-2028 ($ million)
      • Chart on Europe - Year-over-year growth 2023-2028 (%)
      • Data Table on Europe - Year-over-year growth 2023-2028 (%)
    • 9.4 North America - Market size and forecast 2023-2028
      • Chart on North America - Market size and forecast 2023-2028 ($ million)
      • Data Table on North America - Market size and forecast 2023-2028 ($ million)
      • Chart on North America - Year-over-year growth 2023-2028 (%)
      • Data Table on North America - Year-over-year growth 2023-2028 (%)
    • 9.5 APAC - Market size and forecast 2023-2028
      • Chart on APAC - Market size and forecast 2023-2028 ($ million)
      • Data Table on APAC - Market size and forecast 2023-2028 ($ million)
      • Chart on APAC - Year-over-year growth 2023-2028 (%)
      • Data Table on APAC - Year-over-year growth 2023-2028 (%)
    • 9.6 South America - Market size and forecast 2023-2028
      • Chart on South America - Market size and forecast 2023-2028 ($ million)
      • Data Table on South America - Market size and forecast 2023-2028 ($ million)
      • Chart on South America - Year-over-year growth 2023-2028 (%)
      • Data Table on South America - Year-over-year growth 2023-2028 (%)
    • 9.7 Middle East and Africa - Market size and forecast 2023-2028
      • Chart on Middle East and Africa - Market size and forecast 2023-2028 ($ million)
      • Data Table on Middle East and Africa - Market size and forecast 2023-2028 ($ million)
      • Chart on Middle East and Africa - Year-over-year growth 2023-2028 (%)
      • Data Table on Middle East and Africa - Year-over-year growth 2023-2028 (%)
    • 9.8 US - Market size and forecast 2023-2028
      • Chart on US - Market size and forecast 2023-2028 ($ million)
      • Data Table on US - Market size and forecast 2023-2028 ($ million)
      • Chart on US - Year-over-year growth 2023-2028 (%)
      • Data Table on US - Year-over-year growth 2023-2028 (%)
    • 9.9 France - Market size and forecast 2023-2028
      • Chart on France - Market size and forecast 2023-2028 ($ million)
      • Data Table on France - Market size and forecast 2023-2028 ($ million)
      • Chart on France - Year-over-year growth 2023-2028 (%)
      • Data Table on France - Year-over-year growth 2023-2028 (%)
    • 9.10 China - Market size and forecast 2023-2028
      • Chart on China - Market size and forecast 2023-2028 ($ million)
      • Data Table on China - Market size and forecast 2023-2028 ($ million)
      • Chart on China - Year-over-year growth 2023-2028 (%)
      • Data Table on China - Year-over-year growth 2023-2028 (%)
    • 9.11 Germany - Market size and forecast 2023-2028
      • Chart on Germany - Market size and forecast 2023-2028 ($ million)
      • Data Table on Germany - Market size and forecast 2023-2028 ($ million)
      • Chart on Germany - Year-over-year growth 2023-2028 (%)
      • Data Table on Germany - Year-over-year growth 2023-2028 (%)
    • 9.12 Japan - Market size and forecast 2023-2028
      • Chart on Japan - Market size and forecast 2023-2028 ($ million)
      • Data Table on Japan - Market size and forecast 2023-2028 ($ million)
      • Chart on Japan - Year-over-year growth 2023-2028 (%)
      • Data Table on Japan - Year-over-year growth 2023-2028 (%)
    • 9.13 Market opportunity by geography
      • Market opportunity by geography ($ million)
      • Data Tables on Market opportunity by geography ($ million)

    10 Drivers, Challenges, and Opportunity/Restraints

    • 10.1 Market drivers
      • 10.2 Market challenges
        • 10.3 Impact of drivers and challenges
          • Impact of drivers and challenges in 2023 and 2028
        • 10.4 Market opportunities/restraints

          11 Competitive Landscape

          • 11.1 Overview
            • 11.2 Competitive Landscape
              • Overview on criticality of inputs and factors of differentiation
            • 11.3 Landscape disruption
              • Overview on factors of disruption
            • 11.4 Industry risks
              • Impact of key risks on business

            12 Competitive Analysis

            • 12.1 Companies profiled
              • Companies covered
            • 12.2 Market positioning of companies
              • Matrix on companies position and classification
            • 12.3 ABB Ltd.
              • ABB Ltd. - Overview
              • ABB Ltd. - Business segments
              • ABB Ltd. - Key news
              • ABB Ltd. - Key offerings
              • ABB Ltd. - Segment focus
            • 12.4 ALSTOM SA
              • ALSTOM SA - Overview
              • ALSTOM SA - Business segments
              • ALSTOM SA - Key news
              • ALSTOM SA - Key offerings
              • ALSTOM SA - Segment focus
            • 12.5 Caterpillar Inc.
              • Caterpillar Inc. - Overview
              • Caterpillar Inc. - Business segments
              • Caterpillar Inc. - Key news
              • Caterpillar Inc. - Key offerings
              • Caterpillar Inc. - Segment focus
            • 12.6 CONSTRUCCIONES Y AUXILIAR DE FERROCARRILES S.A.
              • CONSTRUCCIONES Y AUXILIAR DE FERROCARRILES S.A. - Overview
              • CONSTRUCCIONES Y AUXILIAR DE FERROCARRILES S.A. - Product / Service
              • CONSTRUCCIONES Y AUXILIAR DE FERROCARRILES S.A. - Key offerings
            • 12.7 General Electric Co.
              • General Electric Co. - Overview
              • General Electric Co. - Business segments
              • General Electric Co. - Key news
              • General Electric Co. - Key offerings
              • General Electric Co. - Segment focus
            • 12.8 Hitachi Ltd.
              • Hitachi Ltd. - Overview
              • Hitachi Ltd. - Business segments
              • Hitachi Ltd. - Key news
              • Hitachi Ltd. - Key offerings
              • Hitachi Ltd. - Segment focus
            • 12.9 Ingeteam Corp. S.A.
              • Ingeteam Corp. S.A. - Overview
              • Ingeteam Corp. S.A. - Product / Service
              • Ingeteam Corp. S.A. - Key offerings
            • 12.10 International Business Machines Corp.
              • International Business Machines Corp. - Overview
              • International Business Machines Corp. - Business segments
              • International Business Machines Corp. - Key news
              • International Business Machines Corp. - Key offerings
              • International Business Machines Corp. - Segment focus
            • 12.11 Knorr Bremse AG
              • Knorr Bremse AG - Overview
              • Knorr Bremse AG - Business segments
              • Knorr Bremse AG - Key offerings
              • Knorr Bremse AG - Segment focus
            • 12.12 Mitsubishi Heavy Industries Ltd.
              • Mitsubishi Heavy Industries Ltd. - Overview
              • Mitsubishi Heavy Industries Ltd. - Business segments
              • Mitsubishi Heavy Industries Ltd. - Key news
              • Mitsubishi Heavy Industries Ltd. - Key offerings
              • Mitsubishi Heavy Industries Ltd. - Segment focus
            • 12.13 Schneider Electric SE
              • Schneider Electric SE - Overview
              • Schneider Electric SE - Business segments
              • Schneider Electric SE - Key news
              • Schneider Electric SE - Key offerings
              • Schneider Electric SE - Segment focus
            • 12.14 Siemens AG
              • Siemens AG - Overview
              • Siemens AG - Business segments
              • Siemens AG - Key news
              • Siemens AG - Key offerings
              • Siemens AG - Segment focus
            • 12.15 Thales Group
              • Thales Group - Overview
              • Thales Group - Business segments
              • Thales Group - Key news
              • Thales Group - Key offerings
              • Thales Group - Segment focus
            • 12.16 Toshiba Corp.
              • Toshiba Corp. - Overview
              • Toshiba Corp. - Business segments
              • Toshiba Corp. - Key news
              • Toshiba Corp. - Key offerings
              • Toshiba Corp. - Segment focus
            • 12.17 WESTINGHOUSE AIR BRAKE TECHNOLOGIES CORP.
              • WESTINGHOUSE AIR BRAKE TECHNOLOGIES CORP. - Overview
              • WESTINGHOUSE AIR BRAKE TECHNOLOGIES CORP. - Business segments
              • WESTINGHOUSE AIR BRAKE TECHNOLOGIES CORP. - Key offerings
              • WESTINGHOUSE AIR BRAKE TECHNOLOGIES CORP. - Segment focus

            13 Appendix

            • 13.1 Scope of the report
              • 13.2 Inclusions and exclusions checklist
                • Inclusions checklist
                • Exclusions checklist
              • 13.3 Currency conversion rates for US$
                • Currency conversion rates for US$
              • 13.4 Research methodology
                • Research methodology
              • 13.5 Data procurement
                • Information sources
              • 13.6 Data validation
                • Data validation
              • 13.7 Validation techniques employed for market sizing
                • Validation techniques employed for market sizing
              • 13.8 Data synthesis
                • Data synthesis
              • 360 degree market analysis
                • 360 degree market analysis
              • 13.10 List of abbreviations
                • List of abbreviations

              Research Methodology

              Technavio presents a detailed picture of the market by way of study, synthesis, and summation of data from multiple sources. The analysts have presented the various facets of the market with a particular focus on identifying the key industry influencers. The data thus presented is comprehensive, reliable, and the result of extensive research, both primary and secondary.

              INFORMATION SOURCES

              Primary sources

              • Manufacturers and suppliers
              • Channel partners
              • Industry experts
              • Strategic decision makers

              Secondary sources

              • Industry journals and periodicals
              • Government data
              • Financial reports of key industry players
              • Historical data
              • Press releases

              DATA ANALYSIS

              Data Synthesis

              • Collation of data
              • Estimation of key figures
              • Analysis of derived insights

              Data Validation

              • Triangulation with data models
              • Reference against proprietary databases
              • Corroboration with industry experts

              REPORT WRITING

              Qualitative

              • Market drivers
              • Market challenges
              • Market trends
              • Five forces analysis

              Quantitative

              • Market size and forecast
              • Market segmentation
              • Geographical insights
              • Competitive landscape

              Interested in this report?

              Get your sample now to see our research methodology and insights!

              Download Now

              Frequently Asked Questions

              Energy Management In Railways market growth will increase by $ 1961.7 mn during 2024-2028 .

              The Energy Management In Railways market is expected to grow at a CAGR of 10.55% during 2024-2028 .

              Energy Management In Railways market is segmented by Type( Rolling stock and system, Service, Software) End-user( Freight rail, Passenger rail)

              ABB Ltd., ALSTOM SA, Caterpillar Inc., CONSTRUCCIONES Y AUXILIAR DE FERROCARRILES S.A., CRRC Corp. Ltd., General Electric Co., Hitachi Ltd., Honeywell International Inc., Ingeteam Corp. S.A., International Business Machines Corp., Knorr Bremse AG, Mitsubishi Heavy Industries Ltd., REMC Ltd., Schneider Electric SE, Siemens AG, Thales Group, The MathWorks Inc., Toshiba Corp., WAGO GmbH and Co. KG, WESTINGHOUSE AIR BRAKE TECHNOLOGIES CORP. are a few of the key vendors in the Energy Management In Railways market.

              Europe will register the highest growth rate of 37% among the other regions. Therefore, the Energy Management In Railways market in Europe is expected to garner significant business opportunities for the vendors during the forecast period.

              US, France, China, Germany, Japan

              • Increasing demand for energy efficiency and sustainabilityThe energy management market in railways is experiencing an increasing demand for energy efficiency and sustainability. There are several factors driving the transformation of the railway industry toward more sustainable and eco-friendly practices. One of the key factors driving the growth of the global energy management market in railways is the implementation of regenerative braking systems in trains. Regenerative braking allows the train to convert the kinetic energy produced during braking into electrical energy. This energy can then be stored and used to power other systems on the train or fed back into the grid. By harnessing this wasted energy is the driving factor this market.
              • trains can significantly reduce their overall energy consumption and reliance on external power sources. This not only improves energy efficiency but also lowers operational costs. Another key factor driving the growth of the global energy management market in railways is the integration of smart energy management systems in railway infrastructure. These systems use advanced technologies is the driving factor this market.
              • such as sensors is the driving factor this market.
              • data analytics is the driving factor this market.
              • and ML algorithms is the driving factor this market.
              • to monitor and optimize energy consumption in real time. By collecting and analyzing data on factors such as train schedules is the driving factor this market.
              • passenger loads is the driving factor this market.
              • and weather conditions is the driving factor this market.
              • these systems can optimally adjust energy usage to minimize waste and maximize efficiency. This leads to significant cost savings and reduces environmental impact. Furthermore is the driving factor this market.
              • there is a growing focus on improving the energy efficiency of railway infrastructure itself. This includes initiatives such as upgrading lighting systems to use light-emitting diode (LED) technology is the driving factor this market.
              • implementing energy-efficient heating is the driving factor this market.
              • ventilation is the driving factor this market.
              • and air conditioning (HVAC) systems is the driving factor this market.
              • and optimizing the use of natural lighting and ventilation. These measures not only reduce energy consumption but also enhance passenger comfort and safety. Thus is the driving factor this market.
              • the abovementioned factors are expected to increase the demand for energy management in the railway sector is the driving factor this market.
              • which will fuel the growth of the global energy management market in railways during the forecast period. is the driving factor this market.

              The Energy Management In Railways market vendors should focus on grabbing business opportunities from the Rolling stock and system segment as it accounted for the largest market share in the base year.