Engineering Services Outsourcing Market Analysis, Size, and Forecast 2026-2030: North America (US, Canada, and Mexico), APAC (China, Japan, and India), Europe (Germany, UK, and France), South America (Brazil and Argentina), Middle East and Africa (Saudi Arabia, UAE, and South Africa), and Rest of World (ROW)

Engineering Services Outsourcing Market Analysis, Size, and Forecast 2026-2030:
North America (US, Canada, and Mexico), APAC (China, Japan, and India), Europe (Germany, UK, and France), South America (Brazil and Argentina), Middle East and Africa (Saudi Arabia, UAE, and South Africa), and Rest of World (ROW)

Published: Apr 2026 318 Pages SKU: IRTNTR40539

Market Overview at a Glance

$532.17 B
Market Opportunity
25.7%
CAGR 2025 - 2030
42.6%
North America Growth
$57.96 B
Automotive segment 2024

Engineering Services Outsourcing Market Size 2026-2030

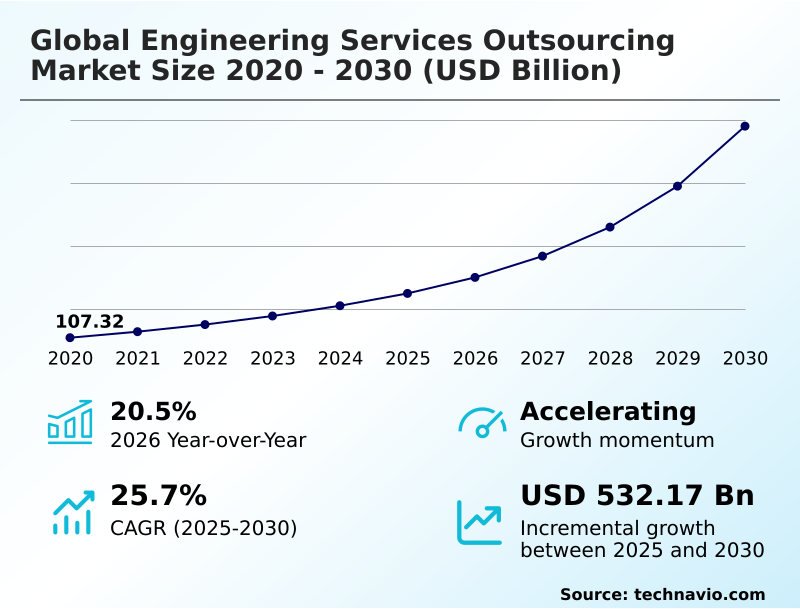
The engineering services outsourcing market size is valued to increase by USD 532.17 billion, at a CAGR of 25.7% from 2025 to 2030. Cost savings from lower labor wages will drive the engineering services outsourcing market.

Major Market Trends & Insights

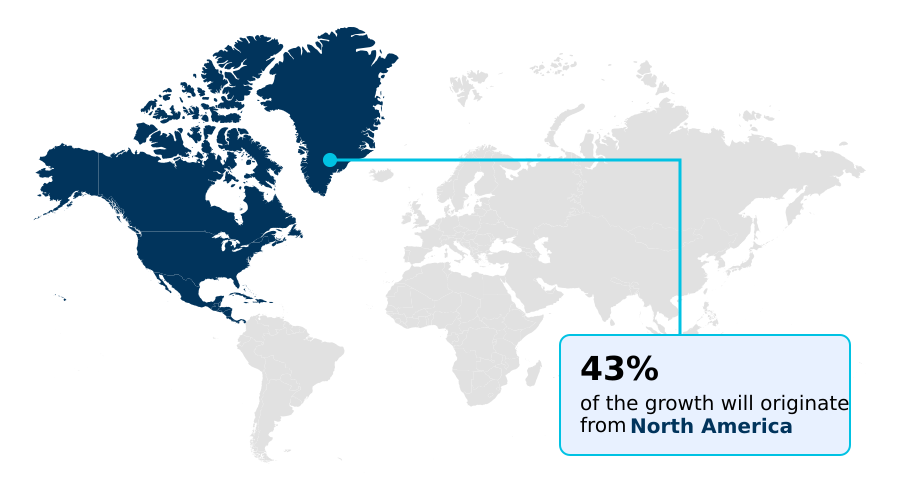
  • North America dominated the market and accounted for a 42.6% growth during the forecast period.
  • By End-user - Automotive segment was valued at USD 57.96 billion in 2024
  • By Sourcing - Offshore segment accounted for the largest market revenue share in 2024

Market Size & Forecast

  • Market Opportunities: USD 673.07 billion
  • Market Future Opportunities: USD 532.17 billion
  • CAGR from 2025 to 2030 : 25.7%

Market Summary

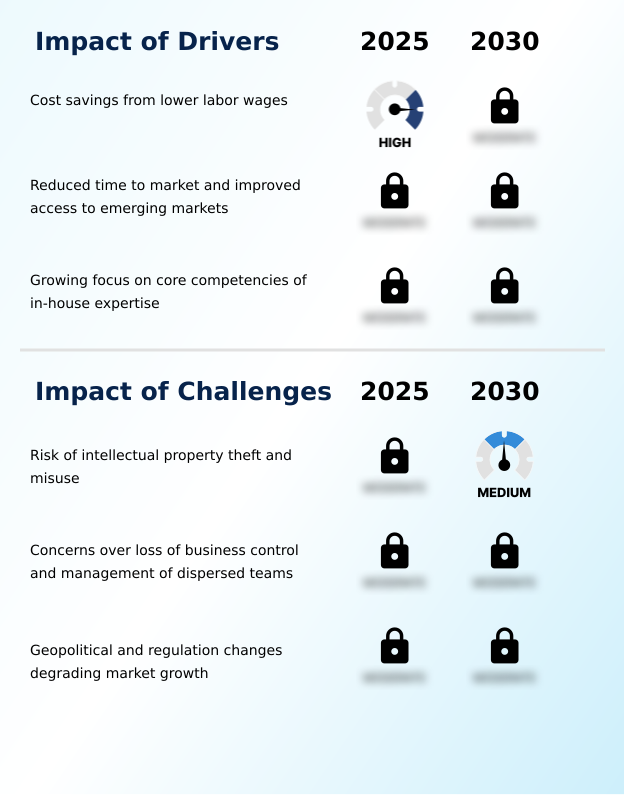
  • The engineering services outsourcing market is defined by a strategic shift toward externalizing complex technical functions to achieve operational agility and innovation. Key drivers include the need for cost reduction through labor arbitrage and the ability to accelerate time-to-market, which is critical in competitive sectors.
  • Organizations are increasingly focusing on core competencies, delegating tasks like product design, simulation, and testing to specialized providers. This model allows access to advanced digital engineering capabilities, such as digital twins and generative design, without substantial in-house investment. For instance, an aerospace manufacturer might outsource non-critical airframe analysis to focus internal resources on proprietary powertrain development, thereby optimizing R&D expenditure.
  • Trends show a move toward co-innovation partnerships, where outsourcing firms act as strategic collaborators. However, the market is not without its challenges; concerns over intellectual property security and the complexities of managing geographically dispersed teams require robust governance and secure technology platforms to mitigate risks.

What will be the Size of the Engineering Services Outsourcing Market during the forecast period?

Get Key Insights on Market Forecast (PDF) Get Free Sample

How is the Engineering Services Outsourcing Market Segmented?

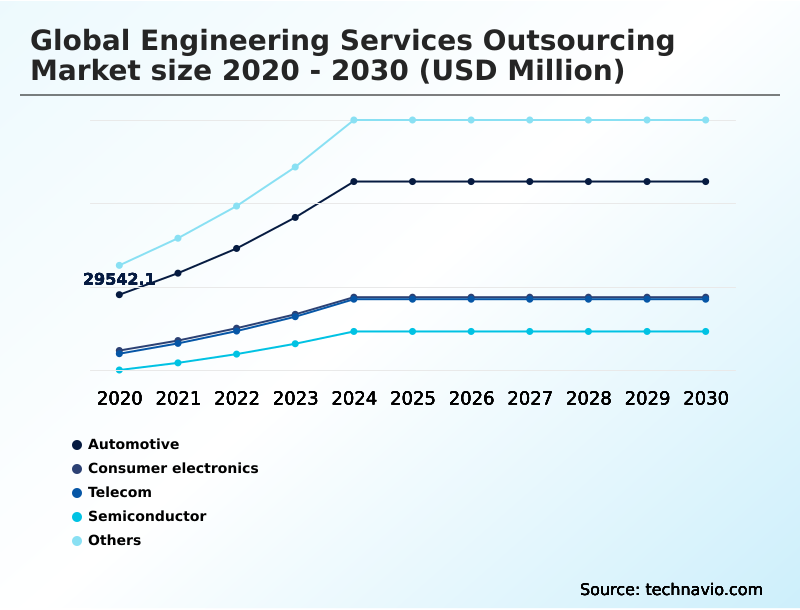
The engineering services outsourcing industry research report provides comprehensive data (region-wise segment analysis), with forecasts and estimates in "USD million" for the period 2026-2030, as well as historical data from 2020-2024 for the following segments.

  • End-user
    • Automotive
    • Consumer electronics
    • Telecom
    • Semiconductor
    • Others
  • Sourcing
    • Offshore
    • Onshore
  • Type
    • Designing
    • Prototyping
    • System integration
    • Testing
    • Others
  • Geography
    • North America
      • US
      • Canada
      • Mexico
    • APAC
      • China
      • Japan
      • India
    • Europe
      • Germany
      • UK
      • France
    • South America
      • Brazil
      • Argentina
    • Middle East and Africa
      • Saudi Arabia
      • UAE
      • South Africa
    • Rest of World (ROW)

By End-user Insights

The automotive segment is estimated to witness significant growth during the forecast period.

The automotive segment is driven by rapid innovation in vehicle design, electrification, and autonomous systems. Automakers increasingly depend on external partners for complex engineering, including data-driven design and structural analysis for lightweighting.

This strategic shift allows OEMs to focus on brand development and mobility planning while leveraging specialized expertise in hardware in the loop validation and mechatronics engineering.

Outsourcing supports the integration of advanced driver-assistance systems, which now account for over 30% of software engineering efforts in new platforms. The use of finite element analysis and advanced system architecture is critical, alongside industrial automation to streamline production.

This approach, incorporating lifecycle engineering and rigorous validation and verification services, is essential for managing development in the software-defined vehicle era.

Get Free Sample

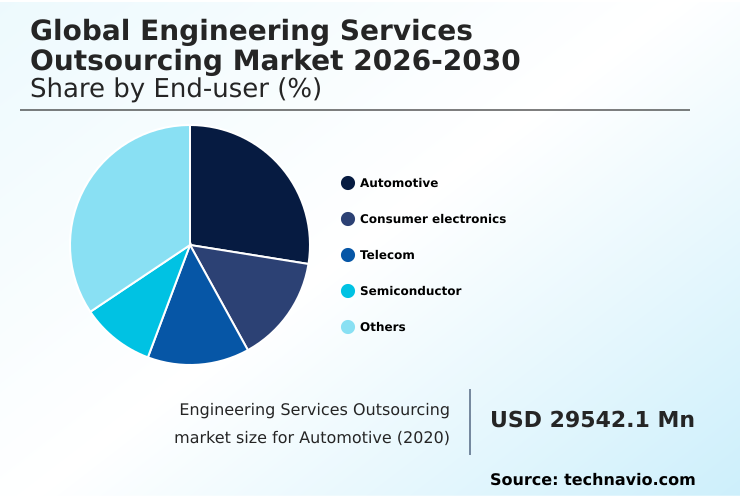
The Automotive segment was valued at USD 57.96 billion in 2024 and showed a gradual increase during the forecast period.

Get Free Sample

Regional Analysis

North America is estimated to contribute 42.6% to the growth of the global market during the forecast period.Technavio’s analysts have elaborately explained the regional trends and drivers that shape the market during the forecast period.

See How Engineering Services Outsourcing Market Demand is Rising in North America Get Free Sample

The geographic landscape is dominated by mature markets, with North America driving over 42% of the incremental growth opportunity, where firms leverage model-based engineering for complex projects.

Companies in this region utilize onshore outsourcing for high-value tasks requiring close collaboration and regulatory alignment, achieving up to a 20% reduction in design validation times.

The focus is on specialized skills in electronic design automation and circuit simulation, particularly within the semiconductor and aerospace sectors. APAC remains a critical hub for offshore outsourcing, offering vast talent pools for radio network planning and fiber optic deployment.

This region is a key destination for outsourced product development, cost reduction engineering, and supply chain engineering, enabling global firms to maintain competitive cost structures while accessing scalable technical resources for consumer electronics engineering.

Market Dynamics

Our researchers analyzed the data with 2025 as the base year, along with the key drivers, trends, and challenges. A holistic analysis of drivers will help companies refine their marketing strategies to gain a competitive advantage.

  • Strategic decision-making in the global engineering services outsourcing market 2026-2030 is increasingly nuanced, moving beyond simple cost-benefit analyses. Companies now evaluate the long-term benefits of offshore engineering services, particularly for complex projects like outsourced engineering for electric vehicles, where access to specialized talent is paramount. A key consideration is the total cost of onshore vs.
  • offshore outsourcing, factoring in communication overhead and project governance. The impact of geopolitics on outsourcing strategies is also a critical variable, influencing decisions on regional diversification. Internally, trends in digital engineering transformation are pushing firms to adopt technologies that streamline workflows. One of the primary challenges in engineering IP protection remains a boardroom-level concern, demanding robust security protocols.
  • As firms adopt AI applications in product design and utilize the role of digital twins in manufacturing, they unlock new efficiencies. The growth of system integration for IoT devices and specialized prototyping services for consumer electronics further highlights this evolution.
  • Firms that succeed are those managing dispersed engineering teams effectively and leveraging outsourcing for aerospace system validation, which can be twice as fast as purely in-house efforts. Adherence to compliance challenges in medical device design is non-negotiable, while the goal of improving time-to-market via outsourcing continues to drive partnerships.
  • This allows a greater core competency focus through outsourcing, with techniques like generative design for lightweighting parts and model-based systems engineering adoption becoming standard practice. The advantages are also clear in construction, where building information modeling outsourcing benefits are well-documented, leading to better data-driven design process optimization across projects.

What are the key market drivers leading to the rise in the adoption of Engineering Services Outsourcing Industry?

  • Cost savings derived from lower labor wages represent a key driver for the market's growth.

  • Key market drivers include significant cost savings and accelerated time-to-market, achieved by leveraging global talent pools for high-performance computing and engineering analytics.
  • Companies report cost reductions of up to 40% by engaging in labor arbitrage through offshore outsourcing of tasks like simulation and testing. This approach also allows organizations to focus on core competencies, redirecting in-house expertise toward high-value innovation.
  • Accessing specialized skills in powertrain engineering and vehicle development through external partners shortens product launch timelines by over 30%.
  • This dynamic is particularly evident in industrial equipment design and construction engineering services, where scalable teams and advanced tools for tasks such as prototyping and system integration are essential for maintaining a competitive edge.
  • Sustainable engineering design is another growing driver for partnerships.

What are the market trends shaping the Engineering Services Outsourcing Industry?

  • The rise of collaborative and co-innovation partnerships with outsourcing firms is an emerging market trend, signaling a shift toward deeper strategic collaborations.

  • Market trends are increasingly shaped by collaborative and co-innovation partnerships, where clients and service providers jointly develop solutions using digital twins and generative design. This shift from transactional relationships to strategic alliances enables faster innovation cycles and enhances problem-solving in complex projects, with some collaborations reducing prototyping timelines by up to 25%.
  • The growing adoption of AI is amplifying this trend, with machine learning algorithms being used for predictive modeling and design optimization, leading to a 15% improvement in system efficiency. This integration of digital engineering and embedded systems engineering is critical.
  • Firms are leveraging outsourced engineering r&d services and project management outsourcing to access specialized skills in areas such as hardware engineering services and quality assurance engineering while maintaining focus on their core business objectives.

What challenges does the Engineering Services Outsourcing Industry face during its growth?

  • The risk of intellectual property theft and misuse poses a significant challenge to industry growth.

  • The market faces significant challenges, primarily the risk of intellectual property theft and the complexities of managing dispersed teams, which can increase project-related risks by over 20%. Safeguarding proprietary information during physical design and yield optimization processes is a major concern, especially in cross-border collaborations involving onshore outsourcing and offshore partnerships.
  • The lack of standardized data security protocols can lead to misuse of sensitive designs. Furthermore, the loss of direct business control when managing geographically scattered teams for tasks like avionics systems development and structural analysis can impact project timelines and quality, with some firms reporting a 35% decrease in direct oversight.
  • Geopolitical and regulation changes add another layer of uncertainty, affecting everything from manufacturing process optimization to regulatory compliance engineering and telecom network engineering.

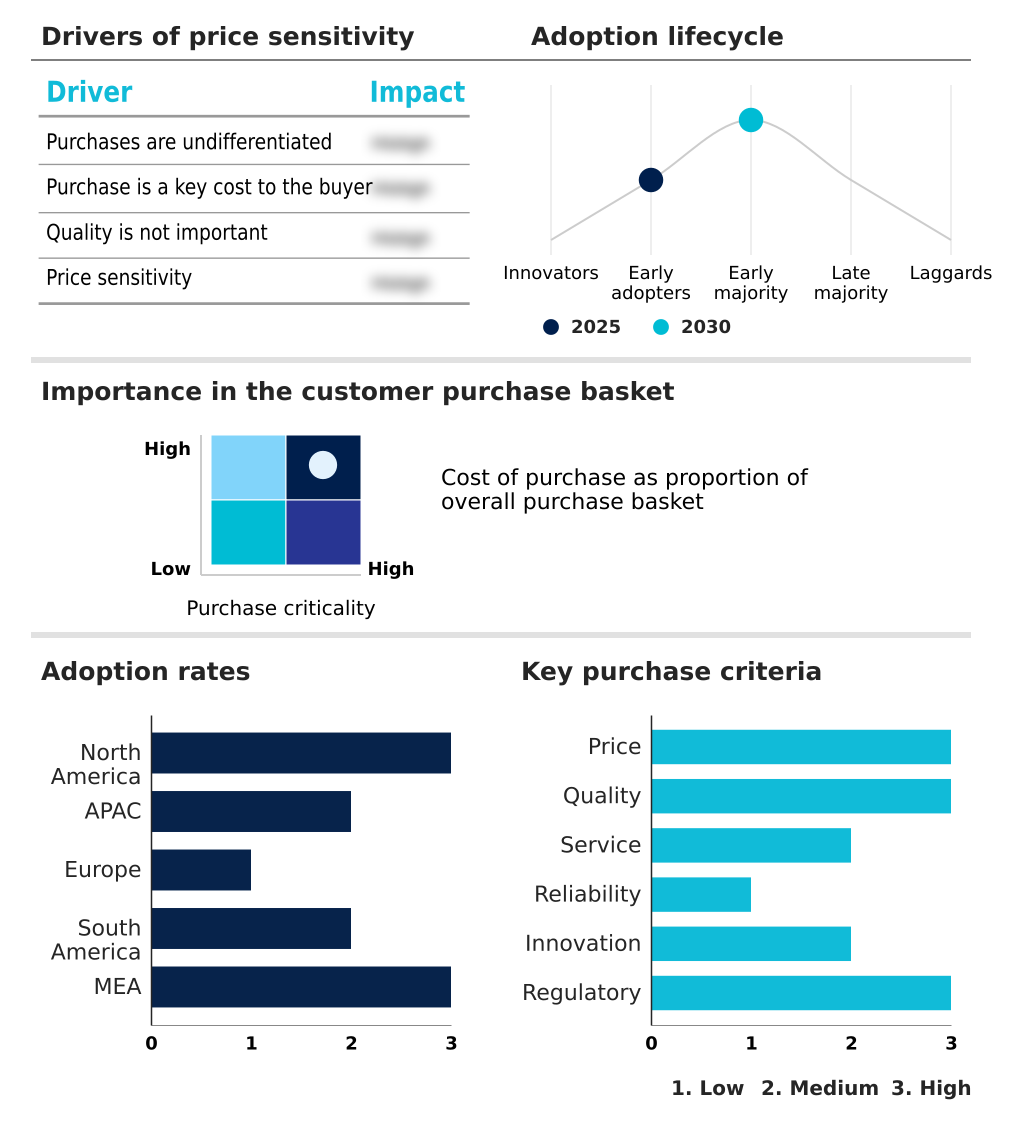
Exclusive Technavio Analysis on Customer Landscape

The engineering services outsourcing market forecasting report includes the adoption lifecycle of the market, covering from the innovator’s stage to the laggard’s stage. It focuses on adoption rates in different regions based on penetration. Furthermore, the engineering services outsourcing market report also includes key purchase criteria and drivers of price sensitivity to help companies evaluate and develop their market growth analysis strategies.

Customer Landscape of Engineering Services Outsourcing Industry

Competitive Landscape

Companies are implementing various strategies, such as strategic alliances, engineering services outsourcing market forecast, partnerships, mergers and acquisitions, geographical expansion, and product/service launches, to enhance their presence in the industry.

Altair Engineering Inc. - Offerings encompass product and digital engineering, R&D services, and technology consulting, enabling clients to access scalable engineering and innovation capabilities.

The industry research and growth report includes detailed analyses of the competitive landscape of the market and information about key companies, including:

  • Altair Engineering Inc.
  • Alten SA
  • Capgemini SE
  • Cyient Ltd.
  • Deaton Engineering Inc.
  • EPAM Systems Inc.
  • FEV Group GmbH
  • Flatworld Solutions Inc.
  • HCL Technologies Ltd.
  • Hitachi Ltd.
  • Honeywell International Inc.
  • Infosys Ltd.
  • Leedeo Engineering S.L.
  • Mahindra and Mahindra Ltd.
  • Siemens AG
  • Sonata Software Ltd.
  • SWAX Engineering GmbH
  • Tata Consultancy Services
  • Wipro Ltd.
  • WorldTeams

Qualitative and quantitative analysis of companies has been conducted to help clients understand the wider business environment as well as the strengths and weaknesses of key industry players. Data is qualitatively analyzed to categorize companies as pure play, category-focused, industry-focused, and diversified; it is quantitatively analyzed to categorize companies as dominant, leading, strong, tentative, and weak.

Recent Development and News in Engineering services outsourcing market

  • In February 2025, Bosch collaborated with engineering outsourcing partners to co-develop next-generation automotive software and embedded systems solutions aimed at improving vehicle intelligence and automation capabilities for global markets.
  • In April 2025, Airbus expanded its collaboration with external engineering service providers to streamline non-core design and simulation activities, allowing its internal teams to focus on advanced aircraft innovation and next-generation aerospace technologies.
  • In May 2025, Infosys collaborated with Boeing to implement AI-driven engineering analytics and predictive design optimization tools, with the goal of improving aircraft system efficiency and reducing development time for new aerospace solutions.
  • In July 2025, Capgemini supported General Motors in accelerating its digital engineering transformation by implementing cloud-based design and simulation solutions through its outsourced engineering services, enabling faster product development.

Dive into Technavio’s robust research methodology, blending expert interviews, extensive data synthesis, and validated models for unparalleled Engineering Services Outsourcing Market insights. See full methodology.

Market Scope
Page number 318
Base year 2025
Historic period 2020-2024
Forecast period 2026-2030
Growth momentum & CAGR Accelerate at a CAGR of 25.7%
Market growth 2026-2030 USD 532165.8 million
Market structure Fragmented
YoY growth 2025-2026(%) 20.5%
Key countries US, Canada, Mexico, China, Japan, India, South Korea, Australia, Indonesia, Germany, UK, France, Italy, Spain, The Netherlands, Brazil, Argentina, Chile, Saudi Arabia, UAE, South Africa, Israel and Turkey
Competitive landscape Leading Companies, Market Positioning of Companies, Competitive Strategies, and Industry Risks

Request Free Sample

Research Analyst Overview

  • The engineering services outsourcing market is defined by its role as a critical enabler of industrial innovation and operational efficiency. Organizations leverage external expertise in product design, simulation, and engineering analytics to focus on core competencies. This strategic delegation of tasks such as powertrain engineering and vehicle development allows companies to accelerate project timelines while managing costs.
  • The adoption of advanced digital engineering tools, including digital twins and generative design, is no longer a differentiator but a baseline expectation. Outsourcing providers are now integral partners in implementing complex technologies like hardware in the loop systems and building information modeling for high-stakes projects.
  • This shift is evident in sectors where specialized capabilities in industrial automation and system architecture are paramount. By leveraging external talent for mechatronics engineering and finite element analysis, firms have achieved a 30% reduction in prototyping costs, underscoring the tangible value of these partnerships in a competitive landscape.

What are the Key Data Covered in this Engineering Services Outsourcing Market Research and Growth Report?

  • What is the expected growth of the Engineering Services Outsourcing Market between 2026 and 2030?

    • USD 532.17 billion, at a CAGR of 25.7%

  • What segmentation does the market report cover?

    • The report is segmented by End-user (Automotive, Consumer electronics, Telecom, Semiconductor, and Others), Sourcing (Offshore, and Onshore), Type (Designing, Prototyping, System integration, Testing, and Others) and Geography (North America, APAC, Europe, South America, Middle East and Africa)

  • Which regions are analyzed in the report?

    • North America, APAC, Europe, South America and Middle East and Africa

  • What are the key growth drivers and market challenges?

    • Cost savings from lower labor wages, Risk of intellectual property theft and misuse

  • Who are the major players in the Engineering Services Outsourcing Market?

    • Altair Engineering Inc., Alten SA, Capgemini SE, Cyient Ltd., Deaton Engineering Inc., EPAM Systems Inc., FEV Group GmbH, Flatworld Solutions Inc., HCL Technologies Ltd., Hitachi Ltd., Honeywell International Inc., Infosys Ltd., Leedeo Engineering S.L., Mahindra and Mahindra Ltd., Siemens AG, Sonata Software Ltd., SWAX Engineering GmbH, Tata Consultancy Services, Wipro Ltd. and WorldTeams

Market Research Insights

  • The market dynamics are shaped by a strategic push for operational efficiency and accelerated innovation, with firms leveraging outsourced product development to shorten project timelines. The adoption of AI in engineering services is becoming standard, with some providers reporting a 15% improvement in predictive maintenance accuracy.
  • Simultaneously, cloud-based engineering platforms enhance collaboration, enabling a 25% reduction in data transfer delays for global teams. As companies pursue time-to-market acceleration, they turn to specialized engineering R&D services and technology consulting services.
  • This focus on external expertise is critical in high-stakes industries, where access to niche skills in areas like embedded software development and reverse engineering services provides a definitive competitive advantage. The ability to scale resources through maintenance and support services also proves vital for managing fluctuating project demands without increasing fixed overhead.

We can help! Our analysts can customize this engineering services outsourcing market research report to meet your requirements.

Get in touch

1. Executive Summary

1.1 Market overview

Executive Summary - Chart on Market Overview
Executive Summary - Data Table on Market Overview
Executive Summary - Chart on Global Market Characteristics
Executive Summary - Chart on Market by Geography
Executive Summary - Chart on Market Segmentation by End-user
Executive Summary - Chart on Market Segmentation by Sourcing
Executive Summary - Chart on Market Segmentation by Type
Executive Summary - Chart on Incremental Growth
Executive Summary - Data Table on Incremental Growth
Executive Summary - Chart on Company Market Positioning

2. Technavio Analysis

2.1 Analysis of price sensitivity, lifecycle, customer purchase basket, adoption rates, and purchase criteria

2.2 Criticality of inputs and Factors of differentiation

Chart on Overview on criticality of inputs and factors of differentiation

2.3 Factors of disruption

Chart on Overview on factors of disruption

2.4 Impact of drivers and challenges

Chart on Impact of drivers and challenges in 2025 and 2030

3. Market Landscape

3.1 Market ecosystem

Chart on Parent Market
Data Table on - Parent Market

3.2 Market characteristics

Chart on Market characteristics analysis

3.3 Value chain analysis

Chart on Value chain analysis

4. Market Sizing

4.1 Market definition

Data Table on Offerings of companies included in the market definition

4.2 Market segment analysis

Market segments

4.3 Market size 2025

4.4 Market outlook: Forecast for 2025-2030

Chart on Global - Market size and forecast 2025-2030 ($ million)
Data Table on Global - Market size and forecast 2025-2030 ($ million)
Chart on Global Market: Year-over-year growth 2025-2030 (%)
Data Table on Global Market: Year-over-year growth 2025-2030 (%)

5. Historic Market Size

5.1 Global Engineering Services Outsourcing Market 2020 - 2024

Historic Market Size - Data Table on Global Engineering Services Outsourcing Market 2020 - 2024 ($ million)

5.2 End-user segment analysis 2020 - 2024

Historic Market Size - End-user Segment 2020 - 2024 ($ million)

5.3 Sourcing segment analysis 2020 - 2024

Historic Market Size - Sourcing Segment 2020 - 2024 ($ million)

5.4 Type segment analysis 2020 - 2024

Historic Market Size - Type Segment 2020 - 2024 ($ million)

5.5 Geography segment analysis 2020 - 2024

Historic Market Size - Geography Segment 2020 - 2024 ($ million)

5.6 Country segment analysis 2020 - 2024

Historic Market Size - Country Segment 2020 - 2024 ($ million)

6. Qualitative Analysis

6.1 Impact of AI on Global Engineering Services Outsourcing Market

6.2 Impact of Geopolitical Conflicts on Global Engineering Services Outsourcing Market

7. Five Forces Analysis

7.1 Five forces summary

Five forces analysis - Comparison between 2025 and 2030

7.2 Bargaining power of buyers

Bargaining power of buyers - Impact of key factors 2025 and 2030

7.3 Bargaining power of suppliers

Bargaining power of suppliers - Impact of key factors in 2025 and 2030

7.4 Threat of new entrants

Threat of new entrants - Impact of key factors in 2025 and 2030

7.5 Threat of substitutes

Threat of substitutes - Impact of key factors in 2025 and 2030

7.6 Threat of rivalry

Threat of rivalry - Impact of key factors in 2025 and 2030

7.7 Market condition

Chart on Market condition - Five forces 2025 and 2030

8. Market Segmentation by End-user

8.1 Market segments

Chart on End-user - Market share 2025-2030 (%)
Data Table on End-user - Market share 2025-2030 (%)

8.2 Comparison by End-user

Chart on Comparison by End-user
Data Table on Comparison by End-user

8.3 Automotive - Market size and forecast 2025-2030

Chart on Automotive - Market size and forecast 2025-2030 ($ million)
Data Table on Automotive - Market size and forecast 2025-2030 ($ million)
Chart on Automotive - Year-over-year growth 2025-2030 (%)
Data Table on Automotive - Year-over-year growth 2025-2030 (%)

8.4 Consumer electronics - Market size and forecast 2025-2030

Chart on Consumer electronics - Market size and forecast 2025-2030 ($ million)
Data Table on Consumer electronics - Market size and forecast 2025-2030 ($ million)
Chart on Consumer electronics - Year-over-year growth 2025-2030 (%)
Data Table on Consumer electronics - Year-over-year growth 2025-2030 (%)

8.5 Telecom - Market size and forecast 2025-2030

Chart on Telecom - Market size and forecast 2025-2030 ($ million)
Data Table on Telecom - Market size and forecast 2025-2030 ($ million)
Chart on Telecom - Year-over-year growth 2025-2030 (%)
Data Table on Telecom - Year-over-year growth 2025-2030 (%)

8.6 Semiconductor - Market size and forecast 2025-2030

Chart on Semiconductor - Market size and forecast 2025-2030 ($ million)
Data Table on Semiconductor - Market size and forecast 2025-2030 ($ million)
Chart on Semiconductor - Year-over-year growth 2025-2030 (%)
Data Table on Semiconductor - Year-over-year growth 2025-2030 (%)

8.7 Others - Market size and forecast 2025-2030

Chart on Others - Market size and forecast 2025-2030 ($ million)
Data Table on Others - Market size and forecast 2025-2030 ($ million)
Chart on Others - Year-over-year growth 2025-2030 (%)
Data Table on Others - Year-over-year growth 2025-2030 (%)

8.8 Market opportunity by End-user

Market opportunity by End-user ($ million)
Data Table on Market opportunity by End-user ($ million)

9. Market Segmentation by Sourcing

9.1 Market segments

Chart on Sourcing - Market share 2025-2030 (%)
Data Table on Sourcing - Market share 2025-2030 (%)

9.2 Comparison by Sourcing

Chart on Comparison by Sourcing
Data Table on Comparison by Sourcing

9.3 Offshore - Market size and forecast 2025-2030

Chart on Offshore - Market size and forecast 2025-2030 ($ million)
Data Table on Offshore - Market size and forecast 2025-2030 ($ million)
Chart on Offshore - Year-over-year growth 2025-2030 (%)
Data Table on Offshore - Year-over-year growth 2025-2030 (%)

9.4 Onshore - Market size and forecast 2025-2030

Chart on Onshore - Market size and forecast 2025-2030 ($ million)
Data Table on Onshore - Market size and forecast 2025-2030 ($ million)
Chart on Onshore - Year-over-year growth 2025-2030 (%)
Data Table on Onshore - Year-over-year growth 2025-2030 (%)

9.5 Market opportunity by Sourcing

Market opportunity by Sourcing ($ million)
Data Table on Market opportunity by Sourcing ($ million)

10. Market Segmentation by Type

10.1 Market segments

Chart on Type - Market share 2025-2030 (%)
Data Table on Type - Market share 2025-2030 (%)

10.2 Comparison by Type

Chart on Comparison by Type
Data Table on Comparison by Type

10.3 Designing - Market size and forecast 2025-2030

Chart on Designing - Market size and forecast 2025-2030 ($ million)
Data Table on Designing - Market size and forecast 2025-2030 ($ million)
Chart on Designing - Year-over-year growth 2025-2030 (%)
Data Table on Designing - Year-over-year growth 2025-2030 (%)

10.4 Prototyping - Market size and forecast 2025-2030

Chart on Prototyping - Market size and forecast 2025-2030 ($ million)
Data Table on Prototyping - Market size and forecast 2025-2030 ($ million)
Chart on Prototyping - Year-over-year growth 2025-2030 (%)
Data Table on Prototyping - Year-over-year growth 2025-2030 (%)

10.5 System integration - Market size and forecast 2025-2030

Chart on System integration - Market size and forecast 2025-2030 ($ million)
Data Table on System integration - Market size and forecast 2025-2030 ($ million)
Chart on System integration - Year-over-year growth 2025-2030 (%)
Data Table on System integration - Year-over-year growth 2025-2030 (%)

10.6 Testing - Market size and forecast 2025-2030

Chart on Testing - Market size and forecast 2025-2030 ($ million)
Data Table on Testing - Market size and forecast 2025-2030 ($ million)
Chart on Testing - Year-over-year growth 2025-2030 (%)
Data Table on Testing - Year-over-year growth 2025-2030 (%)

10.7 Others - Market size and forecast 2025-2030

Chart on Others - Market size and forecast 2025-2030 ($ million)
Data Table on Others - Market size and forecast 2025-2030 ($ million)
Chart on Others - Year-over-year growth 2025-2030 (%)
Data Table on Others - Year-over-year growth 2025-2030 (%)

10.8 Market opportunity by Type

Market opportunity by Type ($ million)
Data Table on Market opportunity by Type ($ million)

11. Customer Landscape

11.1 Customer landscape overview

Analysis of price sensitivity, lifecycle, customer purchase basket, adoption rates, and purchase criteria

12. Geographic Landscape

12.1 Geographic segmentation

Chart on Market share by geography 2025-2030 (%)
Data Table on Market share by geography 2025-2030 (%)

12.2 Geographic comparison

Chart on Geographic comparison
Data Table on Geographic comparison

12.3 North America - Market size and forecast 2025-2030

Chart on North America - Market size and forecast 2025-2030 ($ million)
Data Table on North America - Market size and forecast 2025-2030 ($ million)
Chart on North America - Year-over-year growth 2025-2030 (%)
Data Table on North America - Year-over-year growth 2025-2030 (%)
Chart on Regional Comparison - North America
Data Table on Regional Comparison - North America

12.3.1 US - Market size and forecast 2025-2030

Chart on US - Market size and forecast 2025-2030 ($ million)
Data Table on US - Market size and forecast 2025-2030 ($ million)
Chart on US - Year-over-year growth 2025-2030 (%)
Data Table on US - Year-over-year growth 2025-2030 (%)

12.3.2 Canada - Market size and forecast 2025-2030

Chart on Canada - Market size and forecast 2025-2030 ($ million)
Data Table on Canada - Market size and forecast 2025-2030 ($ million)
Chart on Canada - Year-over-year growth 2025-2030 (%)
Data Table on Canada - Year-over-year growth 2025-2030 (%)

12.3.3 Mexico - Market size and forecast 2025-2030

Chart on Mexico - Market size and forecast 2025-2030 ($ million)
Data Table on Mexico - Market size and forecast 2025-2030 ($ million)
Chart on Mexico - Year-over-year growth 2025-2030 (%)
Data Table on Mexico - Year-over-year growth 2025-2030 (%)

12.4 APAC - Market size and forecast 2025-2030

Chart on APAC - Market size and forecast 2025-2030 ($ million)
Data Table on APAC - Market size and forecast 2025-2030 ($ million)
Chart on APAC - Year-over-year growth 2025-2030 (%)
Data Table on APAC - Year-over-year growth 2025-2030 (%)
Chart on Regional Comparison - APAC
Data Table on Regional Comparison - APAC

12.4.1 China - Market size and forecast 2025-2030

Chart on China - Market size and forecast 2025-2030 ($ million)
Data Table on China - Market size and forecast 2025-2030 ($ million)
Chart on China - Year-over-year growth 2025-2030 (%)
Data Table on China - Year-over-year growth 2025-2030 (%)

12.4.2 Japan - Market size and forecast 2025-2030

Chart on Japan - Market size and forecast 2025-2030 ($ million)
Data Table on Japan - Market size and forecast 2025-2030 ($ million)
Chart on Japan - Year-over-year growth 2025-2030 (%)
Data Table on Japan - Year-over-year growth 2025-2030 (%)

12.4.3 India - Market size and forecast 2025-2030

Chart on India - Market size and forecast 2025-2030 ($ million)
Data Table on India - Market size and forecast 2025-2030 ($ million)
Chart on India - Year-over-year growth 2025-2030 (%)
Data Table on India - Year-over-year growth 2025-2030 (%)

12.4.4 South Korea - Market size and forecast 2025-2030

Chart on South Korea - Market size and forecast 2025-2030 ($ million)
Data Table on South Korea - Market size and forecast 2025-2030 ($ million)
Chart on South Korea - Year-over-year growth 2025-2030 (%)
Data Table on South Korea - Year-over-year growth 2025-2030 (%)

12.4.5 Australia - Market size and forecast 2025-2030

Chart on Australia - Market size and forecast 2025-2030 ($ million)
Data Table on Australia - Market size and forecast 2025-2030 ($ million)
Chart on Australia - Year-over-year growth 2025-2030 (%)
Data Table on Australia - Year-over-year growth 2025-2030 (%)

12.4.6 Indonesia - Market size and forecast 2025-2030

Chart on Indonesia - Market size and forecast 2025-2030 ($ million)
Data Table on Indonesia - Market size and forecast 2025-2030 ($ million)
Chart on Indonesia - Year-over-year growth 2025-2030 (%)
Data Table on Indonesia - Year-over-year growth 2025-2030 (%)

12.5 Europe - Market size and forecast 2025-2030

Chart on Europe - Market size and forecast 2025-2030 ($ million)
Data Table on Europe - Market size and forecast 2025-2030 ($ million)
Chart on Europe - Year-over-year growth 2025-2030 (%)
Data Table on Europe - Year-over-year growth 2025-2030 (%)
Chart on Regional Comparison - Europe
Data Table on Regional Comparison - Europe

12.5.1 Germany - Market size and forecast 2025-2030

Chart on Germany - Market size and forecast 2025-2030 ($ million)
Data Table on Germany - Market size and forecast 2025-2030 ($ million)
Chart on Germany - Year-over-year growth 2025-2030 (%)
Data Table on Germany - Year-over-year growth 2025-2030 (%)

12.5.2 UK - Market size and forecast 2025-2030

Chart on UK - Market size and forecast 2025-2030 ($ million)
Data Table on UK - Market size and forecast 2025-2030 ($ million)
Chart on UK - Year-over-year growth 2025-2030 (%)
Data Table on UK - Year-over-year growth 2025-2030 (%)

12.5.3 France - Market size and forecast 2025-2030

Chart on France - Market size and forecast 2025-2030 ($ million)
Data Table on France - Market size and forecast 2025-2030 ($ million)
Chart on France - Year-over-year growth 2025-2030 (%)
Data Table on France - Year-over-year growth 2025-2030 (%)

12.5.4 Italy - Market size and forecast 2025-2030

Chart on Italy - Market size and forecast 2025-2030 ($ million)
Data Table on Italy - Market size and forecast 2025-2030 ($ million)
Chart on Italy - Year-over-year growth 2025-2030 (%)
Data Table on Italy - Year-over-year growth 2025-2030 (%)

12.5.5 Spain - Market size and forecast 2025-2030

Chart on Spain - Market size and forecast 2025-2030 ($ million)
Data Table on Spain - Market size and forecast 2025-2030 ($ million)
Chart on Spain - Year-over-year growth 2025-2030 (%)
Data Table on Spain - Year-over-year growth 2025-2030 (%)

12.5.6 The Netherlands - Market size and forecast 2025-2030

Chart on The Netherlands - Market size and forecast 2025-2030 ($ million)
Data Table on The Netherlands - Market size and forecast 2025-2030 ($ million)
Chart on The Netherlands - Year-over-year growth 2025-2030 (%)
Data Table on The Netherlands - Year-over-year growth 2025-2030 (%)

12.6 South America - Market size and forecast 2025-2030

Chart on South America - Market size and forecast 2025-2030 ($ million)
Data Table on South America - Market size and forecast 2025-2030 ($ million)
Chart on South America - Year-over-year growth 2025-2030 (%)
Data Table on South America - Year-over-year growth 2025-2030 (%)
Chart on Regional Comparison - South America
Data Table on Regional Comparison - South America

12.6.1 Brazil - Market size and forecast 2025-2030

Chart on Brazil - Market size and forecast 2025-2030 ($ million)
Data Table on Brazil - Market size and forecast 2025-2030 ($ million)
Chart on Brazil - Year-over-year growth 2025-2030 (%)
Data Table on Brazil - Year-over-year growth 2025-2030 (%)

12.6.2 Argentina - Market size and forecast 2025-2030

Chart on Argentina - Market size and forecast 2025-2030 ($ million)
Data Table on Argentina - Market size and forecast 2025-2030 ($ million)
Chart on Argentina - Year-over-year growth 2025-2030 (%)
Data Table on Argentina - Year-over-year growth 2025-2030 (%)

12.6.3 Chile - Market size and forecast 2025-2030

Chart on Chile - Market size and forecast 2025-2030 ($ million)
Data Table on Chile - Market size and forecast 2025-2030 ($ million)
Chart on Chile - Year-over-year growth 2025-2030 (%)
Data Table on Chile - Year-over-year growth 2025-2030 (%)

12.7 Middle East and Africa - Market size and forecast 2025-2030

Chart on Middle East and Africa - Market size and forecast 2025-2030 ($ million)
Data Table on Middle East and Africa - Market size and forecast 2025-2030 ($ million)
Chart on Middle East and Africa - Year-over-year growth 2025-2030 (%)
Data Table on Middle East and Africa - Year-over-year growth 2025-2030 (%)
Chart on Regional Comparison - Middle East and Africa
Data Table on Regional Comparison - Middle East and Africa

12.7.1 Saudi Arabia - Market size and forecast 2025-2030

Chart on Saudi Arabia - Market size and forecast 2025-2030 ($ million)
Data Table on Saudi Arabia - Market size and forecast 2025-2030 ($ million)
Chart on Saudi Arabia - Year-over-year growth 2025-2030 (%)
Data Table on Saudi Arabia - Year-over-year growth 2025-2030 (%)

12.7.2 UAE - Market size and forecast 2025-2030

Chart on UAE - Market size and forecast 2025-2030 ($ million)
Data Table on UAE - Market size and forecast 2025-2030 ($ million)
Chart on UAE - Year-over-year growth 2025-2030 (%)
Data Table on UAE - Year-over-year growth 2025-2030 (%)

12.7.3 South Africa - Market size and forecast 2025-2030

Chart on South Africa - Market size and forecast 2025-2030 ($ million)
Data Table on South Africa - Market size and forecast 2025-2030 ($ million)
Chart on South Africa - Year-over-year growth 2025-2030 (%)
Data Table on South Africa - Year-over-year growth 2025-2030 (%)

12.7.4 Israel - Market size and forecast 2025-2030

Chart on Israel - Market size and forecast 2025-2030 ($ million)
Data Table on Israel - Market size and forecast 2025-2030 ($ million)
Chart on Israel - Year-over-year growth 2025-2030 (%)
Data Table on Israel - Year-over-year growth 2025-2030 (%)

12.7.5 Turkey - Market size and forecast 2025-2030

Chart on Turkey - Market size and forecast 2025-2030 ($ million)
Data Table on Turkey - Market size and forecast 2025-2030 ($ million)
Chart on Turkey - Year-over-year growth 2025-2030 (%)
Data Table on Turkey - Year-over-year growth 2025-2030 (%)

12.8 Market opportunity by geography

Market opportunity by geography ($ million)
Data Tables on Market opportunity by geography ($ million)

13. Drivers, Challenges, and Opportunity

13.1 Market drivers

Cost savings from lower labor wages
Reduced time to market and improved access to emerging markets
Growing focus on core competencies of in-house expertise

13.2 Market challenges

Risk of intellectual property theft and misuse
Concerns over loss of business control and management of dispersed teams
Geopolitical and regulation changes degrading market growth

13.3 Impact of drivers and challenges

Impact of drivers and challenges in 2025 and 2030

13.4 Market opportunities

Rise in collaborative and co-innovation partnerships with outsourcing firms
Increasing digital transformation in organizations is accelerating market growth
Growing adoption of artificial intelligence is amplifying market expedition rate

14. Competitive Landscape

14.1 Overview

14.2

Overview on criticality of inputs and factors of differentiation

14.3 Landscape disruption

Overview on factors of disruption

14.4 Industry risks

Impact of key risks on business

15. Competitive Analysis

15.1 Companies profiled

Companies covered

15.2 Company ranking index

15.3 Market positioning of companies

Matrix on companies position and classification

15.4 Altair Engineering Inc.

Altair Engineering Inc. - Overview
Altair Engineering Inc. - Product / Service
Altair Engineering Inc. - Key offerings
SWOT

15.5 Alten SA

Alten SA - Overview
Alten SA - Business segments
Alten SA - Key offerings
Alten SA - Segment focus
SWOT

15.6 Capgemini SE

Capgemini SE - Overview
Capgemini SE - Business segments
Capgemini SE - Key news
Capgemini SE - Key offerings
Capgemini SE - Segment focus
SWOT

15.7 Cyient Ltd.

Cyient Ltd. - Overview
Cyient Ltd. - Business segments
Cyient Ltd. - Key offerings
Cyient Ltd. - Segment focus
SWOT

15.8 EPAM Systems Inc.

EPAM Systems Inc. - Overview
EPAM Systems Inc. - Business segments
EPAM Systems Inc. - Key news
EPAM Systems Inc. - Key offerings
EPAM Systems Inc. - Segment focus
SWOT

15.9 FEV Group GmbH

FEV Group GmbH - Overview
FEV Group GmbH - Product / Service
FEV Group GmbH - Key offerings
SWOT

15.10 HCL Technologies Ltd.

HCL Technologies Ltd. - Overview
HCL Technologies Ltd. - Business segments
HCL Technologies Ltd. - Key offerings
HCL Technologies Ltd. - Segment focus
SWOT

15.11 Hitachi Ltd.

Hitachi Ltd. - Overview
Hitachi Ltd. - Business segments
Hitachi Ltd. - Key offerings
Hitachi Ltd. - Segment focus
SWOT

15.12 Honeywell International Inc.

Honeywell International Inc. - Overview
Honeywell International Inc. - Business segments
Honeywell International Inc. - Key news
Honeywell International Inc. - Key offerings
Honeywell International Inc. - Segment focus
SWOT

15.13 Infosys Ltd.

Infosys Ltd. - Overview
Infosys Ltd. - Business segments
Infosys Ltd. - Key news
Infosys Ltd. - Key offerings
Infosys Ltd. - Segment focus
SWOT

15.14 Mahindra and Mahindra Ltd.

Mahindra and Mahindra Ltd. - Overview
Mahindra and Mahindra Ltd. - Business segments
Mahindra and Mahindra Ltd. - Key news
Mahindra and Mahindra Ltd. - Key offerings
Mahindra and Mahindra Ltd. - Segment focus
SWOT

15.15 Siemens AG

Siemens AG - Overview
Siemens AG - Business segments
Siemens AG - Key news
Siemens AG - Key offerings
Siemens AG - Segment focus
SWOT

15.16 Sonata Software Ltd.

Sonata Software Ltd. - Overview
Sonata Software Ltd. - Business segments
Sonata Software Ltd. - Key offerings
Sonata Software Ltd. - Segment focus
SWOT

15.17 Tata Consultancy Services

Tata Consultancy Services - Overview
Tata Consultancy Services - Business segments
Tata Consultancy Services - Key offerings
Tata Consultancy Services - Segment focus
SWOT

15.18 Wipro Ltd.

Wipro Ltd. - Overview
Wipro Ltd. - Business segments
Wipro Ltd. - Key news
Wipro Ltd. - Key offerings
Wipro Ltd. - Segment focus
SWOT

16. Appendix

16.1 Scope of the report

Market definition
Objectives
Notes and caveats

16.2 Inclusions and exclusions checklist

Inclusions checklist
Exclusions checklist

16.3 Currency conversion rates for US$

16.4 Research methodology

16.5 Data procurement

Information sources

16.6 Data validation

16.7 Validation techniques employed for market sizing

16.8 Data synthesis

16.9 360 degree market analysis

16.10 List of abbreviations

Research Methodology

Technavio presents a detailed picture of the market by way of study, synthesis, and summation of data from multiple sources. The analysts have presented the various facets of the market with a particular focus on identifying the key industry influencers. The data thus presented is comprehensive, reliable, and the result of extensive research, both primary and secondary.

INFORMATION SOURCES

Primary sources

  • Manufacturers and suppliers
  • Channel partners
  • Industry experts
  • Strategic decision makers

Secondary sources

  • Industry journals and periodicals
  • Government data
  • Financial reports of key industry players
  • Historical data
  • Press releases

DATA ANALYSIS

Data Synthesis

  • Collation of data
  • Estimation of key figures
  • Analysis of derived insights

Data Validation

  • Triangulation with data models
  • Reference against proprietary databases
  • Corroboration with industry experts

REPORT WRITING

Qualitative

  • Market drivers
  • Market challenges
  • Market trends
  • Five forces analysis

Quantitative

  • Market size and forecast
  • Market segmentation
  • Geographical insights
  • Competitive landscape

Interested in this report?

Get your sample now to see our research methodology and insights!

Download Now

Frequently Asked Questions

Engineering Services Outsourcing market growth will increase by USD 532165.8 million during 2026-2030.

The Engineering Services Outsourcing market is expected to grow at a CAGR of 25.7% during 2026-2030.

Engineering Services Outsourcing market is segmented by End-user (Automotive, Consumer electronics, Telecom, Semiconductor, Others) Sourcing (Offshore, Onshore) Type (Designing, Prototyping, System integration, Testing, Others)

Altair Engineering Inc., Alten SA, Capgemini SE, Cyient Ltd., Deaton Engineering Inc., EPAM Systems Inc., FEV Group GmbH, Flatworld Solutions Inc., HCL Technologies Ltd., Hitachi Ltd., Honeywell International Inc., Infosys Ltd., Leedeo Engineering S.L., Mahindra and Mahindra Ltd., Siemens AG, Sonata Software Ltd., SWAX Engineering GmbH, Tata Consultancy Services, Wipro Ltd., WorldTeams are a few of the key vendors in the Engineering Services Outsourcing market.

North America will register the highest growth rate of 42.6% among the other regions. Therefore, the Engineering Services Outsourcing market in North America is expected to garner significant business opportunities for the vendors during the forecast period.

US, Canada, Mexico, China, Japan, India, South Korea, Australia, Indonesia, Germany, UK, France, Italy, Spain, The Netherlands, Brazil, Argentina, Chile, Saudi Arabia, UAE, South Africa, Israel, Turkey

  • Cost savings from lower labor wages is the driving factor this market.

The Engineering Services Outsourcing market vendors should focus on grabbing business opportunities from the End-user segment as it accounted for the largest market share in the base year.
RIA - Research AI Assistant
Ask RIA