Enterprise Decision Intelligence Platforms Market Analysis, Size, and Forecast 2026-2030: North America (US, Canada, and Mexico), Europe (Germany, UK, and France), APAC (China, India, and Japan), South America (Brazil, Argentina, and Colombia), Middle East and Africa (South Africa, Saudi Arabia, and UAE), and Rest of World (ROW)

Enterprise Decision Intelligence Platforms Market Analysis, Size, and Forecast 2026-2030:
North America (US, Canada, and Mexico), Europe (Germany, UK, and France), APAC (China, India, and Japan), South America (Brazil, Argentina, and Colombia), Middle East and Africa (South Africa, Saudi Arabia, and UAE), and Rest of World (ROW)

Published: May 2026 292 Pages SKU: IRTNTR81339

Market Overview at a Glance

$17.84 B
Market Opportunity
15.9%
CAGR 2025 - 2030
31.2%
North America Growth
$9.94 B
Solutions segment 2024

Enterprise Decision Intelligence Platforms Market Size and Growth Forecast 2026-2030

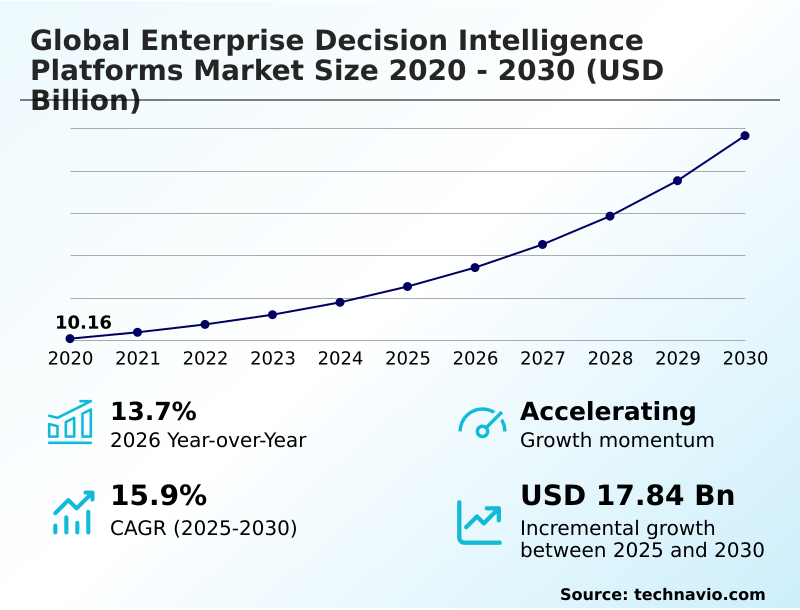
The Enterprise Decision Intelligence Platforms Market size was valued at USD 16.32 billion in 2025 growing at a CAGR of 15.9% during the forecast period 2026-2030.

North America accounts for 31.2% of incremental growth during the forecast period. The Solutions segment by Component was valued at USD 9.94 billion in 2024, while the On premises segment holds the largest revenue share by Deployment.

The market is projected to grow by USD 23.99 billion from 2020 to 2030, with USD 17.84 billion of the growth expected during the forecast period of 2025 to 2030.

Get Key Insights on Market Forecast (PDF) Request Free Sample

Enterprise Decision Intelligence Platforms Market Overview

The enterprise decision intelligence platforms market is expanding at a significant pace, with year-over-year growth reaching 13.7% as organizations move beyond retrospective analytics. This expansion is driven by the need for automated reasoning and predictive capabilities to navigate complex business environments. By integrating behavioral science methodologies with advanced AI, these platforms bridge the gap between data analysis and actionable business outcomes. A practical application is seen in the logistics sector, where a freight forwarder uses a platform to run what-if scenarios for optimizing shipping routes against fuel costs, weather, and geopolitical risk, typically reducing transit delays by over 15%. This capability for data-driven precision is essential for maintaining a competitive edge. The technology allows for the harmonization of disparate data streams, enhancing operational agility and reducing the cognitive biases inherent in manual strategic planning. As a result, these intelligent systems are becoming indispensable for enterprises in high-velocity industries seeking to improve decision quality.

Drivers, Trends, and Challenges in the Enterprise Decision Intelligence Platforms Market

The enterprise decision intelligence platforms market is evolving to address highly specific and complex operational challenges. The demand for enterprise decision intelligence for supply chain optimization is intensifying as global logistics networks face unprecedented volatility.

Concurrently, causal AI integration in financial risk assessment is becoming standard practice for institutions seeking to comply with frameworks like Basel III, with platforms often reducing complex risk modeling times by over 50% compared to manual methods.

This drive for efficiency is matched by a growing focus on governance, with an emphasis on deploying explainable AI for corporate governance to satisfy auditors and regulators.

For instance, a multinational manufacturing firm uses a platform for real-time edge analytics at its smart factories to predict equipment failure, while its central office uses the same underlying technology for high-level strategic planning.

The future of the market hinges on advanced architectures, where the quantum computing impact on enterprise decision making promises to solve previously intractable optimization problems, moving the industry further toward fully automated, auditable, and intelligent business processes.

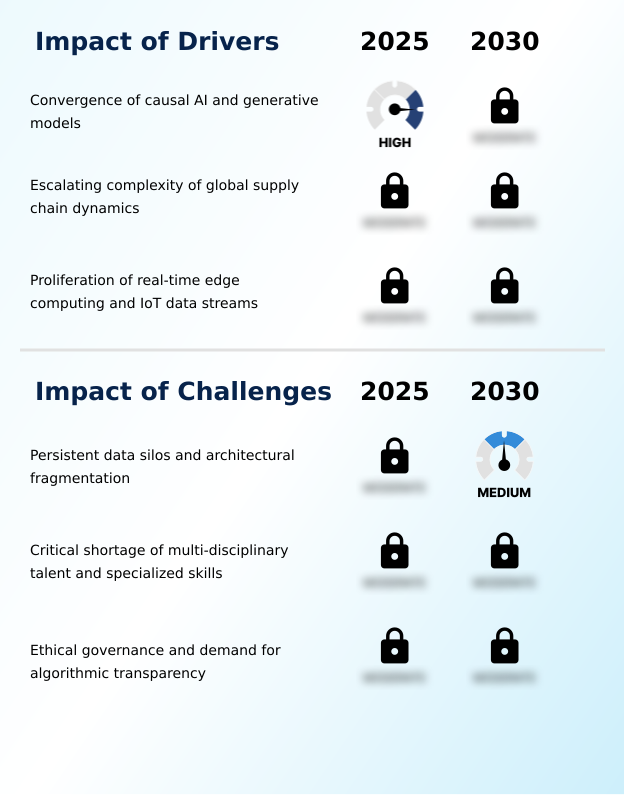
Primary Growth Driver: The convergence of causal AI and generative models is a primary market driver, enabling platforms to deliver explainable, data-driven strategies.

Market expansion is primarily driven by technological convergence and escalating operational complexity.

The fusion of causal AI with generative pre-trained transformers allows platforms to move beyond correlation to understand causality, providing a logical framework for strategic planning and reducing reliance on intuition.

This is critical as enterprises navigate increasingly intricate global supply chains, where real-time visibility and predictive capabilities are essential for supply chain resilience.

Another significant driver is the proliferation of the Internet of Things (IoT), which generates massive data streams from industrial equipment.

The subsequent rise of real-time edge computing and decentralized processing enables organizations to make instantaneous, automated adjustments in manufacturing and energy management, thereby gaining a significant competitive advantage through enhanced operational agility.

Emerging Market Trend: A key market trend involves the integration of affective computing into executive decision interfaces. This enhances outcomes by providing cognitive prompts based on real-time emotional and physiological data.

Emerging trends are centered on creating a more symbiotic relationship between human decision-makers and intelligent systems. The integration of affective computing is a notable advancement, where platforms use biometric data to detect emotional bias or fatigue, delivering cognitive prompts to guide users toward more objective analysis within the decision-making loop.

Concurrently, the rise of quantum-classic hybrid architectures enables firms to solve complex combinatorial optimization problems in logistics and energy management that are beyond the scope of classical computers.

To ensure accountability, organizations are adopting decentralized autonomous decision protocols, which create verifiable decision trails on a distributed ledger, crucial for sectors where algorithmic auditing under regulations like the EU AI Act is becoming standard. These trends collectively push the market toward more transparent, efficient, and human-aware decision support systems.

Key Industry Challenge: Persistent data silos and fragmented data architectures present a key challenge, limiting the efficacy of decision intelligence platforms by preventing access to unified datasets.

Significant challenges constrain the market, primarily stemming from foundational data issues and governance complexities. Persistent data silos and fragmented data architectures within large organizations prevent platforms from accessing the unified, high-quality data essential for accurate modeling. This fragmentation increases implementation costs and limits the enterprise-wide impact of the technology.

A critical shortage of talent with multidisciplinary domain knowledge in both data science and business strategy creates a bottleneck, hampering the effective use of sophisticated algorithmic outputs.

Furthermore, the demand for algorithmic transparency, driven by regulations such as the General Data Protection Regulation (GDPR), conflicts with the 'black box' nature of some advanced models, creating significant legal and reputational risks related to ethical guidelines and potential bias.

Explore Full Market Dynamics Analysis Request Free Sample

Enterprise Decision Intelligence Platforms Market Segmentation

The enterprise decision intelligence platforms industry research report provides comprehensive data including region-wise segment analysis, with forecasts and analysis for the period 2026-2030, as well as historical data from 2020-2024 for the following segments.

Market Segment by Component
  • Solutions
  • Services
Market Segment by Deployment
  • On premises
  • Cloud based
  • Hybrid
Market Segment by End-user
  • Large enterprises
  • SMEs
Market Segment by Geography
North America
US, Canada, Mexico
Europe
Germany, UK, France, The Netherlands, Italy, Spain
APAC
China, India, Japan, Australia, South Korea, Indonesia
South America
Brazil, Argentina, Colombia
Middle East and Africa
South Africa, Saudi Arabia, UAE, Israel, Turkey

Component Segment Analysis

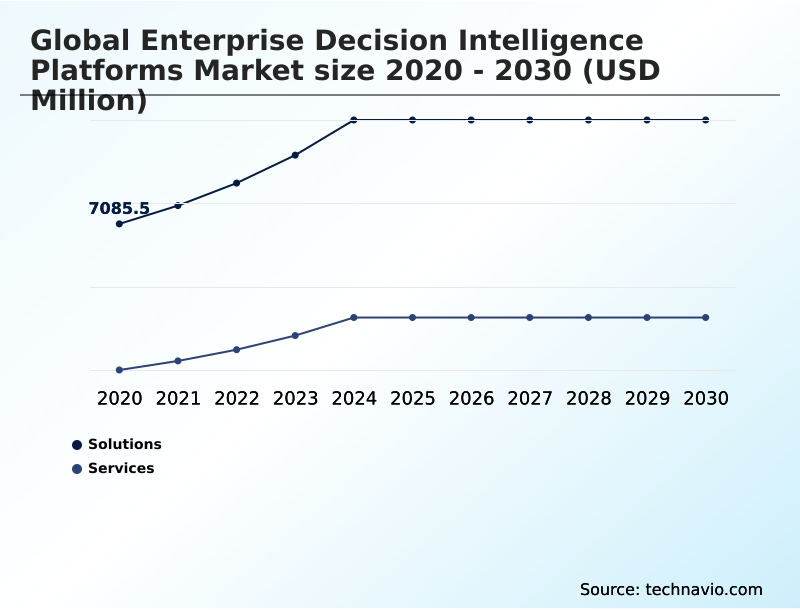
The solutions segment is estimated to witness significant growth during the forecast period.

The solutions segment is the technological core of the enterprise decision intelligence platforms market, representing approximately 68.4% of the total market value. These software offerings integrate sophisticated machine learning algorithms and automated reasoning to translate complex data into strategic action.

Demand is centered on platforms that provide predictive capabilities to manage massive datasets that exceed human cognitive limits. The evolution of generative AI now allows these solutions to offer natural language explanations for intricate recommendations, enhancing trust among executive leadership.

Adoption is particularly high in sectors requiring data-driven precision, where these platforms provide a centralized environment for modeling various scenarios and assessing the impact of strategic choices, ensuring operational execution aligns with corporate goals.

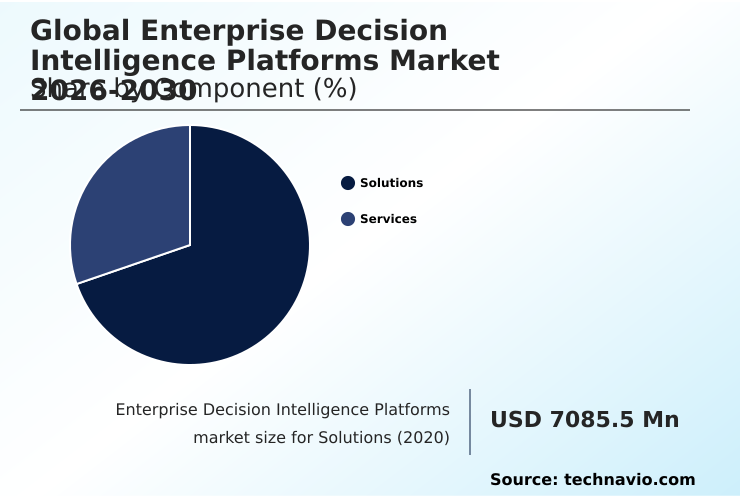
The Solutions segment was valued at USD 9.94 billion in 2024 and showed a gradual increase during the forecast period.

Enterprise Decision Intelligence Platforms Market by Region: North America Leads with 31.2% Growth Share

North America is estimated to contribute 31.2% to the growth of the global market during the forecast period.

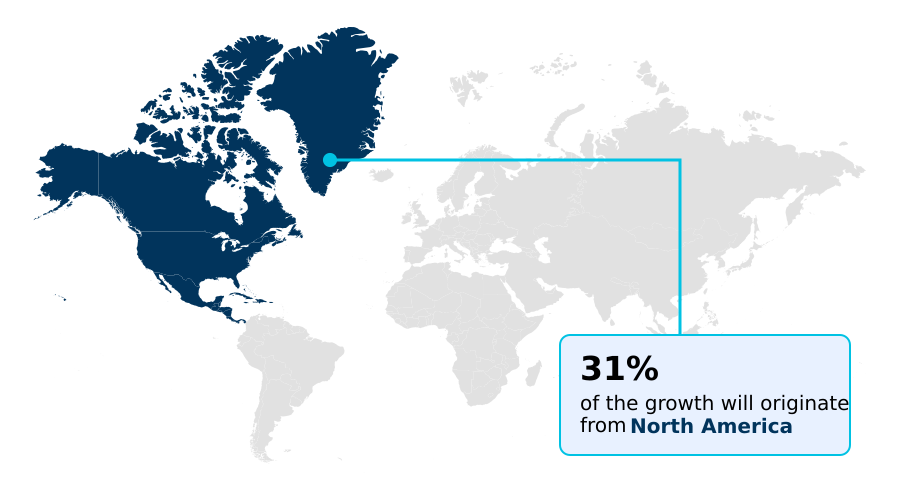
The geographic landscape for enterprise decision intelligence platforms is increasingly multipolar, with North America, Europe, and APAC contributing 31.2%, 28.8%, and 29.8% of incremental growth, respectively.

In North America, adoption is driven by a high concentration of technology providers and early adoption in finance and healthcare.

The European market, governed by strict data sovereignty rules under the General Data Protection Regulation (GDPR), prioritizes explainable AI tools and ethical guidelines. This has led to demand for platforms that offer algorithmic transparency.

APAC is the fastest-growing region, fueled by government-led digital transformation initiatives and the modernization of manufacturing and supply chain infrastructure.

Across all regions, the core challenge is adapting these intelligent systems to diverse regulatory frameworks while delivering consistent, data-driven precision in business operations.

Customer Landscape Analysis for the Enterprise Decision Intelligence Platforms Market

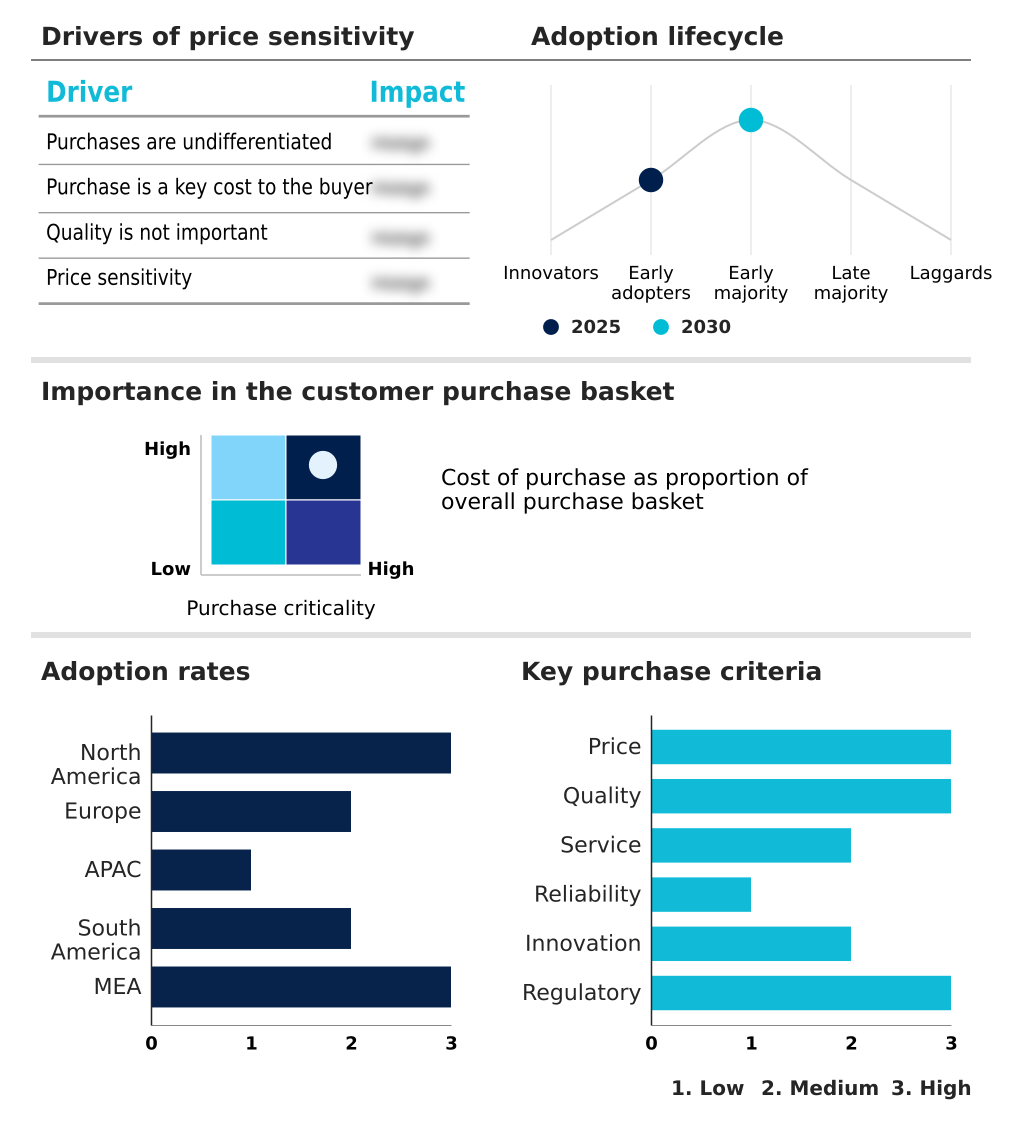
The enterprise decision intelligence platforms market forecasting report includes the adoption lifecycle of the market, covering from the innovator’s stage to the laggard’s stage. It focuses on adoption rates in different regions based on penetration. Furthermore, the enterprise decision intelligence platforms market report also includes key purchase criteria and drivers of price sensitivity to help companies evaluate and develop their market growth analysis strategies.

Competitive Landscape of the Enterprise Decision Intelligence Platforms Market

Companies are implementing various strategies, such as strategic alliances, partnerships, mergers and acquisitions, geographical expansion, and product/service launches, to enhance their presence in the enterprise decision intelligence platforms market industry.

Aera Technology - Key offerings integrate AI and analytics into unified platforms, automating complex business decisions and augmenting strategic planning for enhanced operational intelligence.

The industry research and growth report includes detailed analyses of the competitive landscape of the market and information about key companies, including:

  • Aera Technology
  • Alteryx Inc.
  • Amazon.com Inc.
  • Celonis SE
  • Databricks Inc.
  • DataRobot Inc.
  • Google LLC
  • IBM Corp.
  • Oracle Corp.
  • Palantir Technologies Inc.
  • Pyramid Analytics BV
  • QlikTech International AB
  • Quantexa Ltd.
  • Salesforce Inc.
  • SAP SE
  • SAS Institute Inc.
  • Snowflake Inc.
  • Tellius Inc.
  • Teradata Corp.
  • ThoughtSpot Inc.

Qualitative and quantitative analysis of companies has been conducted to help clients understand the wider business environment as well as the strengths and weaknesses of key industry players. Data is qualitatively analyzed to categorize companies as pure play, category-focused, industry-focused, and diversified; it is quantitatively analyzed to categorize companies as dominant, leading, strong, tentative, and weak.

Recent Developments in the Enterprise Decision Intelligence Platforms Market

  • In January, 2025, Bamboo Rose completed the acquisition of Verteego, an AI platform specializing in retail analytics. The acquisition enabled Bamboo Rose to launch a retail-focused decision intelligence platform designed to improve merchandising, pricing, and supply-chain decision processes.
  • In May, 2025, a National Health Service in a Northern European country implemented a decision intelligence platform to optimize the allocation of medical resources and staff during seasonal health crises, highlighting a move toward data-driven public sector management.
  • In September, 2025, procurement intelligence provider Beroe acquired London-based Forestreet, a startup focused on AI-powered supplier discovery. The acquisition is intended to strengthen Beroe's procurement decision intelligence capabilities by accelerating the development of an AI-first supplier intelligence platform.
  • In November, 2025, BigBear.ai agreed to acquire Ask Sage, a generative AI platform designed for secure AI deployment in government and regulated sectors. The transaction aims to combine BigBear.ai's decision intelligence software with generative AI tools to support automated operational decision-making.

Research Analyst Overview: Enterprise Decision Intelligence Platforms Market

The enterprise decision intelligence platforms market is defined by a strategic shift from retrospective business intelligence to forward-looking, prescriptive insights. This transition is fueled by the integration of causal AI and generative pre-trained transformers, which deliver data-driven precision that was previously unattainable.

Boardroom decisions regarding capital allocation are now directly influenced by the outputs of these intelligent systems, which can model complex what-if scenarios for strategic planning. With APAC growing at a notable 17.7%, the global competitive landscape is intensifying.

Compliance with guidelines from bodies like the Federal Trade Commission, which emphasize the need for explainable AI tools, is also shaping product development. The core technology, incorporating sophisticated machine learning algorithms and automated reasoning, is enabling a new level of operational execution.

Enterprises are leveraging these platforms to enhance supply chain resilience and achieve a sustainable competitive advantage in a volatile global economy, making data science a central pillar of modern business operations.

Dive into Technavio’s robust research methodology, blending expert interviews, extensive data synthesis, and validated models for unparalleled Enterprise Decision Intelligence Platforms Market insights. See full methodology.

Request Free Sample

Market Scope
Page number 292
Base year 2025
Historic period 2020-2024
Forecast period 2026-2030
Growth momentum & CAGR Accelerate at a CAGR of 15.9%
Market growth 2026-2030 USD 17837.3 million
Market structure Fragmented
YoY growth 2025-2026(%) 13.7%
Key countries US, Canada, Mexico, Germany, UK, France, The Netherlands, Italy, Spain, China, India, Japan, Australia, South Korea, Indonesia, Brazil, Argentina, Colombia, South Africa, Saudi Arabia, UAE, Israel and Turkey
Competitive landscape Leading Companies, Market Positioning of Companies, Competitive Strategies, and Industry Risks

Enterprise Decision Intelligence Platforms Market: Key Questions Answered in This Report

  • What is the expected growth of the Enterprise Decision Intelligence Platforms Market between 2026 and 2030?

    • The Enterprise Decision Intelligence Platforms Market is expected to grow by USD 17.84 billion during 2026-2030, registering a CAGR of 15.9%. Year-over-year growth in 2026 is estimated at 13.7%%. This acceleration is shaped by convergence of causal ai and generative models, which is intensifying demand across multiple end-use verticals covered in the report.

  • What segmentation does the market report cover?

    • The report is segmented by Component (Solutions, and Services), Deployment (On premises, Cloud based, and Hybrid), End-user (Large enterprises, and SMEs) and Geography (North America, Europe, APAC, South America, Middle East and Africa). Among these, the Solutions segment is estimated to witness significant growth during the forecast period, driven by rising adoption across key application areas. Each segment includes detailed qualitative and quantitative analysis, along with historical data from 2020-2024 and forecasts through 2030 with year-over-year growth rates.

  • Which regions are analyzed in the report?

    • The report covers North America, Europe, APAC, South America and Middle East and Africa. North America is estimated to contribute 31.2% to market growth during the forecast period. Country-level analysis includes US, Canada, Mexico, Germany, UK, France, The Netherlands, Italy, Spain, China, India, Japan, Australia, South Korea, Indonesia, Brazil, Argentina, Colombia, South Africa, Saudi Arabia, UAE, Israel and Turkey, with dedicated market size tables and year-over-year growth for each.

  • What are the key growth drivers and market challenges?

    • The primary driver is convergence of causal ai and generative models, which is accelerating investment and industry demand. The main challenge is persistent data silos and architectural fragmentation, creating operational barriers for key market participants. The report quantifies the impact of each driver and challenge across 2026 and 2030 with comparative analysis.

  • Who are the major players in the Enterprise Decision Intelligence Platforms Market?

    • Key vendors include Aera Technology, Alteryx Inc., Amazon.com Inc., Celonis SE, Databricks Inc., DataRobot Inc., Google LLC, IBM Corp., Oracle Corp., Palantir Technologies Inc., Pyramid Analytics BV, QlikTech International AB, Quantexa Ltd., Salesforce Inc., SAP SE, SAS Institute Inc., Snowflake Inc., Tellius Inc., Teradata Corp. and ThoughtSpot Inc.. The report provides qualitative and quantitative analysis categorizing companies as dominant, leading, strong, tentative, and weak based on their market positioning. Company profiles include business segment analysis, SWOT assessment, key offerings, and recent strategic developments.

Enterprise Decision Intelligence Platforms Market Research Insights

Market dynamics are shaped by the drive for autonomous business logic and hyper-personalization, with platform adoption varying by regional regulatory climates. In Europe, the EU AI Act mandates stringent oversight, promoting human-in-the-loop systems, whereas North America focuses on innovation speed. This is reflected in regional growth, with APAC's 17.7% rate outpacing North America's 14.8% due to rapid digitalization.

Enterprises are processing vast data streams to gain a competitive advantage in real-time. For instance, a telecommunications firm might use a decision intelligence platform to analyze network traffic data streams in real time, automatically adjusting bandwidth allocation to prevent service degradation during peak usage, a process that requires both machine speed and human oversight for strategic adjustments.

This balance between automation and human judgment is central to modern enterprise management.

We can help! Our analysts can customize this enterprise decision intelligence platforms market research report to meet your requirements.

Get in touch

1. Executive Summary

1.1 Market overview

Executive Summary - Chart on Market Overview
Executive Summary - Data Table on Market Overview
Executive Summary - Chart on Global Market Characteristics
Executive Summary - Chart on Market by Geography
Executive Summary - Chart on Market Segmentation by Component
Executive Summary - Chart on Market Segmentation by Deployment
Executive Summary - Chart on Market Segmentation by End-user
Executive Summary - Chart on Incremental Growth
Executive Summary - Data Table on Incremental Growth
Executive Summary - Chart on Company Market Positioning

2. Technavio Analysis

2.1 Analysis of price sensitivity, lifecycle, customer purchase basket, adoption rates, and purchase criteria

2.2 Criticality of inputs and Factors of differentiation

Chart on Overview on criticality of inputs and factors of differentiation

2.3 Factors of disruption

Chart on Overview on factors of disruption

2.4 Impact of drivers and challenges

Chart on Impact of drivers and challenges in 2025 and 2030

3. Market Landscape

3.1 Market ecosystem

Chart on Parent Market
Data Table on - Parent Market

3.2 Market characteristics

Chart on Market characteristics analysis

3.3 Value chain analysis

Chart on Value chain analysis

4. Market Sizing

4.1 Market definition

Data Table on Offerings of companies included in the market definition

4.2 Market segment analysis

Market segments

4.3 Market size 2025

4.4 Market outlook: Forecast for 2025-2030

Chart on Global - Market size and forecast 2025-2030 ($ million)
Data Table on Global - Market size and forecast 2025-2030 ($ million)
Chart on Global Market: Year-over-year growth 2025-2030 (%)
Data Table on Global Market: Year-over-year growth 2025-2030 (%)

5. Historic Market Size

5.1 Global Enterprise Decision Intelligence Platforms Market 2020 - 2024

Historic Market Size - Data Table on Global Enterprise Decision Intelligence Platforms Market 2020 - 2024 ($ million)

5.2 Component segment analysis 2020 - 2024

Historic Market Size - Component Segment 2020 - 2024 ($ million)

5.3 Deployment segment analysis 2020 - 2024

Historic Market Size - Deployment Segment 2020 - 2024 ($ million)

5.4 End-user segment analysis 2020 - 2024

Historic Market Size - End-user Segment 2020 - 2024 ($ million)

5.5 Geography segment analysis 2020 - 2024

Historic Market Size - Geography Segment 2020 - 2024 ($ million)

5.6 Country segment analysis 2020 - 2024

Historic Market Size - Country Segment 2020 - 2024 ($ million)

6. Qualitative Analysis

6.1 Impact of AI on Global Enterprise Decision Intelligence Platforms Market

6.2 Impact of geopolitical conflict on Global Enterprise Decision Intelligence Platforms Market

7. Five Forces Analysis

7.1 Five forces summary

Five forces analysis - Comparison between 2025 and 2030

7.2 Bargaining power of buyers

Bargaining power of buyers - Impact of key factors 2025 and 2030

7.3 Bargaining power of suppliers

Bargaining power of suppliers - Impact of key factors in 2025 and 2030

7.4 Threat of new entrants

Threat of new entrants - Impact of key factors in 2025 and 2030

7.5 Threat of substitutes

Threat of substitutes - Impact of key factors in 2025 and 2030

7.6 Threat of rivalry

Threat of rivalry - Impact of key factors in 2025 and 2030

7.7 Market condition

Chart on Market condition - Five forces 2025 and 2030

8. Market Segmentation by Component

8.1 Market segments

Chart on Component - Market share 2025-2030 (%)
Data Table on Component - Market share 2025-2030 (%)

8.2 Comparison by Component

Chart on Comparison by Component
Data Table on Comparison by Component

8.3 Solutions - Market size and forecast 2025-2030

Chart on Solutions - Market size and forecast 2025-2030 ($ million)
Data Table on Solutions - Market size and forecast 2025-2030 ($ million)
Chart on Solutions - Year-over-year growth 2025-2030 (%)
Data Table on Solutions - Year-over-year growth 2025-2030 (%)

8.4 Services - Market size and forecast 2025-2030

Chart on Services - Market size and forecast 2025-2030 ($ million)
Data Table on Services - Market size and forecast 2025-2030 ($ million)
Chart on Services - Year-over-year growth 2025-2030 (%)
Data Table on Services - Year-over-year growth 2025-2030 (%)

8.5 Market opportunity by Component

Market opportunity by Component ($ million)
Data Table on Market opportunity by Component ($ million)

9. Market Segmentation by Deployment

9.1 Market segments

Chart on Deployment - Market share 2025-2030 (%)
Data Table on Deployment - Market share 2025-2030 (%)

9.2 Comparison by Deployment

Chart on Comparison by Deployment
Data Table on Comparison by Deployment

9.3 On premises - Market size and forecast 2025-2030

Chart on On premises - Market size and forecast 2025-2030 ($ million)
Data Table on On premises - Market size and forecast 2025-2030 ($ million)
Chart on On premises - Year-over-year growth 2025-2030 (%)
Data Table on On premises - Year-over-year growth 2025-2030 (%)

9.4 Cloud based - Market size and forecast 2025-2030

Chart on Cloud based - Market size and forecast 2025-2030 ($ million)
Data Table on Cloud based - Market size and forecast 2025-2030 ($ million)
Chart on Cloud based - Year-over-year growth 2025-2030 (%)
Data Table on Cloud based - Year-over-year growth 2025-2030 (%)

9.5 Hybrid - Market size and forecast 2025-2030

Chart on Hybrid - Market size and forecast 2025-2030 ($ million)
Data Table on Hybrid - Market size and forecast 2025-2030 ($ million)
Chart on Hybrid - Year-over-year growth 2025-2030 (%)
Data Table on Hybrid - Year-over-year growth 2025-2030 (%)

9.6 Market opportunity by Deployment

Market opportunity by Deployment ($ million)
Data Table on Market opportunity by Deployment ($ million)

10. Market Segmentation by End-user

10.1 Market segments

Chart on End-user - Market share 2025-2030 (%)
Data Table on End-user - Market share 2025-2030 (%)

10.2 Comparison by End-user

Chart on Comparison by End-user
Data Table on Comparison by End-user

10.3 Large enterprises - Market size and forecast 2025-2030

Chart on Large enterprises - Market size and forecast 2025-2030 ($ million)
Data Table on Large enterprises - Market size and forecast 2025-2030 ($ million)
Chart on Large enterprises - Year-over-year growth 2025-2030 (%)
Data Table on Large enterprises - Year-over-year growth 2025-2030 (%)

10.4 SMEs - Market size and forecast 2025-2030

Chart on SMEs - Market size and forecast 2025-2030 ($ million)
Data Table on SMEs - Market size and forecast 2025-2030 ($ million)
Chart on SMEs - Year-over-year growth 2025-2030 (%)
Data Table on SMEs - Year-over-year growth 2025-2030 (%)

10.5 Market opportunity by End-user

Market opportunity by End-user ($ million)
Data Table on Market opportunity by End-user ($ million)

11. Customer Landscape

11.1 Customer landscape overview

Analysis of price sensitivity, lifecycle, customer purchase basket, adoption rates, and purchase criteria

12. Geographic Landscape

12.1 Geographic segmentation

Chart on Market share by geography 2025-2030 (%)
Data Table on Market share by geography 2025-2030 (%)

12.2 Geographic comparison

Chart on Geographic comparison
Data Table on Geographic comparison

12.3 North America - Market size and forecast 2025-2030

Chart on North America - Market size and forecast 2025-2030 ($ million)
Data Table on North America - Market size and forecast 2025-2030 ($ million)
Chart on North America - Year-over-year growth 2025-2030 (%)
Data Table on North America - Year-over-year growth 2025-2030 (%)
Chart on Regional Comparison - North America
Data Table on Regional Comparison - North America

12.3.1 US - Market size and forecast 2025-2030

Chart on US - Market size and forecast 2025-2030 ($ million)
Data Table on US - Market size and forecast 2025-2030 ($ million)
Chart on US - Year-over-year growth 2025-2030 (%)
Data Table on US - Year-over-year growth 2025-2030 (%)

12.3.2 Canada - Market size and forecast 2025-2030

Chart on Canada - Market size and forecast 2025-2030 ($ million)
Data Table on Canada - Market size and forecast 2025-2030 ($ million)
Chart on Canada - Year-over-year growth 2025-2030 (%)
Data Table on Canada - Year-over-year growth 2025-2030 (%)

12.3.3 Mexico - Market size and forecast 2025-2030

Chart on Mexico - Market size and forecast 2025-2030 ($ million)
Data Table on Mexico - Market size and forecast 2025-2030 ($ million)
Chart on Mexico - Year-over-year growth 2025-2030 (%)
Data Table on Mexico - Year-over-year growth 2025-2030 (%)

12.4 Europe - Market size and forecast 2025-2030

Chart on Europe - Market size and forecast 2025-2030 ($ million)
Data Table on Europe - Market size and forecast 2025-2030 ($ million)
Chart on Europe - Year-over-year growth 2025-2030 (%)
Data Table on Europe - Year-over-year growth 2025-2030 (%)
Chart on Regional Comparison - Europe
Data Table on Regional Comparison - Europe

12.4.1 Germany - Market size and forecast 2025-2030

Chart on Germany - Market size and forecast 2025-2030 ($ million)
Data Table on Germany - Market size and forecast 2025-2030 ($ million)
Chart on Germany - Year-over-year growth 2025-2030 (%)
Data Table on Germany - Year-over-year growth 2025-2030 (%)

12.4.2 UK - Market size and forecast 2025-2030

Chart on UK - Market size and forecast 2025-2030 ($ million)
Data Table on UK - Market size and forecast 2025-2030 ($ million)
Chart on UK - Year-over-year growth 2025-2030 (%)
Data Table on UK - Year-over-year growth 2025-2030 (%)

12.4.3 France - Market size and forecast 2025-2030

Chart on France - Market size and forecast 2025-2030 ($ million)
Data Table on France - Market size and forecast 2025-2030 ($ million)
Chart on France - Year-over-year growth 2025-2030 (%)
Data Table on France - Year-over-year growth 2025-2030 (%)

12.4.4 The Netherlands - Market size and forecast 2025-2030

Chart on The Netherlands - Market size and forecast 2025-2030 ($ million)
Data Table on The Netherlands - Market size and forecast 2025-2030 ($ million)
Chart on The Netherlands - Year-over-year growth 2025-2030 (%)
Data Table on The Netherlands - Year-over-year growth 2025-2030 (%)

12.4.5 Italy - Market size and forecast 2025-2030

Chart on Italy - Market size and forecast 2025-2030 ($ million)
Data Table on Italy - Market size and forecast 2025-2030 ($ million)
Chart on Italy - Year-over-year growth 2025-2030 (%)
Data Table on Italy - Year-over-year growth 2025-2030 (%)

12.4.6 Spain - Market size and forecast 2025-2030

Chart on Spain - Market size and forecast 2025-2030 ($ million)
Data Table on Spain - Market size and forecast 2025-2030 ($ million)
Chart on Spain - Year-over-year growth 2025-2030 (%)
Data Table on Spain - Year-over-year growth 2025-2030 (%)

12.5 APAC - Market size and forecast 2025-2030

Chart on APAC - Market size and forecast 2025-2030 ($ million)
Data Table on APAC - Market size and forecast 2025-2030 ($ million)
Chart on APAC - Year-over-year growth 2025-2030 (%)
Data Table on APAC - Year-over-year growth 2025-2030 (%)
Chart on Regional Comparison - APAC
Data Table on Regional Comparison - APAC

12.5.1 China - Market size and forecast 2025-2030

Chart on China - Market size and forecast 2025-2030 ($ million)
Data Table on China - Market size and forecast 2025-2030 ($ million)
Chart on China - Year-over-year growth 2025-2030 (%)
Data Table on China - Year-over-year growth 2025-2030 (%)

12.5.2 India - Market size and forecast 2025-2030

Chart on India - Market size and forecast 2025-2030 ($ million)
Data Table on India - Market size and forecast 2025-2030 ($ million)
Chart on India - Year-over-year growth 2025-2030 (%)
Data Table on India - Year-over-year growth 2025-2030 (%)

12.5.3 Japan - Market size and forecast 2025-2030

Chart on Japan - Market size and forecast 2025-2030 ($ million)
Data Table on Japan - Market size and forecast 2025-2030 ($ million)
Chart on Japan - Year-over-year growth 2025-2030 (%)
Data Table on Japan - Year-over-year growth 2025-2030 (%)

12.5.4 Australia - Market size and forecast 2025-2030

Chart on Australia - Market size and forecast 2025-2030 ($ million)
Data Table on Australia - Market size and forecast 2025-2030 ($ million)
Chart on Australia - Year-over-year growth 2025-2030 (%)
Data Table on Australia - Year-over-year growth 2025-2030 (%)

12.5.5 South Korea - Market size and forecast 2025-2030

Chart on South Korea - Market size and forecast 2025-2030 ($ million)
Data Table on South Korea - Market size and forecast 2025-2030 ($ million)
Chart on South Korea - Year-over-year growth 2025-2030 (%)
Data Table on South Korea - Year-over-year growth 2025-2030 (%)

12.5.6 Indonesia - Market size and forecast 2025-2030

Chart on Indonesia - Market size and forecast 2025-2030 ($ million)
Data Table on Indonesia - Market size and forecast 2025-2030 ($ million)
Chart on Indonesia - Year-over-year growth 2025-2030 (%)
Data Table on Indonesia - Year-over-year growth 2025-2030 (%)

12.6 South America - Market size and forecast 2025-2030

Chart on South America - Market size and forecast 2025-2030 ($ million)
Data Table on South America - Market size and forecast 2025-2030 ($ million)
Chart on South America - Year-over-year growth 2025-2030 (%)
Data Table on South America - Year-over-year growth 2025-2030 (%)
Chart on Regional Comparison - South America
Data Table on Regional Comparison - South America

12.6.1 Brazil - Market size and forecast 2025-2030

Chart on Brazil - Market size and forecast 2025-2030 ($ million)
Data Table on Brazil - Market size and forecast 2025-2030 ($ million)
Chart on Brazil - Year-over-year growth 2025-2030 (%)
Data Table on Brazil - Year-over-year growth 2025-2030 (%)

12.6.2 Argentina - Market size and forecast 2025-2030

Chart on Argentina - Market size and forecast 2025-2030 ($ million)
Data Table on Argentina - Market size and forecast 2025-2030 ($ million)
Chart on Argentina - Year-over-year growth 2025-2030 (%)
Data Table on Argentina - Year-over-year growth 2025-2030 (%)

12.6.3 Colombia - Market size and forecast 2025-2030

Chart on Colombia - Market size and forecast 2025-2030 ($ million)
Data Table on Colombia - Market size and forecast 2025-2030 ($ million)
Chart on Colombia - Year-over-year growth 2025-2030 (%)
Data Table on Colombia - Year-over-year growth 2025-2030 (%)

12.7 Middle East and Africa - Market size and forecast 2025-2030

Chart on Middle East and Africa - Market size and forecast 2025-2030 ($ million)
Data Table on Middle East and Africa - Market size and forecast 2025-2030 ($ million)
Chart on Middle East and Africa - Year-over-year growth 2025-2030 (%)
Data Table on Middle East and Africa - Year-over-year growth 2025-2030 (%)
Chart on Regional Comparison - Middle East and Africa
Data Table on Regional Comparison - Middle East and Africa

12.7.1 South Africa - Market size and forecast 2025-2030

Chart on South Africa - Market size and forecast 2025-2030 ($ million)
Data Table on South Africa - Market size and forecast 2025-2030 ($ million)
Chart on South Africa - Year-over-year growth 2025-2030 (%)
Data Table on South Africa - Year-over-year growth 2025-2030 (%)

12.7.2 Saudi Arabia - Market size and forecast 2025-2030

Chart on Saudi Arabia - Market size and forecast 2025-2030 ($ million)
Data Table on Saudi Arabia - Market size and forecast 2025-2030 ($ million)
Chart on Saudi Arabia - Year-over-year growth 2025-2030 (%)
Data Table on Saudi Arabia - Year-over-year growth 2025-2030 (%)

12.7.3 UAE - Market size and forecast 2025-2030

Chart on UAE - Market size and forecast 2025-2030 ($ million)
Data Table on UAE - Market size and forecast 2025-2030 ($ million)
Chart on UAE - Year-over-year growth 2025-2030 (%)
Data Table on UAE - Year-over-year growth 2025-2030 (%)

12.7.4 Israel - Market size and forecast 2025-2030

Chart on Israel - Market size and forecast 2025-2030 ($ million)
Data Table on Israel - Market size and forecast 2025-2030 ($ million)
Chart on Israel - Year-over-year growth 2025-2030 (%)
Data Table on Israel - Year-over-year growth 2025-2030 (%)

12.7.5 Turkey - Market size and forecast 2025-2030

Chart on Turkey - Market size and forecast 2025-2030 ($ million)
Data Table on Turkey - Market size and forecast 2025-2030 ($ million)
Chart on Turkey - Year-over-year growth 2025-2030 (%)
Data Table on Turkey - Year-over-year growth 2025-2030 (%)

12.8 Market opportunity by geography

Market opportunity by geography ($ million)
Data Tables on Market opportunity by geography ($ million)

13. Drivers, Challenges, and Opportunity

13.1 Market drivers

Convergence of causal AI and generative models
Escalating complexity of global supply chain dynamics
Proliferation of real-time edge computing and IoT data streams

13.2 Market challenges

Persistent data silos and architectural fragmentation
Critical shortage of multi-disciplinary talent and specialized skills
Ethical governance and demand for algorithmic transparency

13.3 Impact of drivers and challenges

Impact of drivers and challenges in 2025 and 2030

13.4 Market opportunities

Integration of affective computing in executive decision interfaces
Quantum-classic hybrid architectures for complex combinatorial optimization
Establishment of decentralized autonomous decision protocols

14. Competitive Landscape

14.1 Overview

14.2

Overview on criticality of inputs and factors of differentiation

14.3 Landscape disruption

Overview on factors of disruption

14.4 Industry risks

Impact of key risks on business

15. Competitive Analysis

15.1 Companies profiled

Companies covered

15.2 Company ranking index

15.3 Market positioning of companies

Matrix on companies position and classification

15.4 Aera Technology

Aera Technology - Overview
Aera Technology - Product / Service
Aera Technology - Key offerings
SWOT

15.5 Alteryx Inc.

Alteryx Inc. - Overview
Alteryx Inc. - Product / Service
Alteryx Inc. - Key offerings
SWOT

15.6 Amazon.com Inc.

Amazon.com Inc. - Overview
Amazon.com Inc. - Business segments
Amazon.com Inc. - Key news
Amazon.com Inc. - Key offerings
Amazon.com Inc. - Segment focus
SWOT

15.7 Databricks Inc.

Databricks Inc. - Overview
Databricks Inc. - Product / Service
Databricks Inc. - Key offerings
SWOT

15.8 DataRobot Inc.

DataRobot Inc. - Overview
DataRobot Inc. - Product / Service
DataRobot Inc. - Key offerings
SWOT

15.9 Google LLC

Google LLC - Overview
Google LLC - Product / Service
Google LLC - Key offerings
SWOT

15.10 IBM Corp.

IBM Corp. - Overview
IBM Corp. - Business segments
IBM Corp. - Key news
IBM Corp. - Key offerings
IBM Corp. - Segment focus
SWOT

15.11 Oracle Corp.

Oracle Corp. - Overview
Oracle Corp. - Business segments
Oracle Corp. - Key news
Oracle Corp. - Key offerings
Oracle Corp. - Segment focus
SWOT

15.12 Palantir Technologies Inc.

Palantir Technologies Inc. - Overview
Palantir Technologies Inc. - Product / Service
Palantir Technologies Inc. - Key offerings
SWOT

15.13 Pyramid Analytics BV

Pyramid Analytics BV - Overview
Pyramid Analytics BV - Product / Service
Pyramid Analytics BV - Key offerings
SWOT

15.14 QlikTech International AB

QlikTech International AB - Overview
QlikTech International AB - Product / Service
QlikTech International AB - Key offerings
SWOT

15.15 Salesforce Inc.

Salesforce Inc. - Overview
Salesforce Inc. - Product / Service
Salesforce Inc. - Key news
Salesforce Inc. - Key offerings
SWOT

15.16 SAP SE

SAP SE - Overview
SAP SE - Business segments
SAP SE - Key news
SAP SE - Key offerings
SAP SE - Segment focus
SWOT

15.17 SAS Institute Inc.

SAS Institute Inc. - Overview
SAS Institute Inc. - Product / Service
SAS Institute Inc. - Key offerings
SWOT

15.18 Snowflake Inc.

Snowflake Inc. - Overview
Snowflake Inc. - Product / Service
Snowflake Inc. - Key offerings
SWOT

16. Appendix

16.1 Scope of the report

Market definition
Objectives
Notes and caveats

16.2 Inclusions and exclusions checklist

Inclusions checklist
Exclusions checklist

16.3 Currency conversion rates for US$

16.4 Research methodology

16.5 Data procurement

Information sources

16.6 Data validation

16.7 Validation techniques employed for market sizing

16.8 Data synthesis

16.9 360 degree market analysis

16.10 List of abbreviations

Research Methodology

Technavio presents a detailed picture of the market by way of study, synthesis, and summation of data from multiple sources. The analysts have presented the various facets of the market with a particular focus on identifying the key industry influencers. The data thus presented is comprehensive, reliable, and the result of extensive research, both primary and secondary.

INFORMATION SOURCES

Primary sources

  • Manufacturers and suppliers
  • Channel partners
  • Industry experts
  • Strategic decision makers

Secondary sources

  • Industry journals and periodicals
  • Government data
  • Financial reports of key industry players
  • Historical data
  • Press releases

DATA ANALYSIS

Data Synthesis

  • Collation of data
  • Estimation of key figures
  • Analysis of derived insights

Data Validation

  • Triangulation with data models
  • Reference against proprietary databases
  • Corroboration with industry experts

REPORT WRITING

Qualitative

  • Market drivers
  • Market challenges
  • Market trends
  • Five forces analysis

Quantitative

  • Market size and forecast
  • Market segmentation
  • Geographical insights
  • Competitive landscape

Interested in this report?

Get your sample now to see our research methodology and insights!

Download Now

Frequently Asked Questions

Enterprise Decision Intelligence Platforms market growth will increase by USD 17837.3 million during 2026-2030.

The Enterprise Decision Intelligence Platforms market is expected to grow at a CAGR of 15.9% during 2026-2030.

Enterprise Decision Intelligence Platforms market is segmented by Component (Solutions, Services) Deployment (On premises, Cloud based, Hybrid) End-user (Large enterprises, SMEs)

Aera Technology, Alteryx Inc., Amazon.com Inc., Celonis SE, Databricks Inc., DataRobot Inc., Google LLC, IBM Corp., Oracle Corp., Palantir Technologies Inc., Pyramid Analytics BV, QlikTech International AB, Quantexa Ltd., Salesforce Inc., SAP SE, SAS Institute Inc., Snowflake Inc., Tellius Inc., Teradata Corp., ThoughtSpot Inc. are a few of the key vendors in the Enterprise Decision Intelligence Platforms market.

North America will register the highest growth rate of 31.2% among the other regions. Therefore, the Enterprise Decision Intelligence Platforms market in North America is expected to garner significant business opportunities for the vendors during the forecast period.

US, Canada, Mexico, Germany, UK, France, The Netherlands, Italy, Spain, China, India, Japan, Australia, South Korea, Indonesia, Brazil, Argentina, Colombia, South Africa, Saudi Arabia, UAE, Israel, Turkey

  • Convergence of causal AI and generative models is the driving factor this market.

The Enterprise Decision Intelligence Platforms market vendors should focus on grabbing business opportunities from the Component segment as it accounted for the largest market share in the base year.
RIA - Research AI Assistant
Ask RIA