Enterprise Location-Based Services Market Size 2024-2028
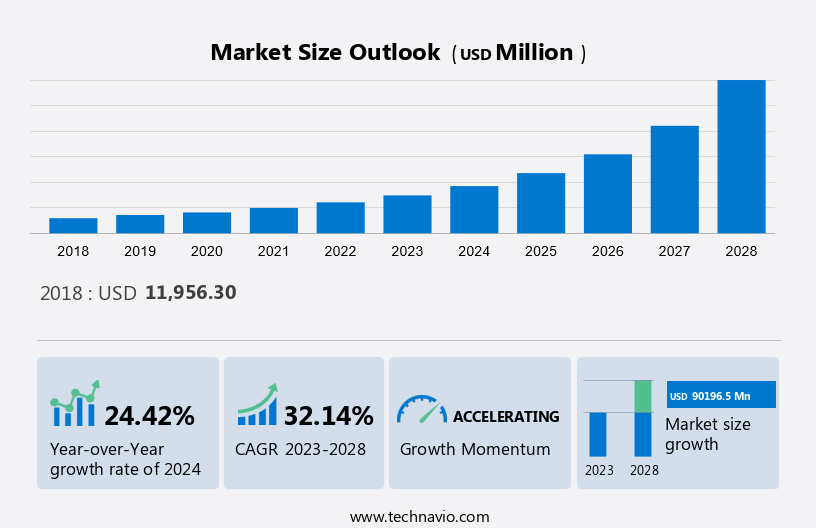
The Enterprise Location-Based Services Market size is forecast to increase by USD 90.20 billion, at a CAGR of 32.14% between 2023 and 2028. The market’s expansion is influenced by several key factors. A significant driver is the growing emphasis on proximity marketing, which leverages location-based strategies to engage consumers more effectively. Additionally, the widespread use of mobile computing devices, such as smartphones and tablets, plays a crucial role, as it provides a broad platform for these marketing techniques. Another important factor is the swift adoption of beacon technology. Beacons are small, wireless transmitters that use Bluetooth to send targeted messages to nearby devices, enhancing the proximity marketing experience. Together, these elements contribute to a dynamic market environment, where businesses can harness technological advancements to reach their audiences with greater precision and efficiency. The synergy of these factors not only fosters market growth but also opens new opportunities for innovative marketing strategies and customer engagement.
What will be the size of the Market During the Forecast Period?
To learn more about this report, View Report Sample
Market Overview
The market is rapidly evolving, driven by advancements in geospatial analytics technology and Real Time Location Systems market. Companies are increasingly leveraging LBS and RTLS to enhance route planning for their fleet of vehicles, ensuring timely deliveries and optimizing operations. Geographic Information Systems (GIS) play a crucial role in integrating location based search and advertising, location based navigation, and location based infotainment and analytics. Retailer is utilizing these technologies to offer targeted promotional offers and improve customer experiences within their store. The rise of smart city projects also highlights the importance of location based tracking and Wi Fi connectivity in IT environments. As the mobile services market continues to expand, businesses are increasingly incorporating location-based tracking and analytics into their strategies to gain competitive advantages and meet evolving consumer expectations.
Key Market Driver
One of the key factors driving the enterprise LBS market growth is the increasing focus on proximity marketing. The proximity marketing strategy is widely used by different enterprises such as retail stores, hotels, and entertainment parks, to improve consumer engagement and build brand equity to strengthen customer loyalty. By leveraging proximity marketing, marketers can connect with consumers through their mobile devices.
Moreover, some of the factors that these enterprises include while sending personalized messages include user preference and prior purchase history, geographic location of consumers, and time of day. The main advantage of proximity marketing is that retailers can deliver just-in-time communication to the target audience by analyzing the purchasing behavior of the consumer. Thus, there is targeted advertising using advanced technologies, including radio frequency identification (RFID), beacon, and Wi-Fi. Hence, such factors are expected to drive market growth during the forecast period.
Significant Market Trends
A key factor shaping the enterprise LBS market growth is the use of analytics for business process optimization. The main advantage of analysis software is that it enables measuring the time spent at a location and the routes that are taken often. It has become possible to integrate analysis software with existing enterprise LBS solutions. Thus, this software allows easy evaluation of and processing of the available information.
In addition, there is an increasing adoption of analysis software in the retail sector as it is utilized for determining the number of people passing through a particular spot during the day and thereby facilitating product placement. Additionally, the main application of analysis software in the industrial sector is to monitor the movement of objects including work equipment, goods, or products and thereby determining the most efficient layout of the plant and implementing lean manufacturing tools and processes, such as just-in-time. Hence, such factors are expected to drive market growth during the forecast period.
Major Market Restrain
Privacy and security concerns are one of the key challenges hindering the enterprise LBS market growth during the forecast period. Even though the advancement in technology offers several benefits, it has an inherent risk of information security associated with it. Due to the new development in technology, enterprise LBS is prone to serious security issues, risks, and threats.
Additionally, these systems have data reconciliation and interoperability issues as they communicate with a large set of diverse systems across an organization. As a result, it leads to security gaps and ambiguities, which may be misused by hackers and other cybercriminals. Hence, such factors are expected to hinder market growth during the forecast period.
Market Segmentation
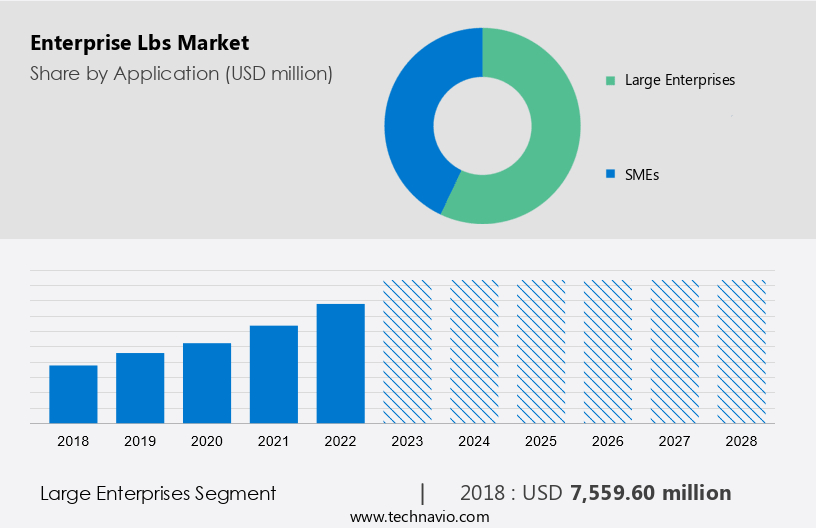
By Application
The large enterprises segment is estimated to witness significant growth during the forecast period. There is increasing adoption of enterprise LBS in large enterprise segments as it is extensively used for various applications such as navigation and real-time monitoring, location-based advertising and asset tracking, mobile city guides, vehicle theft detection, visual analytics, fleet management and public transportation systems, and other purposes. As a result, enterprises are able to adopt a more personalized approach to clients by leveraging in-depth consumer data.
Get a glance at the market contribution of various segments View Free PDF Sample
The large enterprises segment was the largest segment and was valued at USD 7.56 billion in 2018. Additionally, the solution is used to monitor when an object or a person is entering or leaving a particular area. Large enterprises comprise manufacturing plants or data centers. By attaching receivers in fixed places and tag in mobile assets the location of an object or person is time-stamped as they move through different receiver fields. Therefore, this solution offers the detection of the location as well as the direction of the object or person at a particular point in time. Hence, such factors are expected to fuel the growth of this segment which in turn will drive the market growth during the forecast period.
Regional Overview
For more insights on the market share of various regions Download PDF Sample now!
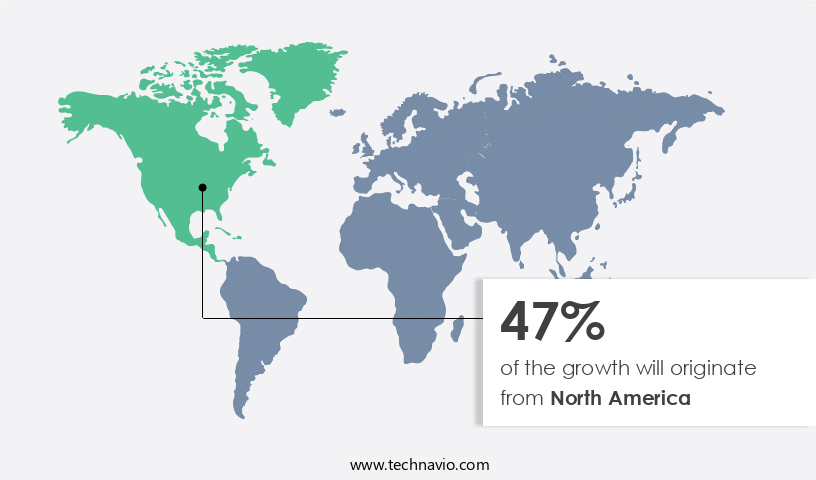
North America is estimated to contribute 47% to the growth of the global market during the forecast period. Technavio’s analysts have elaborately explained the regional trends and drivers that shape the market during the forecast period. There is increasing adoption of innovative technologies due to the ongoing digital transformation across different industry verticals in order to gain strategic and operational advantages. As North America is a mature market in technology, there is a high level of adoption of enterprise LBS in North America across several business and industrial processes to ensure operational streamlining and business process optimization.
Additionally, the emergence of Industry 4.0 in the region has made enterprise LBS indispensable. The main advantage of adopting LBS across enterprises is that it can monitor workers and assets and the data can be used for resource optimization. Furthermore, enterprise LBS will also enable the interconnection of industrial production with modern information and communication technology (ICT) and assist buyers including large and small enterprises gain a competitive advantage in the market. Hence, such factors are expected to drive market growth in the region during the forecast period.
Market Customer Landscape
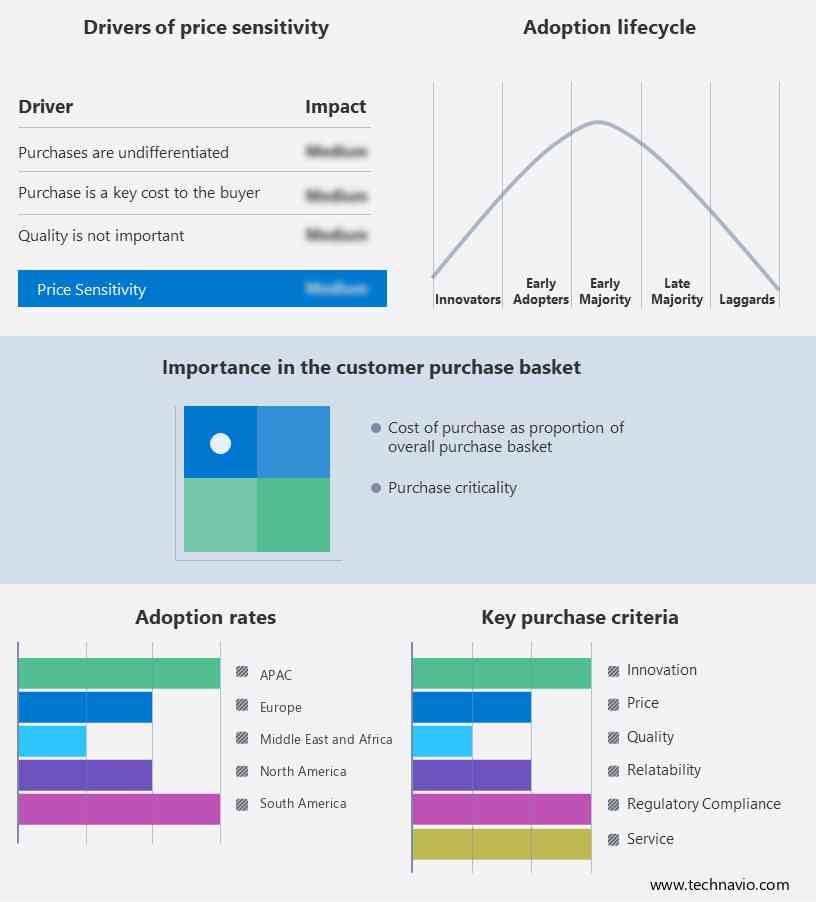
The enterprise LBS market industry report includes the adoption lifecycle of the market, covering from the innovator’s stage to the laggard’s stage. It focuses on adoption rates in different regions based on penetration. Furthermore, the report also includes key purchase criteria and drivers of price sensitivity to help companies evaluate and develop their growth strategies.
Market Customer Landscape
Who are the Major Market Companies?
Companies are implementing various strategies, such as strategic alliances, partnerships, mergers and acquisitions, geographical expansion, and product/service launches, to enhance their presence in the market.
- AiRISTA Flow Inc: The company offers enterprise LBS such as Sofia Software Platform.
- Aislelabs Inc: The company offers enterprise LBS such as Aislelabs Flow.
- Broadcom Inc: The company offers enterprise LBS such as Broadcom BCM47765 dual-frequency GNSS receiver.
The research report also includes detailed analyses of the competitive landscape of the market and information about 20 market companies, including:
- Cisco Systems Inc.
- Comtech
- Esri Global Inc.
- Foursquare Labs Inc.
- HERE Global BV
- HID Global Corp.
- infsoft GmbH
- Juniper Networks Inc.
- NextNav Inc.
- Polaris Wireless
- POLE STAR SA
- Qualcomm Inc.
- Securitas AB
- Siemens AG
- xAd Inc.
- Zebra Technologies Corp.
- Ziff Davis Inc.
Qualitative and quantitative analysis of companies has been conducted to help clients understand the wider business environment as well as the strengths and weaknesses of key market players. Data is qualitatively analyzed to categorize companies as pure play, category-focused, industry-focused, and diversified; it is quantitatively analyzed to categorize companies as dominant, leading, strong, tentative, and weak.
Segment Overview
The market research report provides comprehensive data (region wise segment analysis), with forecasts and estimates in "USD Billion" for the period 2024 to 2028, as well as historical data from 2018 to 2022 for the following segments.
- Application Outlook
- Large enterprises
- SMEs
- Component Outlook
- Hardware
- Software
- Services
- Geography Outlook
- North America
- The U.S.
- Canada
- Europe
- U.K.
- Germany
- France
- Rest of Europe
- APAC
- China
- India
- South America
- Chile
- Argentina
- Brazil
- Middle East & Africa
- Saudi Arabia
- South Africa
- Rest of the Middle East & Africa
- North America
You may also interested in below market reports:
- US Enterprise Indoor Location-based Services Market by Technology, and Component - Forecast and Analysis
- Location-Based Services (LBS) Market by Component, Type and Geography - Forecast and Analysis
- Location-based Services (LBS) in the Healthcare Sector Market Analysis North America, Europe, APAC, South America, Middle East and Africa - US, China, Japan, Germany, UK - Size and Forecast
Market Analyst Overview
The market is a rapidly evolving industry that leverages spatial data and analytical tools to enhance business operations. This market encompasses location-based apps, geo marketing, and Real-Time Location Systems (RTLS) technologies such as Ultra-Wideband (UWB), Radio Frequency Identification (RFID), Wi-Fi, and Bluetooth Low Energy (BLE). UWB technology plays a significant role in this market, offering accurate positioning data for indoor operations. UWB-enabled systems, when combined with RTLS technologies, provide high precision and low interference, making them ideal for government certifications and infrastructure alterations. Deployment solutions for UWB and BLE technologies are gaining popularity due to their ability to offer indoor proximity services. These services segment includes platform installation, professional services, site inspection, and indoor positioning systems. 5G networks are expected to further propel the growth of the Enterprise LBS market, as they offer faster data transfer rates and lower latency, enabling real-time location-based services.
Further, the market also includes outdoor positioning solutions such as GPS, satellites, stylized mapping, and navigation services. These solutions operate on various frequency bands, including Global Navigation Satellite Systems (GNSS) and cellular networks. The market for Enterprise LBS is expected to grow significantly due to the increasing demand for high accuracy and precision in indoor operations. However, challenges such as battery life and interference remain key concerns for stakeholders in this market. In conclusion, the Enterprise LBS market is poised for growth, driven by the adoption of advanced technologies such as UWB, RTLS, and 5G networks. The market offers various deployment solutions, including indoor and outdoor positioning systems, geo marketing, and analytics tools, to cater to the diverse needs of businesses.
|
Market Scope |
|
|
Report Coverage |
Details |
|
Page number |
166 |
|
Base year |
2023 |
|
Historic period |
2018 - 2022 |
|
Forecast period |
2024-2028 |
|
Growth momentum & CAGR |
Accelerate at a CAGR of 32.14% |
|
Market growth 2024-2028 |
USD 90.20 billion |
|
Market structure |
Fragmented |
|
YoY growth 2023-2024(%) |
24.42 |
|
Regional analysis |
North America, Europe, APAC, South America, and Middle East and Africa |
|
Performing market contribution |
North America at 47% |
|
Key countries |
US, China, Germany, UK, and Japan |
|
Competitive landscape |
Leading Companies, Market Positioning of Companies, Competitive Strategies, and Industry Risks |
|
Key companies profiled |
AiRISTA Flow Inc., Aislelabs Inc., Broadcom Inc., Cisco Systems Inc., Comtech, Esri Global Inc., Foursquare Labs Inc., HERE Global BV, HID Global Corp., infsoft GmbH, Juniper Networks Inc., NextNav Inc., Polaris Wireless, POLE STAR SA, Qualcomm Inc., Securitas AB, Siemens AG, xAd Inc., Zebra Technologies Corp., and Ziff Davis Inc. |
|
Market dynamics |
Parent market analysis, Market growth inducers and obstacles, Fast-growing and slow-growing segment analysis, Market growth and Forecasting, COVID 19 impact and recovery analysis and future consumer dynamics, Market condition analysis for forecast period |
|
Customization purview |
If our market report has not included the data that you are looking for, you can reach out to our analysts and get segments customized. |
What are the Key Data Covered in this Market Forecasting Report?
- CAGR of the market during the forecast period
- Detailed information on factors that will drive the market forecast report of the market between 2024 and 2028
- Precise estimation of the market size and its contribution to the parent market
- Accurate predictions about upcoming market trends and analysis and changes in consumer behavior
- Growth of the market across Europe, North America, APAC, South America, and Middle East and Africa
- Thorough market growth analysis of the market’s competitive landscape and detailed information about companies
- Comprehensive market analysis and report on the factors that will challenge the market research and growth of market companies
We can help! Our analysts can customize this market research report to meet your requirements.
 RIA -
RIA - 
