Environmental Catalyst Market Analysis - US, China, India, Germany, UK - Size and Forecast 2025-2029

Environmental Catalyst Market Analysis - US, China, India, Germany, UK - Size and Forecast 2025-2029

Published: Feb 2025 231 Pages SKU: IRTNTR77219

Market Overview at a Glance

$3.02 B
Market Opportunity
4.6%
CAGR
4.4
YoY growth 2024-2025(%)

Environmental Catalyst Market Size 2025-2029

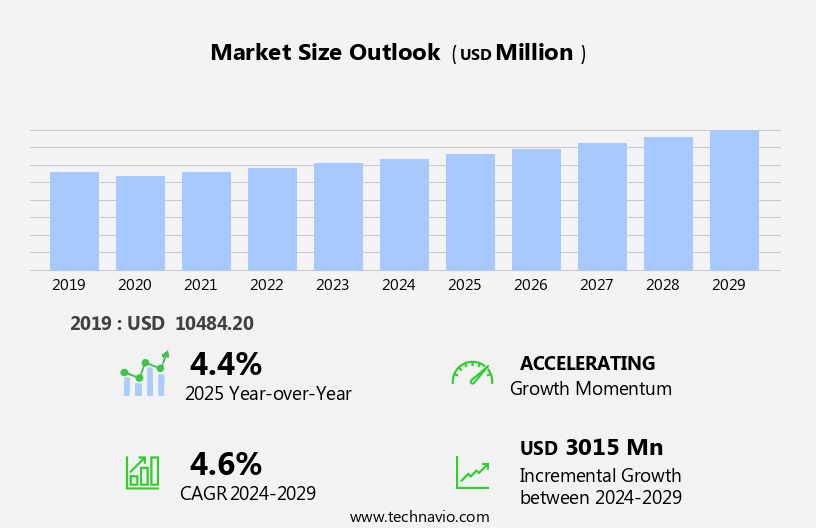
The environmental catalyst market size is forecast to increase by USD 3.02 billion at a CAGR of 4.6% between 2024 and 2029.

  • The market is experiencing significant growth driven by stringent environmental regulations aimed at reducing emissions and improving air quality. These regulations, particularly in the transportation and energy sectors, are increasing the demand for environmental catalysts. Furthermore, the adoption of these catalysts in renewable energy applications, such as fuel cells and solar photovoltaics, is expanding the market's reach. However, the market's growth is not without challenges. The volatility in raw materials prices, such as palladium and platinum, used in the production of environmental catalysts poses a significant risk to market stability. Companies seeking to capitalize on this market opportunity must closely monitor raw material prices and explore alternative catalyst technologies or sourcing strategies.
  • Additionally, investing in research and development to improve catalyst efficiency and reduce production costs can help companies stay competitive in this dynamic market. Overall, the market presents a compelling growth opportunity for companies committed to sustainable technologies and innovative solutions.

What will be the Size of the Environmental Catalyst Market during the forecast period?

Environmental Catalyst Market Size

 Request Free Sample

  • The market encompasses a range of technologies and applications aimed at reducing emissions and mitigating climate change. Key market drivers include the growing demand for green chemistry in various industries, the shift towards alternative fuels, and the increasing focus on emission reduction and air pollution control. Catalytic converter technology, diesel oxidation catalysts, catalytic combustion, and catalytic oxidation are among the key catalyst technologies driving this market. The market is also influenced by the circular economy and the increasing importance of municipal waste management, emission monitoring, and the reduction of fixed source pollutants. The adoption of clean technology, such as hydrogen fuel cells and renewable energy sources, is also contributing to the growth of the market.
  • Moreover, the market is being shaped by the global push for climate change mitigation, energy efficiency, and the widespread adoption of zero-emission vehicles. Industrial emissions, particularly from gas engines and industrial processes, are a significant focus area for emission reduction and pollution control initiatives. Environmental sustainability, sustainable manufacturing, and environmental engineering are also key areas of application for environmental catalysts. The market is further influenced by stringent environmental regulations and the growing importance of clean air initiatives. Overall, the market is expected to continue growing as the world transitions towards a more sustainable and low-carbon economy.

How is this Environmental Catalyst Industry segmented?

The environmental catalyst industry research report provides comprehensive data (region-wise segment analysis), with forecasts and estimates in "USD million" for the period 2025-2029, as well as historical data from 2019-2023 for the following segments.

  • Application
    • Automotive
    • Manufacturing industries
    • Others
  • Type
    • CO oxidation catalysts
    • Selective catalytic reduction catalysts (SCRC)
    • VOC oxidation catalysts
    • Others
  • Product Type
    • Precious metals
    • Mixed metal oxides
    • Base metals
  • Geography
    • APAC
      • China
      • India
      • Japan
      • South Korea
    • North America
      • US
      • Canada
    • Europe
      • France
      • Germany
      • Italy
      • UK
    • South America
      • Middle East and Africa

      By Application Insights

      The automotive segment is estimated to witness significant growth during the forecast period.

      The automotive industry is a significant application sector for environmental catalysts, playing a vital role in reducing vehicular emissions and improving air quality. Catalytic converters, a key automotive component, utilize environmental catalysts to convert harmful pollutants into less harmful substances. As governments intensify efforts to address air pollution, the automotive sector faces increasing pressure to integrate efficient catalytic solutions. Regulatory bodies, such as the Euro 6 standards in Europe and CAFE standards in the US, mandate the use of advanced catalytic converters in vehicles. The continuous evolution of these standards necessitates ongoing innovation in environmental catalysts to meet or exceed regulatory requirements.

      This includes the development of selective catalytic reduction systems for diesel engines, gasoline particulate filters, and diesel particulate filters for reducing nitrous oxide emissions, volatile organic compounds, and carbon monoxide. Additionally, emission control technologies, such as nanoparticle technology and filter management devices, are gaining popularity for their effectiveness in reducing harmful emissions from both mobile and stationary sources. The focus on environmental compliance and consumer preferences for cleaner air is driving the demand for advanced emission control systems in various industries, including power generation and cement production.

      Environmental Catalyst Market Size

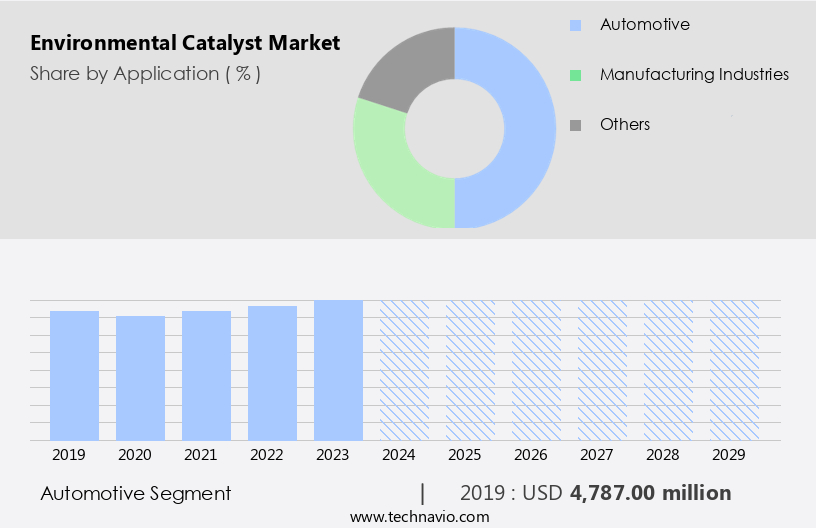
      Get a glance at the market report of share of various segments Request Free Sample

      The Automotive segment was valued at USD 4.79 billion in 2019 and showed a gradual increase during the forecast period.

      Regional Analysis

      APAC is estimated to contribute 37% to the growth of the global market during the forecast period.Technavio’s analysts have elaborately explained the regional trends and drivers that shape the market during the forecast period.

      Environmental Catalyst Market Share by Geography

      For more insights on the market size of various regions, Request Free Sample

      The market in the Asia Pacific (APAC) region is experiencing notable growth due to industrial expansion, economic growth, and stricter environmental regulations. With APAC being the world's manufacturing hub, countries like China and India contribute significantly to industrial output, leading to a high demand for environmental catalysts. Industries in the region, including automotive, power generation, and manufacturing, are under pressure to comply with stringent emission standards. In China, rapid industrialization and increasing concerns about air quality have led to the implementation of rigorous environmental regulations. These regulations are driving the adoption of environmental catalysts to reduce harmful emissions from industries and mobile sources.

      The automotive sector, in particular, is undergoing a transition towards emission control technologies such as selective catalytic reduction, diesel particulate filters, and gasoline particulate filters. Environmental catalysts play a crucial role in reducing emissions of nitrous oxides, volatile organic compounds, carbon monoxide, and other harmful pollutants from industrial processes and mobile sources. Catalytic converters, made from catalyst materials like metal oxides, are essential components of emission control systems in diesel and gasoline engines. The adoption of hybrid vehicles and electric vehicles is also expected to increase the demand for environmental catalysts in the automotive sector. Government bodies and regulatory agencies are playing a significant role in enforcing emission standards for both mobile and stationary sources.

      For instance, the US Environmental Protection Agency (EPA) sets air quality standards for mobile sources, while the US Occupational Safety and Health Administration (OSHA) regulates industrial emissions. Compliance with these regulations is essential for businesses to avoid penalties and maintain a good reputation. In , the market in the APAC region is poised for growth due to increasing industrialization, economic expansion, and stricter environmental regulations. The adoption of emission control technologies and the transition towards cleaner energy sources are expected to further fuel market growth. Companies in the environmental catalyst industry are well-positioned to capitalize on these trends and contribute to the reduction of harmful emissions and improvement of air quality.

      Market Dynamics

      Our researchers analyzed the data with 2024 as the base year, along with the key drivers, trends, and challenges. A holistic analysis of drivers will help companies refine their marketing strategies to gain a competitive advantage.

      What are the key market drivers leading to the rise in the adoption of Environmental Catalyst Industry?

      • Stringent environmental regulations related to emission standards is the key driver of the market. 
        • The market is significantly influenced by stringent regulations aimed at reducing industrial pollution. Governments worldwide are enforcing rules to limit emissions, particularly in the automotive sector. For instance, Euro 6 in Europe and CAFE standards in the US set strict pollutant limits, necessitating the use of advanced catalytic converters by automobile manufacturers. These regulations serve as catalysts, driving industries to invest in emission control solutions and increasing the demand for environmental catalysts.
        • The need for sustainable industrial processes and the growing awareness of environmental issues further boost market growth. Companies are focusing on research and development to introduce innovative technologies that meet regulatory requirements while minimizing environmental impact.

      What are the market trends shaping the Environmental Catalyst Industry?

      • Increasing adoption of environmental catalysts in renewable energy applications is the upcoming market trend. 
        • Environmental catalysts are pivotal in driving the advancement of renewable energy technologies, facilitating the shift towards cleaner energy sources. One significant application of environmental catalysts is in the production of hydrogen via water electrolysis. These catalysts, typically made from precious metals like platinum or alternative non-precious metals such as nickel and iron, boost the efficiency of the process by enhancing the splitting of water into hydrogen and oxygen.
        • In the realm of fuel cells, environmental catalysts assume growing importance. They are indispensable in fuel cells, enabling the electrochemical reaction between hydrogen and oxygen, resulting in electricity generation and water as byproducts.

      What challenges does the Environmental Catalyst Industry face during its growth?

      • Volatility in raw materials prices used in environmental catalysts is a key challenge affecting the industry growth. 
        • The market encounters a notable challenge due to the reliance on scarce and costly materials, particularly platinum. This precious metal, known for its exceptional catalytic properties, is essential for various catalytic applications, such as automotive catalytic converters and fuel cells. Platinum's scarcity and high market value significantly impact the cost of catalyst production. Recent market forecasts indicate that the price of platinum is projected to reach USD1,100 by mid-2024, with further increases anticipated, reaching USD1,500 by the end of 2025.
        • This trend poses a significant challenge for market growth and underscores the need for alternative catalyst solutions or more efficient use of platinum resources.

      Exclusive Customer Landscape

      The environmental catalyst market forecasting report includes the adoption lifecycle of the market, covering from the innovator’s stage to the laggard’s stage. It focuses on adoption rates in different regions based on penetration. Furthermore, the environmental catalyst market report also includes key purchase criteria and drivers of price sensitivity to help companies evaluate and develop their market growth analysis strategies.

      Environmental Catalyst Market Share by Geography

       Customer Landscape

      Key Companies & Market Insights

      Companies are implementing various strategies, such as strategic alliances, environmental catalyst market forecast, partnerships, mergers and acquisitions, geographical expansion, and product/service launches, to enhance their presence in the industry.

      Albemarle Corp. - The company's innovative catalyst solutions, including AlkyStar, enable the production of premium alkylates for clean fuels without relying on liquid acid catalysts in the manufacturing process. This approach enhances search engine visibility, ensuring a clear and informative message for research analysts. By utilizing advanced catalyst technology, the company delivers high-quality alkylates as a blending component, maintaining alignment with our commitment to environmental sustainability and product excellence.

      The industry research and growth report includes detailed analyses of the competitive landscape of the market and information about key companies, including:

      • Albemarle Corp.
      • Axens Group
      • Babcock Power Inc.
      • BASF SE
      • Catalytic Combustion Corp.
      • China Petrochemical Corp.
      • China Petrochemical Corp.
      • Clariant International Ltd.
      • CORMETECH Inc.
      • Evonik Industries AG
      • Exxon Mobil Corp.
      • Heraeus Holding GmbH
      • Honeywell International Inc.
      • Johnson Matthey Plc
      • OMV Aktiengesellschaft
      • Topsoes AS
      • Treibacher Industrie AG
      • Umicore SA

      Qualitative and quantitative analysis of companies has been conducted to help clients understand the wider business environment as well as the strengths and weaknesses of key industry players. Data is qualitatively analyzed to categorize companies as pure play, category-focused, industry-focused, and diversified; it is quantitatively analyzed to categorize companies as dominant, leading, strong, tentative, and weak.

      Research Analyst Overview

      The market encompasses a broad range of applications aimed at reducing harmful emissions from various industrial processes and mobile sources. These catalysts play a crucial role in mitigating the environmental impact of industries such as chemical production, cement manufacturing, and power generation. Chemical processes, including the production of nitrous oxides in calcination plants and the separation of light fractions in FCC units, generate significant volumes of pollutants. Catalytic technologies are employed to minimize these emissions, ensuring regulatory compliance and contributing to improved air quality. Industrial waste streams, particularly those containing volatile organic compounds (VOCs), can also be addressed through the use of catalytic conversion systems.

      These technologies convert VOCs into less harmful by-products, contributing to overall emission reduction and improved environmental performance. In the automotive sector, the focus on emission control has intensified in recent years, driven by increasingly stringent air quality standards. Selective catalytic reduction (SCR) systems and catalytic converters, including diesel particulate filters and gasoline particulate filters, are widely used to reduce carbon monoxide, nitrogen oxides, and particulate matter emissions from diesel and gasoline engines. Hybrid vehicles, which combine an internal combustion engine with an electric motor, offer another avenue for emission reduction. Catalytic converters play a critical role in managing the exhaust gases from the internal combustion engine, ensuring that emissions meet stringent automotive standards.

      Regulatory bodies continue to play a significant role in driving the adoption of emission control technologies. In the power generation sector, the shift towards renewable electricity sources is reducing the reliance on fossil fuels and, in turn, decreasing associated emissions. However, the continued operation of stationary diesel engines necessitates the use of advanced emission control systems to minimize their impact on air quality. The development of nanoparticle technology has opened up new opportunities for emission control, particularly in the area of catalytic converters. These advanced materials offer enhanced catalytic activity and durability, contributing to more effective emission reduction and longer filter life.

      Environmental concerns related to industrial processes and mobile sources continue to grow, with consumers increasingly demanding action to address these issues. Emission control technologies, including catalytic converters and filter management devices, are essential tools in the fight against air pollution and the drive towards sustainable production and transportation. In summary, the market is a dynamic and evolving landscape, driven by the need to address environmental issues associated with industrial processes and mobile sources. Catalytic technologies, including selective catalytic reduction, catalytic converters, and filter management devices, play a crucial role in minimizing harmful emissions and ensuring regulatory compliance.

      The ongoing development of advanced materials and technologies will continue to drive innovation and improve the overall environmental performance of various industries.

      Market Scope

      Report Coverage

      Details

      Page number

      231

      Base year

      2024

      Historic period

      2019-2023

      Forecast period

      2025-2029

      Growth momentum & CAGR

      Accelerate at a CAGR of 4.6%

      Market growth 2025-2029

      USD 3015 million

      Market structure

      Fragmented

      YoY growth 2024-2025(%)

      4.4

      Key countries

      US, China, India, Japan, Canada, UK, South Korea, Germany, France, and Italy

      Competitive landscape

      Leading Companies, Market Positioning of Companies, Competitive Strategies, and Industry Risks

      Request Free Sample

      What are the Key Data Covered in this Environmental Catalyst Market Research and Growth Report?

      • CAGR of the Environmental Catalyst industry during the forecast period
      • Detailed information on factors that will drive the growth and forecasting between 2025 and 2029
      • Precise estimation of the size of the market and its contribution of the industry in focus to the parent market
      • Accurate predictions about upcoming growth and trends and changes in consumer behaviour
      • Growth of the market across APAC, North America, Europe, South America, and Middle East and Africa
      • Thorough analysis of the market’s competitive landscape and detailed information about companies
      • Comprehensive analysis of factors that will challenge the environmental catalyst market growth of industry companies

      We can help! Our analysts can customize this environmental catalyst market research report to meet your requirements.

      Get in touch


      1 Executive Summary

      • 1.1 Market overview
        • Executive Summary - Chart on Market Overview
        • Executive Summary - Data Table on Market Overview
        • Executive Summary - Chart on Global Market Characteristics
        • Executive Summary - Chart on Market by Geography
        • Executive Summary - Chart on Market Segmentation by Application
        • Executive Summary - Chart on Market Segmentation by Type
        • Executive Summary - Chart on Market Segmentation by Product Type
        • Executive Summary - Chart on Incremental Growth
        • Executive Summary - Data Table on Incremental Growth
        • Executive Summary - Chart on Company Market Positioning

      2 Technavio Analysis

      • 2.1 Analysis of price sensitivity, lifecycle, customer purchase basket, adoption rates, and purchase criteria
        • Analysis of price sensitivity, lifecycle, customer purchase basket, adoption rates, and purchase criteria
      • 2.2 Criticality of inputs and Factors of differentiation
        • Overview on criticality of inputs and factors of differentiation
      • 2.3 Factors of disruption
        • Overview on factors of disruption
      • 2.4 Impact of drivers and challenges
        • Impact of drivers and challenges in 2024 and 2029

      3 Market Landscape

      • 3.1 Market ecosystem
        • Parent Market
        • Data Table on - Parent Market
      • 3.2 Market characteristics
        • Market characteristics analysis
      • 3.3 Value chain analysis
        • Value chain analysis

      4 Market Sizing

      • 4.1 Market definition
        • Offerings of companies included in the market definition
      • 4.2 Market segment analysis
        • Market segments
      • 4.3 Market size 2024
        • 4.4 Market outlook: Forecast for 2024-2029
          • Chart on Global - Market size and forecast 2024-2029 ($ million)
          • Data Table on Global - Market size and forecast 2024-2029 ($ million)
          • Chart on Global Market: Year-over-year growth 2024-2029 (%)
          • Data Table on Global Market: Year-over-year growth 2024-2029 (%)

        5 Historic Market Size

        • 5.1 Global Environmental Catalyst Market 2019 - 2023
          • Historic Market Size - Data Table on Global Environmental Catalyst Market 2019 - 2023 ($ million)
        • 5.2 Application segment analysis 2019 - 2023
          • Historic Market Size - Application Segment 2019 - 2023 ($ million)
        • 5.3 Type segment analysis 2019 - 2023
          • Historic Market Size - Type Segment 2019 - 2023 ($ million)
        • 5.4 Product Type segment analysis 2019 - 2023
          • Historic Market Size - Product Type Segment 2019 - 2023 ($ million)
        • 5.5 Geography segment analysis 2019 - 2023
          • Historic Market Size - Geography Segment 2019 - 2023 ($ million)
        • 5.6 Country segment analysis 2019 - 2023
          • Historic Market Size - Country Segment 2019 - 2023 ($ million)

        6 Qualitative Analysis

        • 6.1 Impact of AI on Global Environmental Catalyst Market

          7 Five Forces Analysis

          • 7.1 Five forces summary
            • Five forces analysis - Comparison between 2024 and 2029
          • 7.2 Bargaining power of buyers
            • Bargaining power of buyers - Impact of key factors 2024 and 2029
          • 7.3 Bargaining power of suppliers
            • Bargaining power of suppliers - Impact of key factors in 2024 and 2029
          • 7.4 Threat of new entrants
            • Threat of new entrants - Impact of key factors in 2024 and 2029
          • 7.5 Threat of substitutes
            • Threat of substitutes - Impact of key factors in 2024 and 2029
          • 7.6 Threat of rivalry
            • Threat of rivalry - Impact of key factors in 2024 and 2029
          • 7.7 Market condition
            • Chart on Market condition - Five forces 2024 and 2029

          8 Market Segmentation by Application

          • 8.1 Market segments
            • Chart on Application - Market share 2024-2029 (%)
            • Data Table on Application - Market share 2024-2029 (%)
          • 8.2 Comparison by Application
            • Chart on Comparison by Application
            • Data Table on Comparison by Application
          • 8.3 Automotive - Market size and forecast 2024-2029
            • Chart on Automotive - Market size and forecast 2024-2029 ($ million)
            • Data Table on Automotive - Market size and forecast 2024-2029 ($ million)
            • Chart on Automotive - Year-over-year growth 2024-2029 (%)
            • Data Table on Automotive - Year-over-year growth 2024-2029 (%)
          • 8.4 Manufacturing industries - Market size and forecast 2024-2029
            • Chart on Manufacturing industries - Market size and forecast 2024-2029 ($ million)
            • Data Table on Manufacturing industries - Market size and forecast 2024-2029 ($ million)
            • Chart on Manufacturing industries - Year-over-year growth 2024-2029 (%)
            • Data Table on Manufacturing industries - Year-over-year growth 2024-2029 (%)
          • 8.5 Others - Market size and forecast 2024-2029
            • Chart on Others - Market size and forecast 2024-2029 ($ million)
            • Data Table on Others - Market size and forecast 2024-2029 ($ million)
            • Chart on Others - Year-over-year growth 2024-2029 (%)
            • Data Table on Others - Year-over-year growth 2024-2029 (%)
          • 8.6 Market opportunity by Application
            • Market opportunity by Application ($ million)
            • Data Table on Market opportunity by Application ($ million)

          9 Market Segmentation by Type

          • 9.1 Market segments
            • Chart on Type - Market share 2024-2029 (%)
            • Data Table on Type - Market share 2024-2029 (%)
          • 9.2 Comparison by Type
            • Chart on Comparison by Type
            • Data Table on Comparison by Type
          • 9.3 CO oxidation catalysts - Market size and forecast 2024-2029
            • Chart on CO oxidation catalysts - Market size and forecast 2024-2029 ($ million)
            • Data Table on CO oxidation catalysts - Market size and forecast 2024-2029 ($ million)
            • Chart on CO oxidation catalysts - Year-over-year growth 2024-2029 (%)
            • Data Table on CO oxidation catalysts - Year-over-year growth 2024-2029 (%)
          • 9.4 Selective catalytic reduction catalysts (SCRC) - Market size and forecast 2024-2029
            • Chart on Selective catalytic reduction catalysts (SCRC) - Market size and forecast 2024-2029 ($ million)
            • Data Table on Selective catalytic reduction catalysts (SCRC) - Market size and forecast 2024-2029 ($ million)
            • Chart on Selective catalytic reduction catalysts (SCRC) - Year-over-year growth 2024-2029 (%)
            • Data Table on Selective catalytic reduction catalysts (SCRC) - Year-over-year growth 2024-2029 (%)
          • 9.5 VOC oxidation catalysts - Market size and forecast 2024-2029
            • Chart on VOC oxidation catalysts - Market size and forecast 2024-2029 ($ million)
            • Data Table on VOC oxidation catalysts - Market size and forecast 2024-2029 ($ million)
            • Chart on VOC oxidation catalysts - Year-over-year growth 2024-2029 (%)
            • Data Table on VOC oxidation catalysts - Year-over-year growth 2024-2029 (%)
          • 9.6 Others - Market size and forecast 2024-2029
            • Chart on Others - Market size and forecast 2024-2029 ($ million)
            • Data Table on Others - Market size and forecast 2024-2029 ($ million)
            • Chart on Others - Year-over-year growth 2024-2029 (%)
            • Data Table on Others - Year-over-year growth 2024-2029 (%)
          • 9.7 Market opportunity by Type
            • Market opportunity by Type ($ million)
            • Data Table on Market opportunity by Type ($ million)

          10 Market Segmentation by Product Type

          • 10.1 Market segments
            • Chart on Product Type - Market share 2024-2029 (%)
            • Data Table on Product Type - Market share 2024-2029 (%)
          • 10.2 Comparison by Product Type
            • Chart on Comparison by Product Type
            • Data Table on Comparison by Product Type
          • 10.3 Precious metals - Market size and forecast 2024-2029
            • Chart on Precious metals - Market size and forecast 2024-2029 ($ million)
            • Data Table on Precious metals - Market size and forecast 2024-2029 ($ million)
            • Chart on Precious metals - Year-over-year growth 2024-2029 (%)
            • Data Table on Precious metals - Year-over-year growth 2024-2029 (%)
          • 10.4 Mixed metal oxides - Market size and forecast 2024-2029
            • Chart on Mixed metal oxides - Market size and forecast 2024-2029 ($ million)
            • Data Table on Mixed metal oxides - Market size and forecast 2024-2029 ($ million)
            • Chart on Mixed metal oxides - Year-over-year growth 2024-2029 (%)
            • Data Table on Mixed metal oxides - Year-over-year growth 2024-2029 (%)
          • 10.5 Base metals - Market size and forecast 2024-2029
            • Chart on Base metals - Market size and forecast 2024-2029 ($ million)
            • Data Table on Base metals - Market size and forecast 2024-2029 ($ million)
            • Chart on Base metals - Year-over-year growth 2024-2029 (%)
            • Data Table on Base metals - Year-over-year growth 2024-2029 (%)
          • 10.6 Market opportunity by Product Type
            • Market opportunity by Product Type ($ million)
            • Data Table on Market opportunity by Product Type ($ million)

          11 Customer Landscape

          • 11.1 Customer landscape overview
            • Analysis of price sensitivity, lifecycle, customer purchase basket, adoption rates, and purchase criteria

          12 Geographic Landscape

          • 12.1 Geographic segmentation
            • Chart on Market share by geography 2024-2029 (%)
            • Data Table on Market share by geography 2024-2029 (%)
          • 12.2 Geographic comparison
            • Chart on Geographic comparison
            • Data Table on Geographic comparison
          • 12.3 APAC - Market size and forecast 2024-2029
            • Chart on APAC - Market size and forecast 2024-2029 ($ million)
            • Data Table on APAC - Market size and forecast 2024-2029 ($ million)
            • Chart on APAC - Year-over-year growth 2024-2029 (%)
            • Data Table on APAC - Year-over-year growth 2024-2029 (%)
          • 12.4 North America - Market size and forecast 2024-2029
            • Chart on North America - Market size and forecast 2024-2029 ($ million)
            • Data Table on North America - Market size and forecast 2024-2029 ($ million)
            • Chart on North America - Year-over-year growth 2024-2029 (%)
            • Data Table on North America - Year-over-year growth 2024-2029 (%)
          • 12.5 Europe - Market size and forecast 2024-2029
            • Chart on Europe - Market size and forecast 2024-2029 ($ million)
            • Data Table on Europe - Market size and forecast 2024-2029 ($ million)
            • Chart on Europe - Year-over-year growth 2024-2029 (%)
            • Data Table on Europe - Year-over-year growth 2024-2029 (%)
          • 12.6 South America - Market size and forecast 2024-2029
            • Chart on South America - Market size and forecast 2024-2029 ($ million)
            • Data Table on South America - Market size and forecast 2024-2029 ($ million)
            • Chart on South America - Year-over-year growth 2024-2029 (%)
            • Data Table on South America - Year-over-year growth 2024-2029 (%)
          • 12.7 Middle East and Africa - Market size and forecast 2024-2029
            • Chart on Middle East and Africa - Market size and forecast 2024-2029 ($ million)
            • Data Table on Middle East and Africa - Market size and forecast 2024-2029 ($ million)
            • Chart on Middle East and Africa - Year-over-year growth 2024-2029 (%)
            • Data Table on Middle East and Africa - Year-over-year growth 2024-2029 (%)
          • 12.8 US - Market size and forecast 2024-2029
            • Chart on US - Market size and forecast 2024-2029 ($ million)
            • Data Table on US - Market size and forecast 2024-2029 ($ million)
            • Chart on US - Year-over-year growth 2024-2029 (%)
            • Data Table on US - Year-over-year growth 2024-2029 (%)
          • 12.9 China - Market size and forecast 2024-2029
            • Chart on China - Market size and forecast 2024-2029 ($ million)
            • Data Table on China - Market size and forecast 2024-2029 ($ million)
            • Chart on China - Year-over-year growth 2024-2029 (%)
            • Data Table on China - Year-over-year growth 2024-2029 (%)
          • 12.10 Japan - Market size and forecast 2024-2029
            • Chart on Japan - Market size and forecast 2024-2029 ($ million)
            • Data Table on Japan - Market size and forecast 2024-2029 ($ million)
            • Chart on Japan - Year-over-year growth 2024-2029 (%)
            • Data Table on Japan - Year-over-year growth 2024-2029 (%)
          • 12.11 India - Market size and forecast 2024-2029
            • Chart on India - Market size and forecast 2024-2029 ($ million)
            • Data Table on India - Market size and forecast 2024-2029 ($ million)
            • Chart on India - Year-over-year growth 2024-2029 (%)
            • Data Table on India - Year-over-year growth 2024-2029 (%)
          • 12.12 Canada - Market size and forecast 2024-2029
            • Chart on Canada - Market size and forecast 2024-2029 ($ million)
            • Data Table on Canada - Market size and forecast 2024-2029 ($ million)
            • Chart on Canada - Year-over-year growth 2024-2029 (%)
            • Data Table on Canada - Year-over-year growth 2024-2029 (%)
          • 12.13 UK - Market size and forecast 2024-2029
            • Chart on UK - Market size and forecast 2024-2029 ($ million)
            • Data Table on UK - Market size and forecast 2024-2029 ($ million)
            • Chart on UK - Year-over-year growth 2024-2029 (%)
            • Data Table on UK - Year-over-year growth 2024-2029 (%)
          • 12.14 South Korea - Market size and forecast 2024-2029
            • Chart on South Korea - Market size and forecast 2024-2029 ($ million)
            • Data Table on South Korea - Market size and forecast 2024-2029 ($ million)
            • Chart on South Korea - Year-over-year growth 2024-2029 (%)
            • Data Table on South Korea - Year-over-year growth 2024-2029 (%)
          • 12.15 Germany - Market size and forecast 2024-2029
            • Chart on Germany - Market size and forecast 2024-2029 ($ million)
            • Data Table on Germany - Market size and forecast 2024-2029 ($ million)
            • Chart on Germany - Year-over-year growth 2024-2029 (%)
            • Data Table on Germany - Year-over-year growth 2024-2029 (%)
          • 12.16 France - Market size and forecast 2024-2029
            • Chart on France - Market size and forecast 2024-2029 ($ million)
            • Data Table on France - Market size and forecast 2024-2029 ($ million)
            • Chart on France - Year-over-year growth 2024-2029 (%)
            • Data Table on France - Year-over-year growth 2024-2029 (%)
          • 12.17 Italy - Market size and forecast 2024-2029
            • Chart on Italy - Market size and forecast 2024-2029 ($ million)
            • Data Table on Italy - Market size and forecast 2024-2029 ($ million)
            • Chart on Italy - Year-over-year growth 2024-2029 (%)
            • Data Table on Italy - Year-over-year growth 2024-2029 (%)
          • 12.18 Market opportunity by geography
            • Market opportunity by geography ($ million)
            • Data Tables on Market opportunity by geography ($ million)

          13 Drivers, Challenges, and Opportunity/Restraints

          • 13.1 Market drivers
            • 13.2 Market challenges
              • 13.3 Impact of drivers and challenges
                • Impact of drivers and challenges in 2024 and 2029
              • 13.4 Market opportunities/restraints

                14 Competitive Landscape

                • 14.1 Overview
                  • 14.2 Competitive Landscape
                    • Overview on criticality of inputs and factors of differentiation
                  • 14.3 Landscape disruption
                    • Overview on factors of disruption
                  • 14.4 Industry risks
                    • Impact of key risks on business

                  15 Competitive Analysis

                  • 15.1 Companies profiled
                    • Companies covered
                  • 15.2 Company ranking index
                    • Company ranking index
                  • 15.3 Market positioning of companies
                    • Matrix on companies position and classification
                  • 15.4 Albemarle Corp.
                    • Albemarle Corp. - Overview
                    • Albemarle Corp. - Business segments
                    • Albemarle Corp. - Key news
                    • Albemarle Corp. - Key offerings
                    • Albemarle Corp. - Segment focus
                    • SWOT
                  • 15.5 Axens Group
                    • Axens Group - Overview
                    • Axens Group - Product / Service
                    • Axens Group - Key offerings
                    • SWOT
                  • 15.6 Babcock Power Inc.
                    • Babcock Power Inc. - Overview
                    • Babcock Power Inc. - Product / Service
                    • Babcock Power Inc. - Key offerings
                    • SWOT
                  • 15.7 BASF SE
                    • BASF SE - Overview
                    • BASF SE - Business segments
                    • BASF SE - Key news
                    • BASF SE - Key offerings
                    • BASF SE - Segment focus
                    • SWOT
                  • 15.8 Catalytic Combustion Corp.
                    • Catalytic Combustion Corp. - Overview
                    • Catalytic Combustion Corp. - Product / Service
                    • Catalytic Combustion Corp. - Key offerings
                    • SWOT
                  • 15.9 China Petrochemical Corp.
                    • China Petrochemical Corp. - Overview
                    • China Petrochemical Corp. - Business segments
                    • China Petrochemical Corp. - Key offerings
                    • China Petrochemical Corp. - Segment focus
                    • SWOT
                  • 15.10 China Petrochemical Corp.
                    • China Petrochemical Corp. - Overview
                    • China Petrochemical Corp. - Business segments
                    • China Petrochemical Corp. - Key offerings
                    • China Petrochemical Corp. - Segment focus
                    • SWOT
                  • 15.11 Clariant International Ltd.
                    • Clariant International Ltd. - Overview
                    • Clariant International Ltd. - Business segments
                    • Clariant International Ltd. - Key news
                    • Clariant International Ltd. - Key offerings
                    • Clariant International Ltd. - Segment focus
                    • SWOT
                  • 15.12 CORMETECH Inc.
                    • CORMETECH Inc. - Overview
                    • CORMETECH Inc. - Product / Service
                    • CORMETECH Inc. - Key offerings
                    • SWOT
                  • 15.13 Evonik Industries AG
                    • Evonik Industries AG - Overview
                    • Evonik Industries AG - Business segments
                    • Evonik Industries AG - Key news
                    • Evonik Industries AG - Key offerings
                    • Evonik Industries AG - Segment focus
                    • SWOT
                  • 15.14 Honeywell International Inc.
                    • Honeywell International Inc. - Overview
                    • Honeywell International Inc. - Business segments
                    • Honeywell International Inc. - Key news
                    • Honeywell International Inc. - Key offerings
                    • Honeywell International Inc. - Segment focus
                    • SWOT
                  • 15.15 Johnson Matthey Plc
                    • Johnson Matthey Plc - Overview
                    • Johnson Matthey Plc - Business segments
                    • Johnson Matthey Plc - Key offerings
                    • Johnson Matthey Plc - Segment focus
                    • SWOT
                  • 15.16 Topsoes AS
                    • Topsoes AS - Overview
                    • Topsoes AS - Product / Service
                    • Topsoes AS - Key offerings
                    • SWOT
                  • 15.17 Treibacher Industrie AG
                    • Treibacher Industrie AG - Overview
                    • Treibacher Industrie AG - Product / Service
                    • Treibacher Industrie AG - Key offerings
                    • SWOT
                  • 15.18 Umicore SA
                    • Umicore SA - Overview
                    • Umicore SA - Business segments
                    • Umicore SA - Key news
                    • Umicore SA - Key offerings
                    • Umicore SA - Segment focus
                    • SWOT

                  16 Appendix

                  • 16.1 Scope of the report
                    • 16.2 Inclusions and exclusions checklist
                      • Inclusions checklist
                      • Exclusions checklist
                    • 16.3 Currency conversion rates for US$
                      • Currency conversion rates for US$
                    • 16.4 Research methodology
                      • Research methodology
                    • 16.5 Data procurement
                      • Information sources
                    • 16.6 Data validation
                      • Data validation
                    • 16.7 Validation techniques employed for market sizing
                      • Validation techniques employed for market sizing
                    • 16.8 Data synthesis
                      • Data synthesis
                    • 16.9 360 degree market analysis
                      • 360 degree market analysis
                    • 16.10 List of abbreviations
                      • List of abbreviations

                    Research Methodology

                    Technavio presents a detailed picture of the market by way of study, synthesis, and summation of data from multiple sources. The analysts have presented the various facets of the market with a particular focus on identifying the key industry influencers. The data thus presented is comprehensive, reliable, and the result of extensive research, both primary and secondary.

                    INFORMATION SOURCES

                    Primary sources

                    • Manufacturers and suppliers
                    • Channel partners
                    • Industry experts
                    • Strategic decision makers

                    Secondary sources

                    • Industry journals and periodicals
                    • Government data
                    • Financial reports of key industry players
                    • Historical data
                    • Press releases

                    DATA ANALYSIS

                    Data Synthesis

                    • Collation of data
                    • Estimation of key figures
                    • Analysis of derived insights

                    Data Validation

                    • Triangulation with data models
                    • Reference against proprietary databases
                    • Corroboration with industry experts

                    REPORT WRITING

                    Qualitative

                    • Market drivers
                    • Market challenges
                    • Market trends
                    • Five forces analysis

                    Quantitative

                    • Market size and forecast
                    • Market segmentation
                    • Geographical insights
                    • Competitive landscape

                    Interested in this report?

                    Get your sample now to see our research methodology and insights!

                    Download Now

                    Frequently Asked Questions

                    Environmental Catalyst market growth will increase by $ 3015 mn during 2025-2029 .

                    The Environmental Catalyst market is expected to grow at a CAGR of 4.6% during 2025-2029 .

                    Environmental Catalyst market is segmented by Application( Automotive, Manufacturing industries, Others) Type( CO oxidation catalysts, Selective catalytic reduction catalysts (SCRC), VOC oxidation catalysts, Others) Product Type( Precious metals, Mixed metal oxides, Base metals, South America, Middle East and Africa)

                    Albemarle Corp., Axens Group, Babcock Power Inc., BASF SE, Catalytic Combustion Corp., China Petrochemical Corp., China Petrochemical Corp., Clariant International Ltd., CORMETECH Inc., Evonik Industries AG, Exxon Mobil Corp., Heraeus Holding GmbH, Honeywell International Inc., Johnson Matthey Plc, OMV Aktiengesellschaft, Topsoes AS, Treibacher Industrie AG, Umicore SA are a few of the key vendors in the Environmental Catalyst market.

                    APAC will register the highest growth rate of 37% among the other regions. Therefore, the Environmental Catalyst market in APAC is expected to garner significant business opportunities for the vendors during the forecast period.

                    US, China, India, Japan, Canada, UK, South Korea, Germany, France, Italy

                    • Stringent environmental regulations related to emission standardsStringent environmental regulations play a pivotal role in shaping the global environmental catalyst market is the driving factor this market.
                    • driving industries to adopt innovative technologies that reduce their ecological footprint. Governments worldwide have been increasingly enacting and enforcing stringent rules to curb air and water pollution is the driving factor this market.
                    • emphasizing the need for cleaner industrial processes. For example is the driving factor this market.
                    • in the automotive sector is the driving factor this market.
                    • emission standards such as Euro 6 in Europe and CAFE standards in the US mandate stringent limits on pollutants is the driving factor this market.
                    • compelling automobile manufacturers to incorporate advanced catalytic converters. These regulations act as powerful catalysts themselves is the driving factor this market.
                    • pushing industries to invest in emission control solutions and boosting the demand for environmental catalysts. In the power generation sector is the driving factor this market.
                    • various countries have implemented strict emission standards for coal-fired power plants is the driving factor this market.
                    • limiting the release of pollutants such as sulfur dioxide and nitrogen oxides. This has led to the adoption of catalysts in flue gas treatment systems to meet regulatory requirements. Additionally is the driving factor this market.
                    • the petrochemical industry faces regulations aimed at reducing VOC emissions is the driving factor this market.
                    • prompting the use of catalysts in processes such as catalytic oxidation. The maritime industry has also witnessed the implementation of International Maritime Organization (IMO) regulations is the driving factor this market.
                    • such as the International Maritime Emission Control Area (ECA) is the driving factor this market.
                    • restricting sulfur content in ship fuels. This has spurred the demand for catalysts in exhaust gas cleaning systems is the driving factor this market.
                    • known as scrubbers is the driving factor this market.
                    • to comply with these stringent regulations. Thus is the driving factor this market.
                    • the stringent environmental regulations related to emission standards are expected to drive the growth of the global environmental catalyst market during the forecast period. is the driving factor this market.

                    The Environmental Catalyst market vendors should focus on grabbing business opportunities from the Automotive segment as it accounted for the largest market share in the base year.