Air Pollution Control Market Analysis, Size, and Forecast 2026-2030: APAC (China, India, and Japan), North America (US, Canada, and Mexico), Europe (Germany, UK, and France), Middle East and Africa (Saudi Arabia, UAE, and South Africa), South America (Brazil and Argentina), and Rest of World (ROW)

Air Pollution Control Market Analysis, Size, and Forecast 2026-2030:
APAC (China, India, and Japan), North America (US, Canada, and Mexico), Europe (Germany, UK, and France), Middle East and Africa (Saudi Arabia, UAE, and South Africa), South America (Brazil and Argentina), and Rest of World (ROW)

Published: Mar 2026 296 Pages SKU: IRTNTR43975

Market Overview at a Glance

$60.76 B
Market Opportunity
8.6%
CAGR 2025 - 2030
39.5%
APAC Growth
$48.40 B
Power segment 2024

Air Pollution Control Market Size 2026-2030

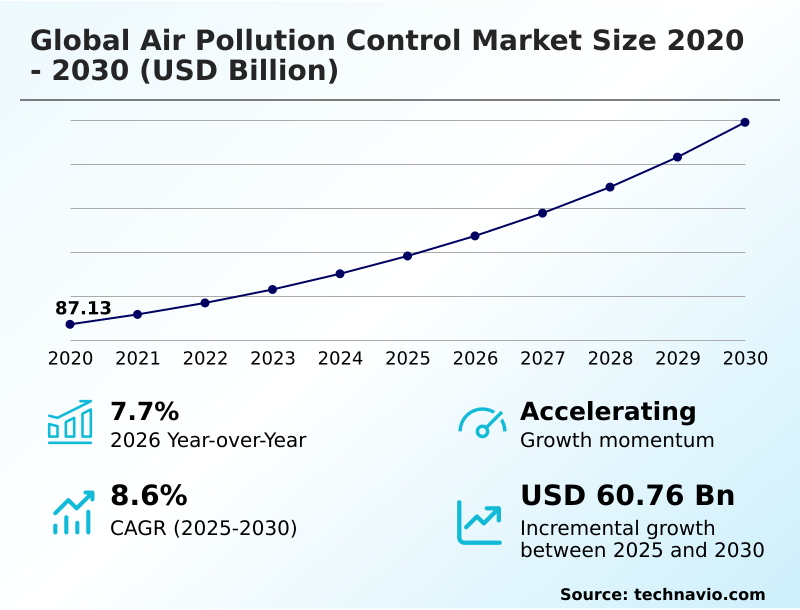
The air pollution control market size is valued to increase by USD 60.76 billion, at a CAGR of 8.6% from 2025 to 2030. Stringent regulatory frameworks and compliance mandates will drive the air pollution control market.

Major Market Trends & Insights

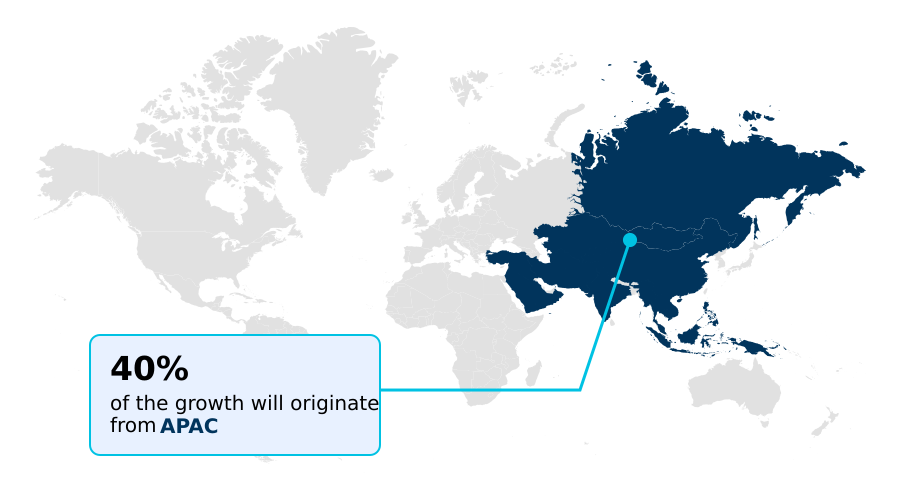
  • APAC dominated the market and accounted for a 39.5% growth during the forecast period.
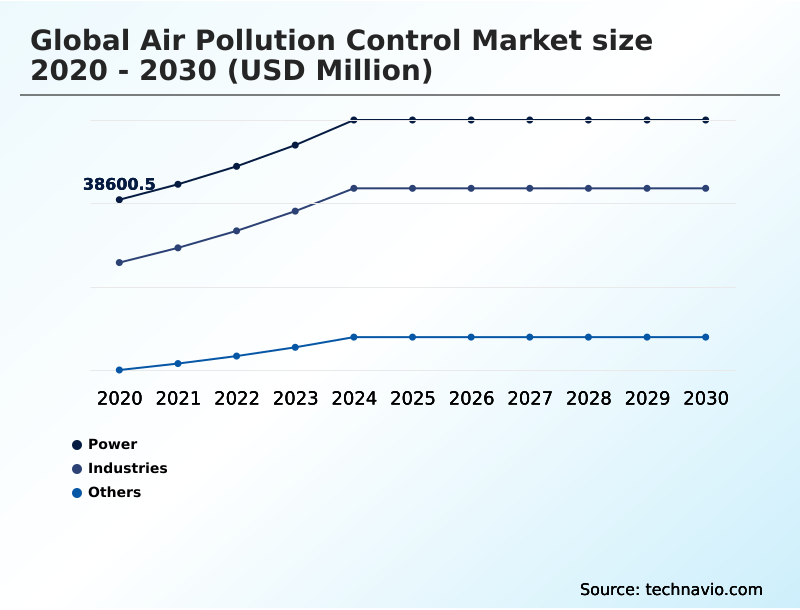
  • By End-user - Power segment was valued at USD 48.40 billion in 2024
  • By Product - Scrubbers segment accounted for the largest market revenue share in 2024

Market Size & Forecast

  • Market Opportunities: USD 91.82 billion
  • Market Future Opportunities: USD 60.76 billion
  • CAGR from 2025 to 2030 : 8.6%

Market Summary

  • The air pollution control market encompasses the technologies and methods used to reduce harmful pollutants from industrial, commercial, and transportation sources. Growth is primarily driven by stringent environmental legislation and an increasing focus on public health, which compel industries to adopt advanced systems for particulate matter filtration and hazardous air pollutants control.
  • A significant trend is the integration of pollution abatement with decarbonization strategies, including carbon capture utilization and storage, moving the market beyond mere compliance. However, high capital and operational costs remain a substantial challenge.
  • For instance, a manager of a heavy industrial facility must balance the significant upfront investment for a wet scrubbers or selective catalytic reduction retrofit against the long-term operational savings and the necessity of meeting new, non-negotiable emission ceilings.
  • This scenario highlights the central tension between financial constraints and the escalating demand for cleaner industrial processes and advanced technologies like direct air capture technology.

What will be the Size of the Air Pollution Control Market during the forecast period?

Get Key Insights on Market Forecast (PDF) Request Free Sample

How is the Air Pollution Control Market Segmented?

The air pollution control industry research report provides comprehensive data (region-wise segment analysis), with forecasts and estimates in "USD million" for the period 2026-2030, as well as historical data from 2020-2024 for the following segments.

  • End-user
    • Power
    • Industries
    • Others
  • Product
    • Scrubbers
    • Catalyst converters
    • Others
  • Technology
    • Flue gas desulfurization
    • Baghouse systems
    • Selective catalytic reduction
  • Geography
    • APAC
      • China
      • India
      • Japan
    • North America
      • US
      • Canada
      • Mexico
    • Europe
      • Germany
      • UK
      • France
    • Middle East and Africa
      • Saudi Arabia
      • UAE
      • South Africa
    • South America
      • Brazil
      • Argentina
    • Rest of World (ROW)

By End-user Insights

The power segment is estimated to witness significant growth during the forecast period.

The power segment is undergoing a significant transformation, driven by the imperative to transition toward low-carbon energy systems. This shift compels utility providers to adopt advanced abatement technologies beyond basic filtration, integrating sophisticated carbon capture utilization and storage infrastructure.

The focus is now on projects like bioenergy with carbon capture, which require complex flue gas conditioning and amine-based gas treatment to produce net-zero industrial commodities.

As a result, modern systems are evaluated on their ability to meet ultra-low emission standards, with flue gas desulfurization technologies now routinely exceeding 98% capture efficiency.

This operational sustainability metrics-driven approach redefines pollution control as a core component of asset viability in a decarbonizing economy, moving beyond simple stationary source emission control to a more holistic strategy encompassing gas phase filtration and catalytic filter bags.

Request Free Sample

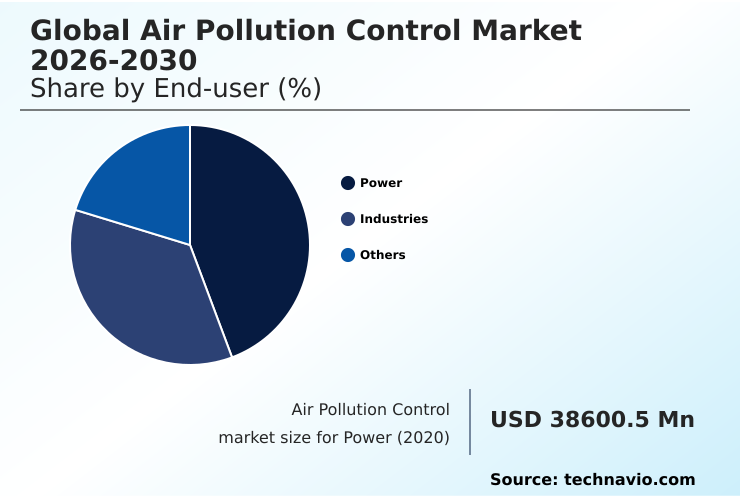
The Power segment was valued at USD 48.40 billion in 2024 and showed a gradual increase during the forecast period.

Request Free Sample

Regional Analysis

APAC is estimated to contribute 39.5% to the growth of the global market during the forecast period.Technavio’s analysts have elaborately explained the regional trends and drivers that shape the market during the forecast period.

See How Air Pollution Control Market Demand is Rising in APAC Request Free Sample

The market's geographic landscape is characterized by distinct regional priorities.

APAC, accounting for nearly 39.53% of the incremental growth, is driven by rapid industrialization and governmental mandates to improve air quality, leading to large-scale deployment of baghouse systems and wet electrostatic precipitator technology.

This is exemplified by projects demonstrating 20% ammonia substitution in thermal power plants.

In contrast, North America and Europe focus on advanced technologies, including bio-cogeneration plant emissions reduction and direct air capture technology, spurred by mature regulatory frameworks and decarbonization incentives.

This regional divergence creates a multifaceted market where demand is shaped by both immediate public health needs and long-term climate objectives that require continuous compliance monitoring, fugitive dust suppression, and high-efficiency particulate air filtration technologies such as v-bank air filter design.

Market Dynamics

Our researchers analyzed the data with 2025 as the base year, along with the key drivers, trends, and challenges. A holistic analysis of drivers will help companies refine their marketing strategies to gain a competitive advantage.

  • Strategic decision-making in the air pollution control market requires a detailed evaluation of various technological pathways and their operational impacts. A scrubbers vs electrostatic precipitators comparison is fundamental for industries dealing with specific particulate characteristics, while a deeper analysis of the cost of carbon capture in cement production is critical for long-term decarbonization strategies.
  • For mobile sources, understanding the euro 7 emission standards impact on catalysts is vital, just as managing sox and nox in marine engines is key to assessing the efficiency of marine scrubbers for imo compliance. Stationary sources present different challenges, such as retrofitting coal power plants with fgd systems or optimizing scr systems for low-load conditions.
  • Specialized applications are also expanding, from voc recovery in petrochemical refining and fine dust control in open-pit mining operations to implementing advanced hvac filtration for hospital indoor air quality. The benefits of pulse-jet fabric filters in providing high-efficiency particulate removal are well-documented.
  • Technologies like catalytic oxidation for voc destruction and advanced baghouse filter media for heavy industry offer superior performance over legacy systems, often improving pollutant removal efficiency by over 15%, which directly enhances compliance with evolving industrial flue gas treatment solutions.
  • This focus extends to niche areas like direct reduction iron plant emission control, air pollution control for waste-to-energy plants, reducing particulate matter from diesel engines, ammonia co-firing in thermal power stations, nitrogen oxide control for gas turbine exhausts, and innovative carbon capture pre-treatment system design.

What are the key market drivers leading to the rise in the adoption of Air Pollution Control Industry?

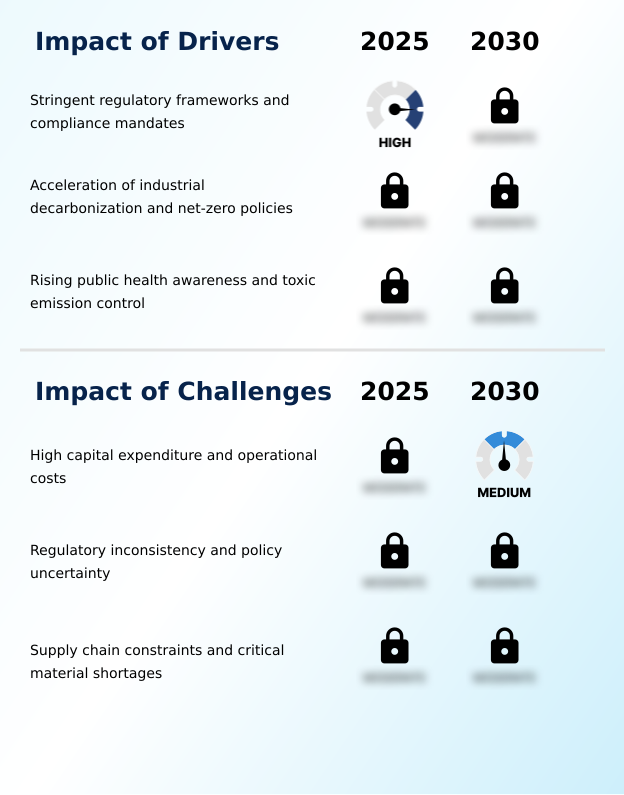
  • Stringent regulatory frameworks and compliance mandates are a key driver of the market.

  • The market is primarily propelled by the intensifying rigor of environmental legislation, compelling heavy industries to adopt best available techniques for emission abatement.
  • In certain industrializing economies, this has led to new rules mandating that key sectors slash particulate matter and sulfur dioxide emissions by approximately 50% and 40%, respectively.
  • A second transformative driver is the global imperative to decarbonize hard-to-abate sectors, integrating traditional air quality management with carbon capture. This trend is bolstered by new legal frameworks unlocking significant investment for industrial decarbonization pathways.
  • A third critical driver is the heightened focus on public health, which is expanding the market for advanced filtration and catalytic oxidation technologies.
  • This is evidenced by government bodies awarding multi-year contracts, such as one for five years, to support the revision of standards for toxic air emissions, driving downstream adoption of state-of-the-art pollution control technologies and promoting fence-line community protection.

What are the market trends shaping the Air Pollution Control Industry?

  • Strategic rebranding and the integration of decarbonization portfolios represent a key upcoming market trend. This shift highlights a move towards comprehensive climate protection strategies.

  • A dominant trend is the strategic pivot of industrial firms toward holistic decarbonization identities, merging traditional particulate matter filtration with next-generation energy solutions. This deep operational realignment is complemented by a decisive move away from transactional sales toward data-driven lifecycle service agreements, where predictive maintenance algorithms enhance reliability and guarantee continuous compliance.
  • This is demonstrated by service agreements that can span over six years, ensuring long-term operational assurance. Furthermore, a technological surge in developing advanced low-resistance filtration systems and ceramic filter elements addresses the dual pressures of improving indoor air quality management and reducing building carbon footprints.
  • Innovations in this area can offer a significantly lower pressure drop compared to legacy filters, directly supporting both sustainability goals and occupant health through best available control technology and effective gas stream impurity management.

What challenges does the Air Pollution Control Industry face during its growth?

  • High capital expenditure and operational costs represent a key challenge affecting industry growth.

  • A primary market challenge is the substantial capital requirement for advanced technologies, coupled with high operational costs that represent a non-revenue-generating expense for many industries. This financial friction is intensified by regulatory fragmentation and unpredictability across jurisdictions, which complicates equipment standardization and long-term strategic planning.
  • Furthermore, the market is increasingly threatened by global supply chain rigidities, particularly concerning the availability of critical raw materials. For instance, the market for platinum and palladium, essential for catalytic converters, has faced a structural supply deficit for three consecutive years.
  • This platinum group metals dependency creates bottlenecks and rising input costs, challenging the deployment of essential environmental infrastructure, including systems for stationary source emission control, and complicates efforts to establish a circular economy of catalyst materials under existing ambient air quality standards.

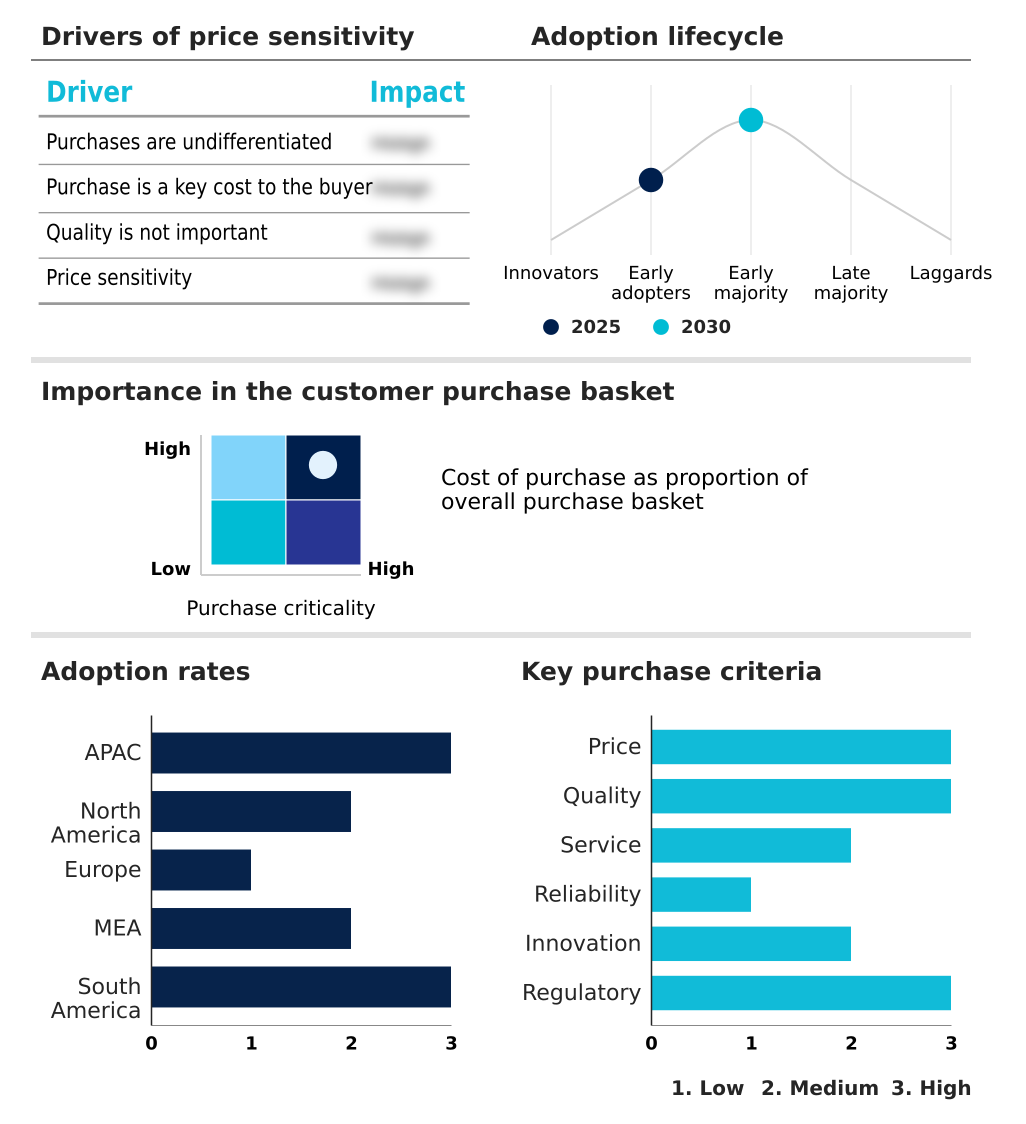
Exclusive Technavio Analysis on Customer Landscape

The air pollution control market forecasting report includes the adoption lifecycle of the market, covering from the innovator’s stage to the laggard’s stage. It focuses on adoption rates in different regions based on penetration. Furthermore, the air pollution control market report also includes key purchase criteria and drivers of price sensitivity to help companies evaluate and develop their market growth analysis strategies.

Customer Landscape of Air Pollution Control Industry

Competitive Landscape

Companies are implementing various strategies, such as strategic alliances, air pollution control market forecast, partnerships, mergers and acquisitions, geographical expansion, and product/service launches, to enhance their presence in the industry.

Ahlstrom Oyj - Delivers a portfolio of air pollution control technologies, including electrostatic precipitators, fabric filters, and wet scrubbers, targeting large-scale industrial applications.

The industry research and growth report includes detailed analyses of the competitive landscape of the market and information about key companies, including:

  • Ahlstrom Oyj
  • Airex Industries Inc.
  • American Air Filter Co. Inc.
  • Andritz AG
  • Babcock and Wilcox
  • Camfil AB
  • Donaldson Co. Inc.
  • Doosan Lentjes GmbH
  • DuPont de Nemours Inc.
  • Elessent Clean Technologies Inc
  • Freudenberg and Co. KG
  • GEA Group AG
  • General Electric Co.
  • John Wood Group PLC
  • Mitsubishi Heavy Ltd.
  • MITTAL BLOWERS INDIA PVT. LTD.
  • Parker Hannifin Corp.
  • Sumitomo Corp.
  • Thermax Ltd.

Qualitative and quantitative analysis of companies has been conducted to help clients understand the wider business environment as well as the strengths and weaknesses of key industry players. Data is qualitatively analyzed to categorize companies as pure play, category-focused, industry-focused, and diversified; it is quantitatively analyzed to categorize companies as dominant, leading, strong, tentative, and weak.

Recent Development and News in Air pollution control market

  • In January 2025, United Catalyst Corp. released a strategic assessment detailing the changing deficits of palladium and rhodium, signaling that the future profitability of the catalytic converter segment will rely heavily on efficient secondary supply chains.
  • In February 2025, Andritz AG completed its acquisition of the LDX Group, a strategic move designed to bolster its environmental solutions portfolio and expand its service offerings for industrial emission reduction in the North American market.
  • In April 2025, the US Environmental Protection Agency awarded a five-year contract to Eastern Research Group to support the development and revision of standards for toxic air emissions, with a primary goal of reducing health risks from hazardous air pollutants.
  • In May 2025, the World Platinum Investment Council published a quarterly report warning of a deepening structural deficit in the global supply of platinum and palladium, projecting that industrial demand would outstrip mining output for the third consecutive year.

Dive into Technavio’s robust research methodology, blending expert interviews, extensive data synthesis, and validated models for unparalleled Air Pollution Control Market insights. See full methodology.

Market Scope
Page number 296
Base year 2025
Historic period 2020-2024
Forecast period 2026-2030
Growth momentum & CAGR Accelerate at a CAGR of 8.6%
Market growth 2026-2030 USD 60756.4 million
Market structure Fragmented
YoY growth 2025-2026(%) 7.7%
Key countries China, India, Japan, South Korea, Australia, Indonesia, US, Canada, Mexico, Germany, UK, France, Italy, Spain, The Netherlands, Saudi Arabia, UAE, Egypt, South Africa, Turkey, Brazil, Argentina and Chile
Competitive landscape Leading Companies, Market Positioning of Companies, Competitive Strategies, and Industry Risks

Request Free Sample

Research Analyst Overview

  • The air pollution control market is evolving from a focus on standalone compliance hardware to integrated, performance-driven solutions. Leading firms are restructuring their value propositions to address both traditional pollutants and carbon intensity, reflecting a strategic pivot toward holistic industrial decarbonization.
  • This boardroom-level shift prioritizes lifecycle service agreements and advanced technologies like carbon capture utilization and storage, moving beyond transactional equipment sales. The market is propelled by stringent enforcement, such as new standards in some regions mandating that specific industries slash particulate matter and sulfur dioxide emissions by up to 50% and 40%, respectively.
  • This regulatory pressure, coupled with the need for technologies such as volatile organic compound abatement, hazardous air pollutants control, and nitrogen oxide reduction, reinforces the demand for advanced systems.
  • Innovations in thermal oxidizer systems, exhaust gas cleaning systems, and multi-pollutant control systems are becoming critical as industries navigate the complex landscape of environmental compliance and long-term sustainability goals, utilizing solutions like flue gas recirculation and ammonia-free scr systems.

What are the Key Data Covered in this Air Pollution Control Market Research and Growth Report?

  • What is the expected growth of the Air Pollution Control Market between 2026 and 2030?

    • USD 60.76 billion, at a CAGR of 8.6%

  • What segmentation does the market report cover?

    • The report is segmented by End-user (Power, Industries, and Others), Product (Scrubbers, Catalyst converters, and Others), Technology (Flue gas desulfurization, Baghouse systems, and Selective catalytic reduction) and Geography (APAC, North America, Europe, Middle East and Africa, South America)

  • Which regions are analyzed in the report?

    • APAC, North America, Europe, Middle East and Africa and South America

  • What are the key growth drivers and market challenges?

    • Stringent regulatory frameworks and compliance mandates, High capital expenditure and operational costs

  • Who are the major players in the Air Pollution Control Market?

    • Ahlstrom Oyj, Airex Industries Inc., American Air Filter Co. Inc., Andritz AG, Babcock and Wilcox, Camfil AB, Donaldson Co. Inc., Doosan Lentjes GmbH, DuPont de Nemours Inc., Elessent Clean Technologies Inc, Freudenberg and Co. KG, GEA Group AG, General Electric Co., John Wood Group PLC, Mitsubishi Heavy Ltd., MITTAL BLOWERS INDIA PVT. LTD., Parker Hannifin Corp., Sumitomo Corp. and Thermax Ltd.

Market Research Insights

  • Market dynamics are defined by a dual focus on regulatory compliance and the strategic pursuit of industrial decarbonization pathways. The implementation of ultra-low emission standards is a primary catalyst, with some jurisdictions mandating emission reductions of up to 50% for specific pollutants like sulfur dioxide, forcing investment in best available techniques.
  • Concurrently, the push for net-zero industrial commodities is driving the adoption of advanced systems, demonstrated by facilities now capturing roughly 50% of total plant emissions through integrated carbon capture.
  • This convergence of regulatory pressure and sustainability goals is compelling operators of combined-cycle gas turbines and other industrial plants to prioritize technologies that offer both environmental compliance and a competitive edge in a low-carbon economy.

We can help! Our analysts can customize this air pollution control market research report to meet your requirements.

Get in touch

1. Executive Summary

1.1 Market overview

Executive Summary - Chart on Market Overview
Executive Summary - Data Table on Market Overview
Executive Summary - Chart on Global Market Characteristics
Executive Summary - Chart on Market by Geography
Executive Summary - Chart on Market Segmentation by End-user
Executive Summary - Chart on Market Segmentation by Product
Executive Summary - Chart on Market Segmentation by Technology
Executive Summary - Chart on Incremental Growth
Executive Summary - Data Table on Incremental Growth
Executive Summary - Chart on Company Market Positioning

2. Technavio Analysis

2.1 Analysis of price sensitivity, lifecycle, customer purchase basket, adoption rates, and purchase criteria

2.2 Criticality of inputs and Factors of differentiation

Chart on Overview on criticality of inputs and factors of differentiation

2.3 Factors of disruption

Chart on Overview on factors of disruption

2.4 Impact of drivers and challenges

Chart on Impact of drivers and challenges in 2025 and 2030

3. Market Landscape

3.1 Market ecosystem

Chart on Parent Market
Data Table on - Parent Market

3.2 Market characteristics

Chart on Market characteristics analysis

3.3 Value chain analysis

Chart on Value chain analysis

4. Market Sizing

4.1 Market definition

Data Table on Offerings of companies included in the market definition

4.2 Market segment analysis

Market segments

4.3 Market size 2025

4.4 Market outlook: Forecast for 2025-2030

Chart on Global - Market size and forecast 2025-2030 ($ million)
Data Table on Global - Market size and forecast 2025-2030 ($ million)
Chart on Global Market: Year-over-year growth 2025-2030 (%)
Data Table on Global Market: Year-over-year growth 2025-2030 (%)

5. Historic Market Size

5.1 Global Air Pollution Control Market 2020 - 2024

Historic Market Size - Data Table on Global Air Pollution Control Market 2020 - 2024 ($ million)

5.2 End-user segment analysis 2020 - 2024

Historic Market Size - End-user Segment 2020 - 2024 ($ million)

5.3 Product segment analysis 2020 - 2024

Historic Market Size - Product Segment 2020 - 2024 ($ million)

5.4 Technology segment analysis 2020 - 2024

Historic Market Size - Technology Segment 2020 - 2024 ($ million)

5.5 Geography segment analysis 2020 - 2024

Historic Market Size - Geography Segment 2020 - 2024 ($ million)

5.6 Country segment analysis 2020 - 2024

Historic Market Size - Country Segment 2020 - 2024 ($ million)

6. Qualitative Analysis

6.1 Impact of AI on Global Air Pollution Control Market

7. Five Forces Analysis

7.1 Five forces summary

Five forces analysis - Comparison between 2025 and 2030

7.2 Bargaining power of buyers

Bargaining power of buyers - Impact of key factors 2025 and 2030

7.3 Bargaining power of suppliers

Bargaining power of suppliers - Impact of key factors in 2025 and 2030

7.4 Threat of new entrants

Threat of new entrants - Impact of key factors in 2025 and 2030

7.5 Threat of substitutes

Threat of substitutes - Impact of key factors in 2025 and 2030

7.6 Threat of rivalry

Threat of rivalry - Impact of key factors in 2025 and 2030

7.7 Market condition

Chart on Market condition - Five forces 2025 and 2030

8. Market Segmentation by End-user

8.1 Market segments

Chart on End-user - Market share 2025-2030 (%)
Data Table on End-user - Market share 2025-2030 (%)

8.2 Comparison by End-user

Chart on Comparison by End-user
Data Table on Comparison by End-user

8.3 Power - Market size and forecast 2025-2030

Chart on Power - Market size and forecast 2025-2030 ($ million)
Data Table on Power - Market size and forecast 2025-2030 ($ million)
Chart on Power - Year-over-year growth 2025-2030 (%)
Data Table on Power - Year-over-year growth 2025-2030 (%)

8.4 Industries - Market size and forecast 2025-2030

Chart on Industries - Market size and forecast 2025-2030 ($ million)
Data Table on Industries - Market size and forecast 2025-2030 ($ million)
Chart on Industries - Year-over-year growth 2025-2030 (%)
Data Table on Industries - Year-over-year growth 2025-2030 (%)

8.5 Others - Market size and forecast 2025-2030

Chart on Others - Market size and forecast 2025-2030 ($ million)
Data Table on Others - Market size and forecast 2025-2030 ($ million)
Chart on Others - Year-over-year growth 2025-2030 (%)
Data Table on Others - Year-over-year growth 2025-2030 (%)

8.6 Market opportunity by End-user

Market opportunity by End-user ($ million)
Data Table on Market opportunity by End-user ($ million)

9. Market Segmentation by Product

9.1 Market segments

Chart on Product - Market share 2025-2030 (%)
Data Table on Product - Market share 2025-2030 (%)

9.2 Comparison by Product

Chart on Comparison by Product
Data Table on Comparison by Product

9.3 Scrubbers - Market size and forecast 2025-2030

Chart on Scrubbers - Market size and forecast 2025-2030 ($ million)
Data Table on Scrubbers - Market size and forecast 2025-2030 ($ million)
Chart on Scrubbers - Year-over-year growth 2025-2030 (%)
Data Table on Scrubbers - Year-over-year growth 2025-2030 (%)

9.4 Catalyst converters - Market size and forecast 2025-2030

Chart on Catalyst converters - Market size and forecast 2025-2030 ($ million)
Data Table on Catalyst converters - Market size and forecast 2025-2030 ($ million)
Chart on Catalyst converters - Year-over-year growth 2025-2030 (%)
Data Table on Catalyst converters - Year-over-year growth 2025-2030 (%)

9.5 Others - Market size and forecast 2025-2030

Chart on Others - Market size and forecast 2025-2030 ($ million)
Data Table on Others - Market size and forecast 2025-2030 ($ million)
Chart on Others - Year-over-year growth 2025-2030 (%)
Data Table on Others - Year-over-year growth 2025-2030 (%)

9.6 Market opportunity by Product

Market opportunity by Product ($ million)
Data Table on Market opportunity by Product ($ million)

10. Market Segmentation by Technology

10.1 Market segments

Chart on Technology - Market share 2025-2030 (%)
Data Table on Technology - Market share 2025-2030 (%)

10.2 Comparison by Technology

Chart on Comparison by Technology
Data Table on Comparison by Technology

10.3 Flue gas desulfurization - Market size and forecast 2025-2030

Chart on Flue gas desulfurization - Market size and forecast 2025-2030 ($ million)
Data Table on Flue gas desulfurization - Market size and forecast 2025-2030 ($ million)
Chart on Flue gas desulfurization - Year-over-year growth 2025-2030 (%)
Data Table on Flue gas desulfurization - Year-over-year growth 2025-2030 (%)

10.4 Baghouse systems - Market size and forecast 2025-2030

Chart on Baghouse systems - Market size and forecast 2025-2030 ($ million)
Data Table on Baghouse systems - Market size and forecast 2025-2030 ($ million)
Chart on Baghouse systems - Year-over-year growth 2025-2030 (%)
Data Table on Baghouse systems - Year-over-year growth 2025-2030 (%)

10.5 Selective catalytic reduction - Market size and forecast 2025-2030

Chart on Selective catalytic reduction - Market size and forecast 2025-2030 ($ million)
Data Table on Selective catalytic reduction - Market size and forecast 2025-2030 ($ million)
Chart on Selective catalytic reduction - Year-over-year growth 2025-2030 (%)
Data Table on Selective catalytic reduction - Year-over-year growth 2025-2030 (%)

10.6 Market opportunity by Technology

Market opportunity by Technology ($ million)
Data Table on Market opportunity by Technology ($ million)

11. Customer Landscape

11.1 Customer landscape overview

Analysis of price sensitivity, lifecycle, customer purchase basket, adoption rates, and purchase criteria

12. Geographic Landscape

12.1 Geographic segmentation

Chart on Market share by geography 2025-2030 (%)
Data Table on Market share by geography 2025-2030 (%)

12.2 Geographic comparison

Chart on Geographic comparison
Data Table on Geographic comparison

12.3 APAC - Market size and forecast 2025-2030

Chart on APAC - Market size and forecast 2025-2030 ($ million)
Data Table on APAC - Market size and forecast 2025-2030 ($ million)
Chart on APAC - Year-over-year growth 2025-2030 (%)
Data Table on APAC - Year-over-year growth 2025-2030 (%)
Chart on Regional Comparison - APAC
Data Table on Regional Comparison - APAC

12.3.1 China - Market size and forecast 2025-2030

Chart on China - Market size and forecast 2025-2030 ($ million)
Data Table on China - Market size and forecast 2025-2030 ($ million)
Chart on China - Year-over-year growth 2025-2030 (%)
Data Table on China - Year-over-year growth 2025-2030 (%)

12.3.2 India - Market size and forecast 2025-2030

Chart on India - Market size and forecast 2025-2030 ($ million)
Data Table on India - Market size and forecast 2025-2030 ($ million)
Chart on India - Year-over-year growth 2025-2030 (%)
Data Table on India - Year-over-year growth 2025-2030 (%)

12.3.3 Japan - Market size and forecast 2025-2030

Chart on Japan - Market size and forecast 2025-2030 ($ million)
Data Table on Japan - Market size and forecast 2025-2030 ($ million)
Chart on Japan - Year-over-year growth 2025-2030 (%)
Data Table on Japan - Year-over-year growth 2025-2030 (%)

12.3.4 South Korea - Market size and forecast 2025-2030

Chart on South Korea - Market size and forecast 2025-2030 ($ million)
Data Table on South Korea - Market size and forecast 2025-2030 ($ million)
Chart on South Korea - Year-over-year growth 2025-2030 (%)
Data Table on South Korea - Year-over-year growth 2025-2030 (%)

12.3.5 Australia - Market size and forecast 2025-2030

Chart on Australia - Market size and forecast 2025-2030 ($ million)
Data Table on Australia - Market size and forecast 2025-2030 ($ million)
Chart on Australia - Year-over-year growth 2025-2030 (%)
Data Table on Australia - Year-over-year growth 2025-2030 (%)

12.3.6 Indonesia - Market size and forecast 2025-2030

Chart on Indonesia - Market size and forecast 2025-2030 ($ million)
Data Table on Indonesia - Market size and forecast 2025-2030 ($ million)
Chart on Indonesia - Year-over-year growth 2025-2030 (%)
Data Table on Indonesia - Year-over-year growth 2025-2030 (%)

12.4 North America - Market size and forecast 2025-2030

Chart on North America - Market size and forecast 2025-2030 ($ million)
Data Table on North America - Market size and forecast 2025-2030 ($ million)
Chart on North America - Year-over-year growth 2025-2030 (%)
Data Table on North America - Year-over-year growth 2025-2030 (%)
Chart on Regional Comparison - North America
Data Table on Regional Comparison - North America

12.4.1 US - Market size and forecast 2025-2030

Chart on US - Market size and forecast 2025-2030 ($ million)
Data Table on US - Market size and forecast 2025-2030 ($ million)
Chart on US - Year-over-year growth 2025-2030 (%)
Data Table on US - Year-over-year growth 2025-2030 (%)

12.4.2 Canada - Market size and forecast 2025-2030

Chart on Canada - Market size and forecast 2025-2030 ($ million)
Data Table on Canada - Market size and forecast 2025-2030 ($ million)
Chart on Canada - Year-over-year growth 2025-2030 (%)
Data Table on Canada - Year-over-year growth 2025-2030 (%)

12.4.3 Mexico - Market size and forecast 2025-2030

Chart on Mexico - Market size and forecast 2025-2030 ($ million)
Data Table on Mexico - Market size and forecast 2025-2030 ($ million)
Chart on Mexico - Year-over-year growth 2025-2030 (%)
Data Table on Mexico - Year-over-year growth 2025-2030 (%)

12.5 Europe - Market size and forecast 2025-2030

Chart on Europe - Market size and forecast 2025-2030 ($ million)
Data Table on Europe - Market size and forecast 2025-2030 ($ million)
Chart on Europe - Year-over-year growth 2025-2030 (%)
Data Table on Europe - Year-over-year growth 2025-2030 (%)
Chart on Regional Comparison - Europe
Data Table on Regional Comparison - Europe

12.5.1 Germany - Market size and forecast 2025-2030

Chart on Germany - Market size and forecast 2025-2030 ($ million)
Data Table on Germany - Market size and forecast 2025-2030 ($ million)
Chart on Germany - Year-over-year growth 2025-2030 (%)
Data Table on Germany - Year-over-year growth 2025-2030 (%)

12.5.2 UK - Market size and forecast 2025-2030

Chart on UK - Market size and forecast 2025-2030 ($ million)
Data Table on UK - Market size and forecast 2025-2030 ($ million)
Chart on UK - Year-over-year growth 2025-2030 (%)
Data Table on UK - Year-over-year growth 2025-2030 (%)

12.5.3 France - Market size and forecast 2025-2030

Chart on France - Market size and forecast 2025-2030 ($ million)
Data Table on France - Market size and forecast 2025-2030 ($ million)
Chart on France - Year-over-year growth 2025-2030 (%)
Data Table on France - Year-over-year growth 2025-2030 (%)

12.5.4 Italy - Market size and forecast 2025-2030

Chart on Italy - Market size and forecast 2025-2030 ($ million)
Data Table on Italy - Market size and forecast 2025-2030 ($ million)
Chart on Italy - Year-over-year growth 2025-2030 (%)
Data Table on Italy - Year-over-year growth 2025-2030 (%)

12.5.5 Spain - Market size and forecast 2025-2030

Chart on Spain - Market size and forecast 2025-2030 ($ million)
Data Table on Spain - Market size and forecast 2025-2030 ($ million)
Chart on Spain - Year-over-year growth 2025-2030 (%)
Data Table on Spain - Year-over-year growth 2025-2030 (%)

12.5.6 The Netherlands - Market size and forecast 2025-2030

Chart on The Netherlands - Market size and forecast 2025-2030 ($ million)
Data Table on The Netherlands - Market size and forecast 2025-2030 ($ million)
Chart on The Netherlands - Year-over-year growth 2025-2030 (%)
Data Table on The Netherlands - Year-over-year growth 2025-2030 (%)

12.6 Middle East and Africa - Market size and forecast 2025-2030

Chart on Middle East and Africa - Market size and forecast 2025-2030 ($ million)
Data Table on Middle East and Africa - Market size and forecast 2025-2030 ($ million)
Chart on Middle East and Africa - Year-over-year growth 2025-2030 (%)
Data Table on Middle East and Africa - Year-over-year growth 2025-2030 (%)
Chart on Regional Comparison - Middle East and Africa
Data Table on Regional Comparison - Middle East and Africa

12.6.1 Saudi Arabia - Market size and forecast 2025-2030

Chart on Saudi Arabia - Market size and forecast 2025-2030 ($ million)
Data Table on Saudi Arabia - Market size and forecast 2025-2030 ($ million)
Chart on Saudi Arabia - Year-over-year growth 2025-2030 (%)
Data Table on Saudi Arabia - Year-over-year growth 2025-2030 (%)

12.6.2 UAE - Market size and forecast 2025-2030

Chart on UAE - Market size and forecast 2025-2030 ($ million)
Data Table on UAE - Market size and forecast 2025-2030 ($ million)
Chart on UAE - Year-over-year growth 2025-2030 (%)
Data Table on UAE - Year-over-year growth 2025-2030 (%)

12.6.3 Egypt - Market size and forecast 2025-2030

Chart on Egypt - Market size and forecast 2025-2030 ($ million)
Data Table on Egypt - Market size and forecast 2025-2030 ($ million)
Chart on Egypt - Year-over-year growth 2025-2030 (%)
Data Table on Egypt - Year-over-year growth 2025-2030 (%)

12.6.4 South Africa - Market size and forecast 2025-2030

Chart on South Africa - Market size and forecast 2025-2030 ($ million)
Data Table on South Africa - Market size and forecast 2025-2030 ($ million)
Chart on South Africa - Year-over-year growth 2025-2030 (%)
Data Table on South Africa - Year-over-year growth 2025-2030 (%)

12.6.5 Turkey - Market size and forecast 2025-2030

Chart on Turkey - Market size and forecast 2025-2030 ($ million)
Data Table on Turkey - Market size and forecast 2025-2030 ($ million)
Chart on Turkey - Year-over-year growth 2025-2030 (%)
Data Table on Turkey - Year-over-year growth 2025-2030 (%)

12.7 South America - Market size and forecast 2025-2030

Chart on South America - Market size and forecast 2025-2030 ($ million)
Data Table on South America - Market size and forecast 2025-2030 ($ million)
Chart on South America - Year-over-year growth 2025-2030 (%)
Data Table on South America - Year-over-year growth 2025-2030 (%)
Chart on Regional Comparison - South America
Data Table on Regional Comparison - South America

12.7.1 Brazil - Market size and forecast 2025-2030

Chart on Brazil - Market size and forecast 2025-2030 ($ million)
Data Table on Brazil - Market size and forecast 2025-2030 ($ million)
Chart on Brazil - Year-over-year growth 2025-2030 (%)
Data Table on Brazil - Year-over-year growth 2025-2030 (%)

12.7.2 Argentina - Market size and forecast 2025-2030

Chart on Argentina - Market size and forecast 2025-2030 ($ million)
Data Table on Argentina - Market size and forecast 2025-2030 ($ million)
Chart on Argentina - Year-over-year growth 2025-2030 (%)
Data Table on Argentina - Year-over-year growth 2025-2030 (%)

12.7.3 Chile - Market size and forecast 2025-2030

Chart on Chile - Market size and forecast 2025-2030 ($ million)
Data Table on Chile - Market size and forecast 2025-2030 ($ million)
Chart on Chile - Year-over-year growth 2025-2030 (%)
Data Table on Chile - Year-over-year growth 2025-2030 (%)

12.8 Market opportunity by geography

Market opportunity by geography ($ million)
Data Tables on Market opportunity by geography ($ million)

13. Drivers, Challenges, and Opportunity

13.1 Market drivers

Stringent regulatory frameworks and compliance mandates
Acceleration of industrial decarbonization and net-zero policies
Rising public health awareness and toxic emission control

13.2 Market challenges

High capital expenditure and operational costs
Regulatory inconsistency and policy uncertainty
Supply chain constraints and critical material shortages

13.3 Impact of drivers and challenges

Impact of drivers and challenges in 2025 and 2030

13.4 Market opportunities

Strategic rebranding and integration of decarbonization portfolios
Adoption of lifecycle service models and digital twin technology
Advancement of energy-efficient and high-purity filtration architectures

14. Competitive Landscape

14.1 Overview

14.2

Overview on criticality of inputs and factors of differentiation

14.3 Landscape disruption

Overview on factors of disruption

14.4 Industry risks

Impact of key risks on business

15. Competitive Analysis

15.1 Companies profiled

Companies covered

15.2 Company ranking index

15.3 Market positioning of companies

Matrix on companies position and classification

15.4 Ahlstrom Oyj

Ahlstrom Oyj - Overview
Ahlstrom Oyj - Product / Service
Ahlstrom Oyj - Key news
Ahlstrom Oyj - Key offerings
SWOT

15.5 Andritz AG

Andritz AG - Overview
Andritz AG - Business segments
Andritz AG - Key news
Andritz AG - Key offerings
Andritz AG - Segment focus
SWOT

15.6 Babcock and Wilcox

Babcock and Wilcox - Overview
Babcock and Wilcox - Business segments
Babcock and Wilcox - Key news
Babcock and Wilcox - Key offerings
Babcock and Wilcox - Segment focus
SWOT

15.7 Donaldson Co. Inc.

Donaldson Co. Inc. - Overview
Donaldson Co. Inc. - Business segments
Donaldson Co. Inc. - Key news
Donaldson Co. Inc. - Key offerings
Donaldson Co. Inc. - Segment focus
SWOT

15.8 Doosan Lentjes GmbH

Doosan Lentjes GmbH - Overview
Doosan Lentjes GmbH - Product / Service
Doosan Lentjes GmbH - Key news
Doosan Lentjes GmbH - Key offerings
SWOT

15.9 DuPont de Nemours Inc.

DuPont de Nemours Inc. - Overview
DuPont de Nemours Inc. - Business segments
DuPont de Nemours Inc. - Key news
DuPont de Nemours Inc. - Key offerings
DuPont de Nemours Inc. - Segment focus
SWOT

15.10 Elessent Clean Technologies Inc

Elessent Clean Technologies Inc - Overview
Elessent Clean Technologies Inc - Product / Service
Elessent Clean Technologies Inc - Key offerings
SWOT

15.11 Freudenberg and Co. KG

Freudenberg and Co. KG - Overview
Freudenberg and Co. KG - Product / Service
Freudenberg and Co. KG - Key news
Freudenberg and Co. KG - Key offerings
SWOT

15.12 GEA Group AG

GEA Group AG - Overview
GEA Group AG - Business segments
GEA Group AG - Key offerings
GEA Group AG - Segment focus
SWOT

15.13 General Electric Co.

General Electric Co. - Overview
General Electric Co. - Business segments
General Electric Co. - Key news
General Electric Co. - Key offerings
General Electric Co. - Segment focus
SWOT

15.14 Mitsubishi Heavy Ltd.

Mitsubishi Heavy Ltd. - Overview
Mitsubishi Heavy Ltd. - Business segments
Mitsubishi Heavy Ltd. - Key news
Mitsubishi Heavy Ltd. - Key offerings
Mitsubishi Heavy Ltd. - Segment focus
SWOT

15.15 MITTAL BLOWERS INDIA PVT. LTD.

MITTAL BLOWERS INDIA PVT. LTD. - Overview
MITTAL BLOWERS INDIA PVT. LTD. - Product / Service
MITTAL BLOWERS INDIA PVT. LTD. - Key offerings
SWOT

15.16 Parker Hannifin Corp.

Parker Hannifin Corp. - Overview
Parker Hannifin Corp. - Business segments
Parker Hannifin Corp. - Key offerings
Parker Hannifin Corp. - Segment focus
SWOT

15.17 Sumitomo Corp.

Sumitomo Corp. - Overview
Sumitomo Corp. - Business segments
Sumitomo Corp. - Key offerings
Sumitomo Corp. - Segment focus
SWOT

15.18 Thermax Ltd.

Thermax Ltd. - Overview
Thermax Ltd. - Business segments
Thermax Ltd. - Key news
Thermax Ltd. - Key offerings
Thermax Ltd. - Segment focus
SWOT

16. Appendix

16.1 Scope of the report

Market definition
Objectives
Notes and caveats

16.2 Inclusions and exclusions checklist

Inclusions checklist
Exclusions checklist

16.3 Currency conversion rates for US$

16.4 Research methodology

16.5 Data procurement

Information sources

16.6 Data validation

16.7 Validation techniques employed for market sizing

16.8 Data synthesis

16.9 360 degree market analysis

16.10 List of abbreviations

Research Methodology

Technavio presents a detailed picture of the market by way of study, synthesis, and summation of data from multiple sources. The analysts have presented the various facets of the market with a particular focus on identifying the key industry influencers. The data thus presented is comprehensive, reliable, and the result of extensive research, both primary and secondary.

INFORMATION SOURCES

Primary sources

  • Manufacturers and suppliers
  • Channel partners
  • Industry experts
  • Strategic decision makers

Secondary sources

  • Industry journals and periodicals
  • Government data
  • Financial reports of key industry players
  • Historical data
  • Press releases

DATA ANALYSIS

Data Synthesis

  • Collation of data
  • Estimation of key figures
  • Analysis of derived insights

Data Validation

  • Triangulation with data models
  • Reference against proprietary databases
  • Corroboration with industry experts

REPORT WRITING

Qualitative

  • Market drivers
  • Market challenges
  • Market trends
  • Five forces analysis

Quantitative

  • Market size and forecast
  • Market segmentation
  • Geographical insights
  • Competitive landscape

Interested in this report?

Get your sample now to see our research methodology and insights!

Download Now

Frequently Asked Questions

Air Pollution Control market growth will increase by USD 60756.4 million during 2026-2030.

The Air Pollution Control market is expected to grow at a CAGR of 8.6% during 2026-2030.

Air Pollution Control market is segmented by End-user (Power, Industries, Others) Product (Scrubbers, Catalyst converters, Others) Technology (Flue gas desulfurization, Baghouse systems, Selective catalytic reduction)

Ahlstrom Oyj, Airex Industries Inc., American Air Filter Co. Inc., Andritz AG, Babcock and Wilcox, Camfil AB, Donaldson Co. Inc., Doosan Lentjes GmbH, DuPont de Nemours Inc., Elessent Clean Technologies Inc, Freudenberg and Co. KG, GEA Group AG, General Electric Co., John Wood Group PLC, Mitsubishi Heavy Ltd., MITTAL BLOWERS INDIA PVT. LTD., Parker Hannifin Corp., Sumitomo Corp., Thermax Ltd. are a few of the key vendors in the Air Pollution Control market.

APAC will register the highest growth rate of 39.5% among the other regions. Therefore, the Air Pollution Control market in APAC is expected to garner significant business opportunities for the vendors during the forecast period.

China, India, Japan, South Korea, Australia, Indonesia, US, Canada, Mexico, Germany, UK, France, Italy, Spain, The Netherlands, Saudi Arabia, UAE, Egypt, South Africa, Turkey, Brazil, Argentina, Chile

  • Stringent regulatory frameworks and compliance mandates is the driving factor this market.

The Air Pollution Control market vendors should focus on grabbing business opportunities from the End-user segment as it accounted for the largest market share in the base year.
RIA - Research AI Assistant
Ask RIA