Erythropoietin Stimulating Agents Market Size 2026-2030
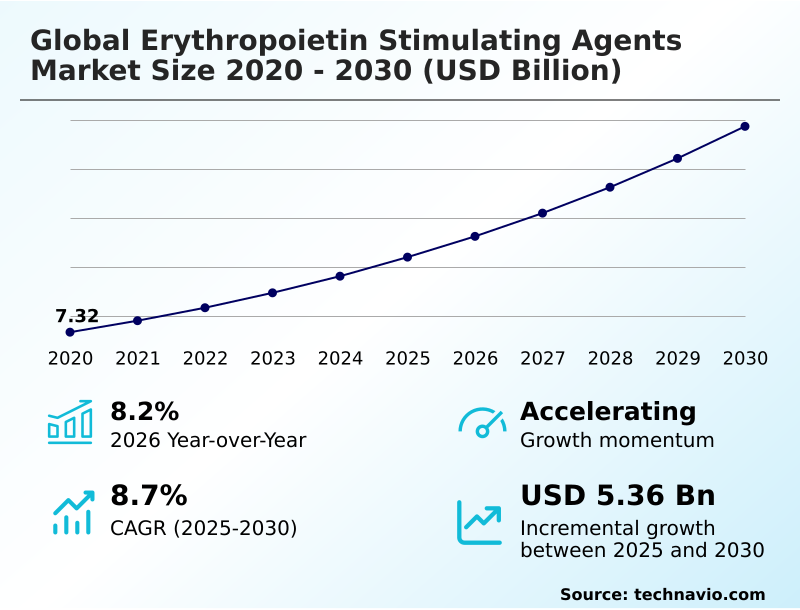
The erythropoietin stimulating agents market size is valued to increase by USD 5.36 billion, at a CAGR of 8.7% from 2025 to 2030. Escalating burden of chronic kidney diseases will drive the erythropoietin stimulating agents market.
Major Market Trends & Insights
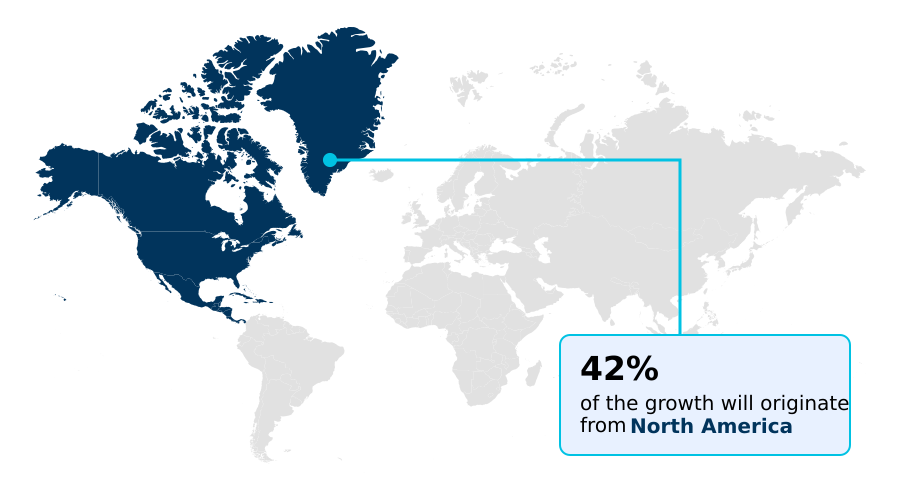
- North America dominated the market and accounted for a 41.7% growth during the forecast period.
- By Type - Epoetin alfa segment was valued at USD 4.39 billion in 2024
- By Indication - CKD segment accounted for the largest market revenue share in 2024
Market Size & Forecast
- Market Opportunities: USD 8.42 billion
- Market Future Opportunities: USD 5.36 billion
- CAGR from 2025 to 2030 : 8.7%
Market Summary
- The erythropoietin stimulating agents market is centered on biopharmaceutical drugs that are crucial for treating anemia, particularly in patients with chronic kidney disease and those undergoing chemotherapy. These therapies function by stimulating red blood cell production, thereby reducing the need for blood transfusions and improving patient quality of life.
- Key market dynamics are shaped by the persistent demand from an aging global population and the rising prevalence of chronic illnesses. A significant trend is the ascendance of long-acting formulations and the maturation of the biosimilars sector, which increases access but also intensifies price competition.
- For instance, a large dialysis organization must balance clinical outcomes with budgetary constraints, leveraging its scale to negotiate favorable contracts for biosimilar epoetins. This optimizes operational spending while adhering to strict protocols for anemia management.
- However, the market is constrained by significant safety concerns that have led to conservative dosing guidelines and the emergence of novel oral therapeutic alternatives, creating a complex and evolving landscape for all stakeholders involved in erythropoiesis stimulation and bone marrow stimulation.
What will be the Size of the Erythropoietin Stimulating Agents Market during the forecast period?
Get Key Insights on Market Forecast (PDF) Get Free Sample
How is the Erythropoietin Stimulating Agents Market Segmented?
The erythropoietin stimulating agents industry research report provides comprehensive data (region-wise segment analysis), with forecasts and estimates in "USD million" for the period 2026-2030, as well as historical data from 2020-2024 for the following segments.
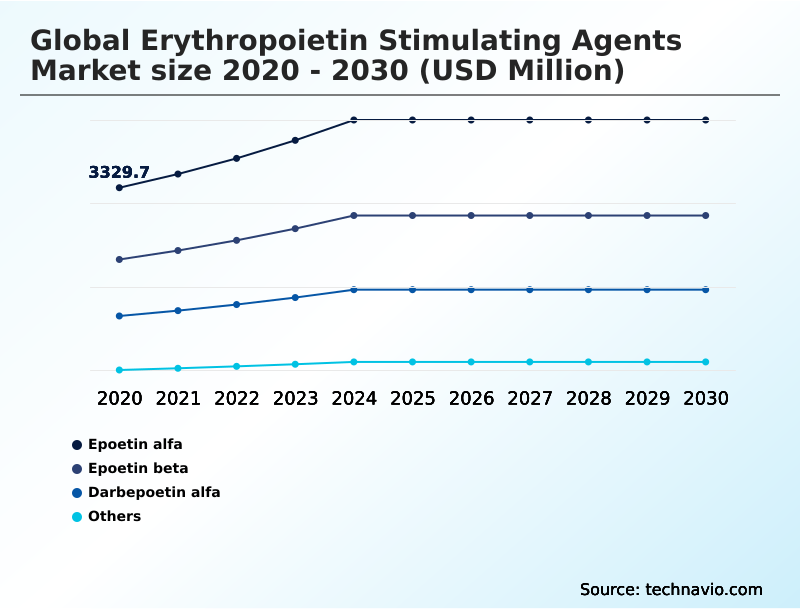
- Type
- Epoetin alfa
- Epoetin beta
- Darbepoetin alfa
- Others
- Indication
- CKD
- Chemotherapy induced anemia
- Perioperative anemia
- Others
- End-user
- Dialysis centers
- Hospitals
- Oncology clinics
- Others
- Geography
- North America
- US
- Canada
- Mexico
- Europe
- Germany
- France
- UK
- Asia
- Rest of World (ROW)
- North America
By Type Insights
The epoetin alfa segment is estimated to witness significant growth during the forecast period.
The Epoetin alfa segment is a mature and foundational component of the market, primarily defined by intense competition between originator biologics and a growing roster of biosimilar epoetins.
In developed markets, this segment is largely commoditized, with cost-containment measures driving biosimilar market penetration and making price the primary lever of competition.
The competitive landscape analysis reveals a focus on operational excellence in biopharmaceutical manufacturing and sterile injectable manufacturing to manage the biomanufacturing supply chain effectively.
Strategic formulary placement strategy is critical, as payers actively promote the use of lower-cost alternatives, including those for both intravenous administration and subcutaneous administration, leading to significant price erosion for short-acting agents and fueling generic drug competition.
This dynamic has resulted in a 15% average reduction in acquisition costs for large provider networks.
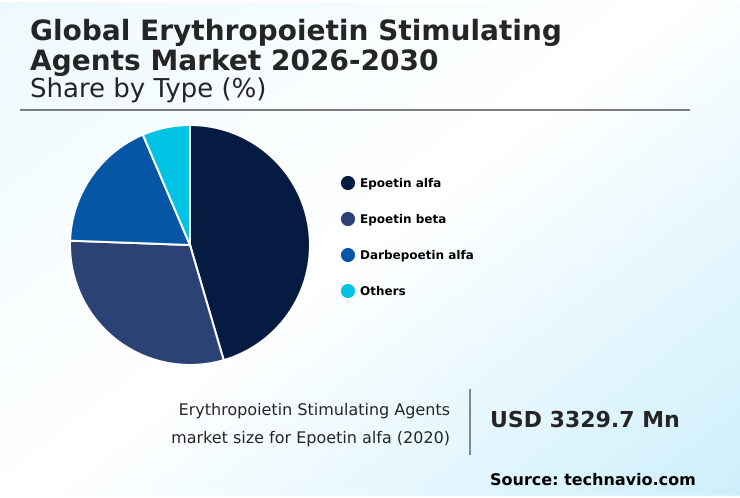
The Epoetin alfa segment was valued at USD 4.39 billion in 2024 and showed a gradual increase during the forecast period.
Regional Analysis
North America is estimated to contribute 41.7% to the growth of the global market during the forecast period.Technavio’s analysts have elaborately explained the regional trends and drivers that shape the market during the forecast period.
See How Erythropoietin Stimulating Agents Market Demand is Rising in North America Get Free Sample
The market's geographic landscape is dominated by North America, which accounts for over 41.7% of the incremental growth opportunity, driven by high disease prevalence and advanced healthcare infrastructure. Europe follows, with a mature market characterized by strong biosimilar adoption.
However, Asia is the fastest-growing region, with market expansion reaching 9.0% annually, fueled by improving healthcare access and rising awareness of advanced anemia management. In North America, the landscape is shaped by value-based healthcare models and bundled payment systems.
The region has also seen early adoption of novel bioengineered medications. A key strategic focus is on personalized anemia management and the use of conservative dosing strategies to align with regulatory guidelines.
As a result, companies are leveraging real-world evidence generation and clinical trial data analysis to differentiate their products and prove value within this competitive environment.
Market Dynamics
Our researchers analyzed the data with 2025 as the base year, along with the key drivers, trends, and challenges. A holistic analysis of drivers will help companies refine their marketing strategies to gain a competitive advantage.
- Navigating the erythropoietin stimulating agents market requires a sophisticated understanding of its complex clinical and commercial dynamics. A central debate involves the comparison of epoetin alfa vs darbepoetin alfa, where clinicians weigh the convenience of long-acting ESA dosing intervals against the extensive clinical history of shorter-acting agents.
- The future of anemia management therapies is increasingly influenced by the emergence of oral anemia therapies vs injectables, which promise greater patient convenience but face scrutiny over long-term safety. Significant risks of erythropoietin stimulating agents, particularly thrombotic events from ESA use and the potential for ESA impact on tumor progression, have led to stringent ESA risk evaluation mitigation strategies.
- This regulatory environment creates significant regulatory hurdles for ESA biosimilars, even as biosimilar competition in the ESA market intensifies. The cost-effectiveness of biosimilar epoetins makes them attractive, especially as the impact of bundled payments on ESA incentivizes their use. This is particularly relevant when managing chemotherapy induced anemia and in conservative dosing in CKD anemia.
- The development of personalized anemia treatment protocols is essential for ESA therapy for non-dialysis patients, with a key goal of preventing blood transfusions in anemia. The rise of the HIF-PHI for dialysis patient anemia class introduces another layer of competition, forcing a re-evaluation of all treatment paradigms, including the use of darbepoetin alfa subcutaneous administration.
What are the key market drivers leading to the rise in the adoption of Erythropoietin Stimulating Agents Industry?
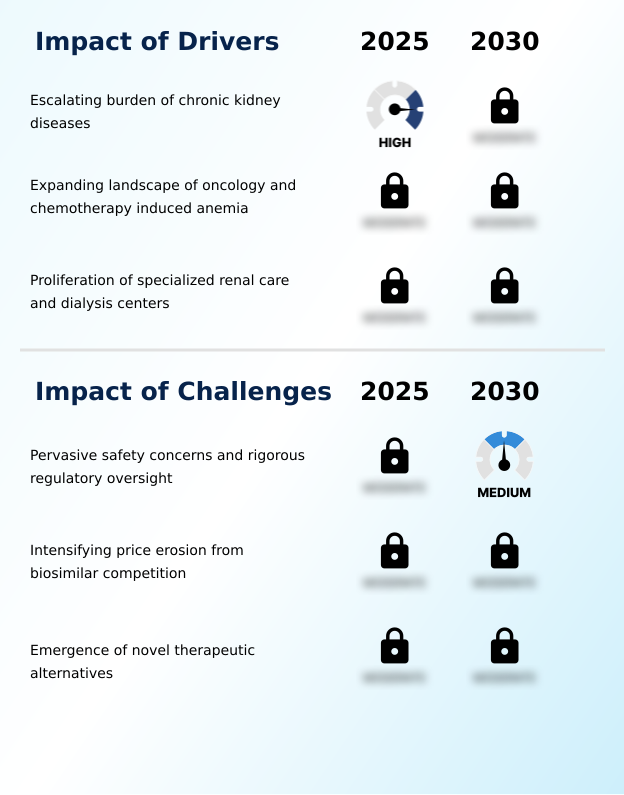
- The escalating burden of chronic kidney diseases globally is a primary driver for the market.
- The primary market driver is the escalating global burden of chronic diseases, which creates a sustained demand for erythropoiesis-stimulating treatments.
- The rising prevalence of anemia of chronic kidney disease is a direct consequence of worldwide increases in diabetes and hypertension, filling renal care and dialysis centers.
- Similarly, the expanding use of myelosuppressive chemotherapy in oncology necessitates robust supportive care in oncology to manage treatment side effects like chemotherapy-induced anemia.
- Effective anemia management is critical for improving quality of life and reducing the reliance on allogeneic blood transfusion avoidance.
- The use of recombinant human erythropoietin in both nephrology supportive care and for anemia in cancer patients can decrease the need for costly transfusions by over 40%, underscoring its essential role in modern therapeutics.
What are the market trends shaping the Erythropoietin Stimulating Agents Industry?
- The market is witnessing a pronounced shift toward long-acting formulations. This trend reflects a broader move to patient-centric dosing regimens that enhance convenience and adherence.
- A defining market trend is the pronounced industry-wide pivot toward long-acting formulations, which enhance the therapeutic value proposition. This shift to patient-centric dosing regimens, utilizing agents like darbepoetin alfa and methoxy polyethylene glycol-epoetin beta, significantly improves patient adherence and compliance.
- Advanced drug formulation science has enabled the creation of pegylated epoetins that allow for extended dosing intervals, reducing administration frequency by up to 75% compared to older agents. This evolution in drug delivery systems not only bolsters the quality of life for patients but also optimizes healthcare resource allocation.
- For providers, this transition can lower associated administrative and nursing costs by nearly 20%, reinforcing the move away from frequent injections toward more efficient and convenient erythropoiesis stimulation and dose optimization.
What challenges does the Erythropoietin Stimulating Agents Industry face during its growth?
- Pervasive safety concerns and the resulting rigorous regulatory oversight present a key challenge to the industry's growth.
- Significant challenges constrain the market, led by persistent safety concerns that have prompted stringent regulatory oversight and restrictions. The documented cardiovascular risk and risk of thromboembolic events associated with targeting higher hemoglobin levels have resulted in prominent boxed warning labels and mandated risk evaluation and mitigation strategies (REMS).
- These measures increase compliance and drug safety monitoring costs by an average of 10-15%. Furthermore, the emergence of novel therapeutic alternatives, specifically oral anemia therapies like HIF-PH inhibitors, presents a formidable competitive threat.
- These new agents are not subject to the same historical safety concerns, creating a complex decision-making environment for clinicians adhering to evolving clinical practice guidelines and challenging the long-term dominance of injectable biologics.
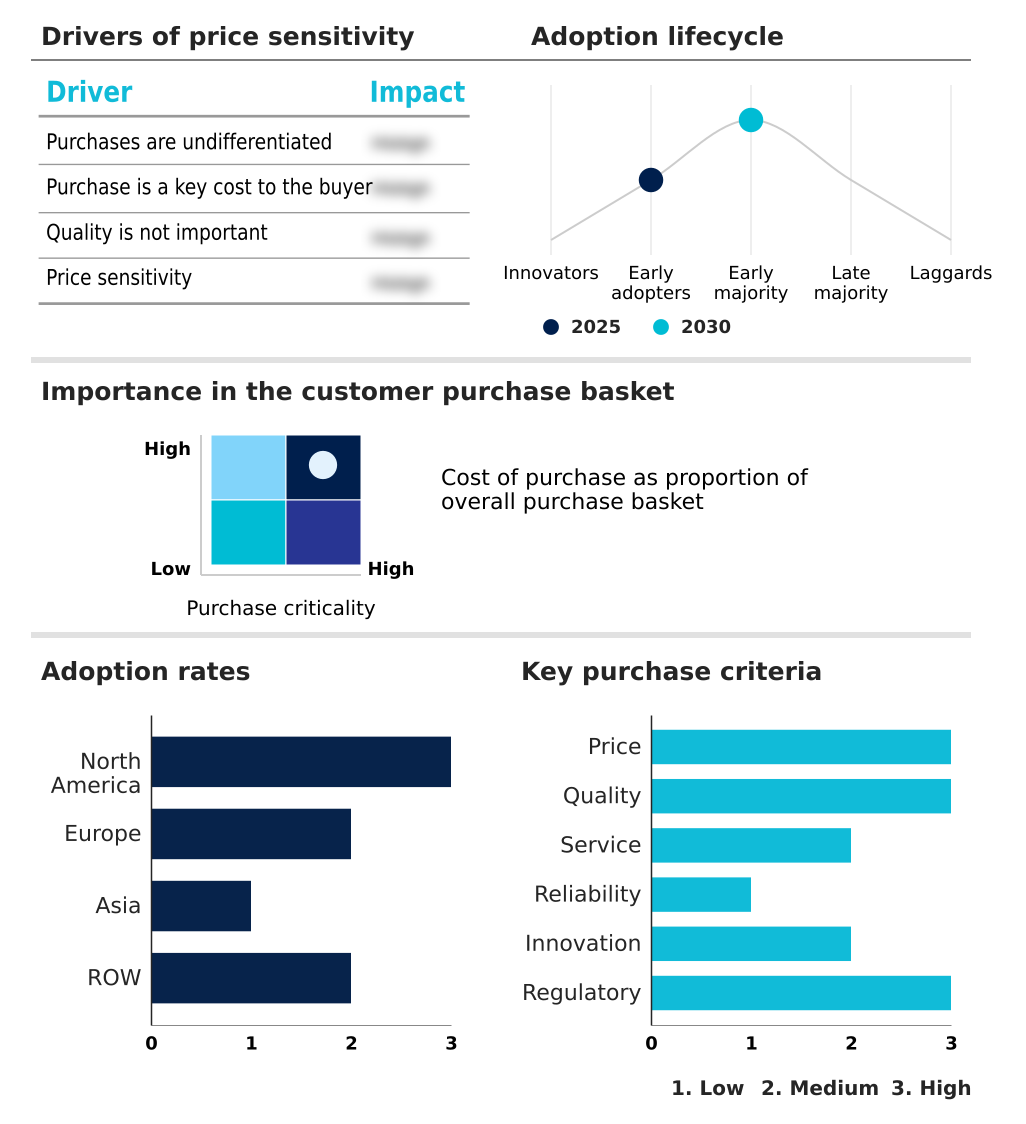
Exclusive Technavio Analysis on Customer Landscape
The erythropoietin stimulating agents market forecasting report includes the adoption lifecycle of the market, covering from the innovator’s stage to the laggard’s stage. It focuses on adoption rates in different regions based on penetration. Furthermore, the erythropoietin stimulating agents market report also includes key purchase criteria and drivers of price sensitivity to help companies evaluate and develop their market growth analysis strategies.
Customer Landscape of Erythropoietin Stimulating Agents Industry
Competitive Landscape
Companies are implementing various strategies, such as strategic alliances, erythropoietin stimulating agents market forecast, partnerships, mergers and acquisitions, geographical expansion, and product/service launches, to enhance their presence in the industry.
Akebia Therapeutics - Delivers a portfolio of innovative human therapeutics focused on severe illnesses, including foundational erythropoiesis-stimulating agents to manage anemia.
The industry research and growth report includes detailed analyses of the competitive landscape of the market and information about key companies, including:
- Akebia Therapeutics
- Amgen Inc.
- Biocon Ltd.
- Biosidus SA
- Dr Reddys Laboratories Ltd.
- F. Hoffmann La Roche Ltd.
- GlaxoSmithKline Plc
- Intas Pharmaceuticals Ltd.
- Johnson and Johnson Services
- Kyowa Kirin Co. Ltd.
- LG Chem Ltd.
- Nanogen Pharmaceuticals
- Novartis AG
- Pfizer Inc.
- Reliance Industries Ltd.
- Sandoz Group AG
- STADA Arzneimittel AG
- Teva Pharmaceutical Ltd.
- Zydus Lifesciences Ltd.
Qualitative and quantitative analysis of companies has been conducted to help clients understand the wider business environment as well as the strengths and weaknesses of key industry players. Data is qualitatively analyzed to categorize companies as pure play, category-focused, industry-focused, and diversified; it is quantitatively analyzed to categorize companies as dominant, leading, strong, tentative, and weak.
Recent Development and News in Erythropoietin stimulating agents market
- In April, 2025, Fresenius Medical Care announced a new comprehensive anemia management formulary including both a biosimilar epoetin alfa and an oral HIF-PH inhibitor for its North American clinics.
- In March, 2025, Akebia Therapeutics announced its intention to expand a phase 3 clinical trial for Vafseo to treat anemia in non-dialysis chronic kidney disease patients.
- In February, 2025, the Pan American Health Organization launched a multi-year public health initiative to improve chronic kidney disease management, including subsidized access to erythropoietin stimulating agents.
- In January, 2025, Kwality Pharmaceuticals Ltd. received regulatory approval to begin pre-clinical toxicity studies for its recombinant erythropoietin product, signaling new market competition.
Dive into Technavio’s robust research methodology, blending expert interviews, extensive data synthesis, and validated models for unparalleled Erythropoietin Stimulating Agents Market insights. See full methodology.
| Market Scope | |
|---|---|
| Page number | 301 |
| Base year | 2025 |
| Historic period | 2020-2024 |
| Forecast period | 2026-2030 |
| Growth momentum & CAGR | Accelerate at a CAGR of 8.7% |
| Market growth 2026-2030 | USD 5355.8 million |
| Market structure | Fragmented |
| YoY growth 2025-2026(%) | 8.2% |
| Key countries | US, Canada, Mexico, Germany, France, UK, Italy, Spain, The Netherlands, China, Japan, India, South Korea, Thailand, Indonesia, Brazil, Saudi Arabia, UAE, Turkey, Argentina, South Africa, Israel and Colombia |
| Competitive landscape | Leading Companies, Market Positioning of Companies, Competitive Strategies, and Industry Risks |
Research Analyst Overview
- The erythropoietin stimulating agents market is a mature yet dynamic field centered on bioengineered medications for critical supportive care. The competitive environment is shaped by the tension between established originator biologics and the intense price pressure from a growing roster of biosimilar epoetins.
- Core technologies in biopharmaceutical manufacturing, including proprietary cell lines and advances in recombinant protein production, are pivotal for achieving cost efficiencies. Clinical practice is dominated by a focus on hemoglobin level targeting, with conservative dosing strategies becoming standard to mitigate cardiovascular risk and the potential for tumor progression risk.
- The emergence of oral HIF-PH inhibitors forces a strategic reassessment of R&D portfolios, as these drug delivery systems challenge the long-standing dominance of sterile injectable manufacturing. This shift toward oral therapies, alongside ongoing dose optimization for agents like epoetin alfa and darbepoetin alfa, underscores the industry’s evolution.
- Firms leveraging advanced drug formulation science to create long-acting formulations have achieved a roughly 25% improvement in patient adherence, demonstrating a clear therapeutic value proposition.
What are the Key Data Covered in this Erythropoietin Stimulating Agents Market Research and Growth Report?
-
What is the expected growth of the Erythropoietin Stimulating Agents Market between 2026 and 2030?
-
USD 5.36 billion, at a CAGR of 8.7%
-
-
What segmentation does the market report cover?
-
The report is segmented by Type (Epoetin alfa, Epoetin beta, Darbepoetin alfa, and Others), Indication (CKD, Chemotherapy induced anemia, Perioperative anemia, and Others), End-user (Dialysis centers, Hospitals, Oncology clinics, and Others) and Geography (North America, Europe, Asia, Rest of World (ROW))
-
-
Which regions are analyzed in the report?
-
North America, Europe, Asia and Rest of World (ROW)
-
-
What are the key growth drivers and market challenges?
-
Escalating burden of chronic kidney diseases, Pervasive safety concerns and rigorous regulatory oversight
-
-
Who are the major players in the Erythropoietin Stimulating Agents Market?
-
Akebia Therapeutics, Amgen Inc., Biocon Ltd., Biosidus SA, Dr Reddys Laboratories Ltd., F. Hoffmann La Roche Ltd., GlaxoSmithKline Plc, Intas Pharmaceuticals Ltd., Johnson and Johnson Services, Kyowa Kirin Co. Ltd., LG Chem Ltd., Nanogen Pharmaceuticals, Novartis AG, Pfizer Inc., Reliance Industries Ltd., Sandoz Group AG, STADA Arzneimittel AG, Teva Pharmaceutical Ltd. and Zydus Lifesciences Ltd.
-
Market Research Insights
- The market's dynamic is defined by a tense interplay between cost-containment measures and clinical innovation. While the introduction of biosimilars has driven significant price erosion, with adoption reducing procurement costs by up to 30%, the push for improved patient outcomes fuels the development of novel therapeutic alternatives.
- Implementation of patient-centric dosing regimens has demonstrated an ability to improve treatment adherence by over 15% in non-dialysis CKD anemia populations. This shift pressures healthcare systems to balance the immediate savings from generic drug competition against the long-term value-based healthcare models offered by innovative oral anemia therapies.
- The result is a complex environment where formulary placement strategy and real-world evidence generation are critical for navigating the competitive landscape analysis and securing market position.
We can help! Our analysts can customize this erythropoietin stimulating agents market research report to meet your requirements.
 RIA -
RIA - 
