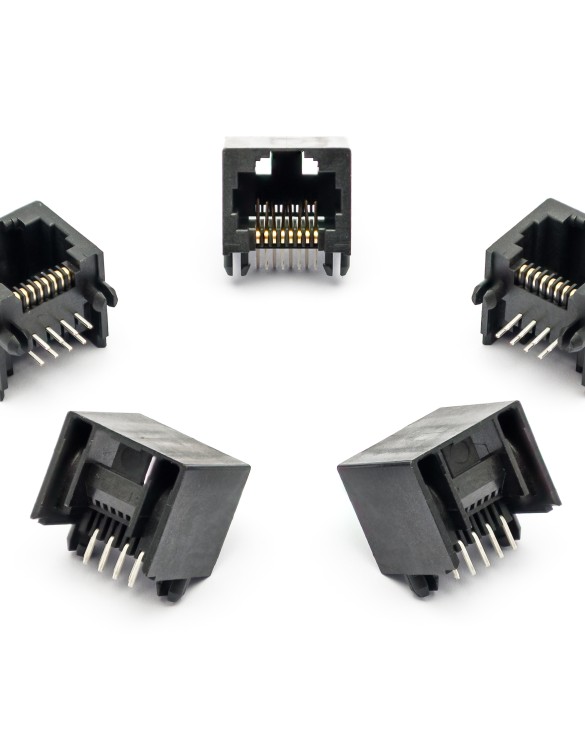
Ethernet Connector And Transformer Market Analysis, Size, and Forecast 2026-2030: APAC (China, Japan, and India), North America (US, Canada, and Mexico), Europe (Germany, UK, and France), South America (Brazil, Argentina, and Chile), Middle East and Africa (Saudi Arabia, UAE, and South Africa), and Rest of World (ROW)

Ethernet Connector And Transformer Market Analysis, Size, and Forecast 2026-2030:
APAC (China, Japan, and India), North America (US, Canada, and Mexico), Europe (Germany, UK, and France), South America (Brazil, Argentina, and Chile), Middle East and Africa (Saudi Arabia, UAE, and South Africa), and Rest of World (ROW)

Published: Oct 2026 308 Pages SKU: IRTNTR81714

Market Overview at a Glance

$437 Mn
Market Opportunity
6.1%
CAGR 2025 - 2030
44.5%
APAC Growth
$815.6 Mn
Ethernet connectors segment 2024

Ethernet Connector And Transformer Market Size 2026-2030

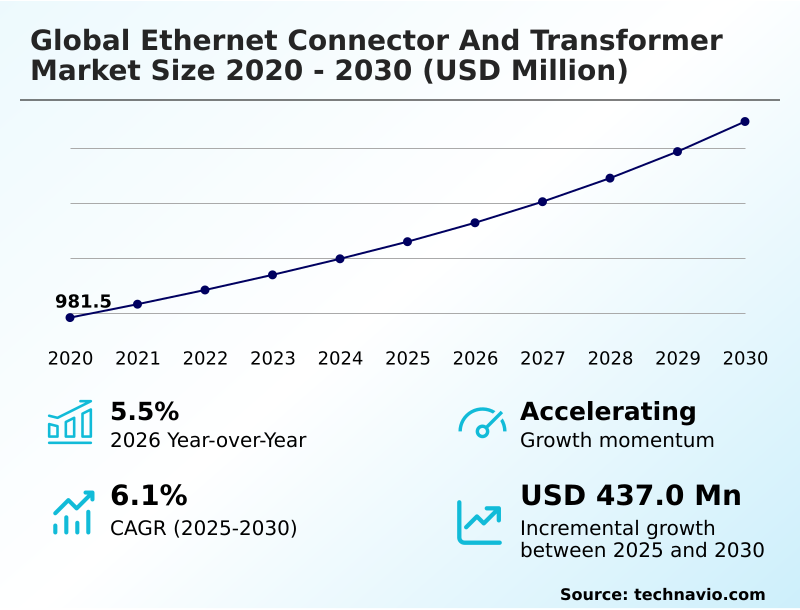
The ethernet connector and transformer market size is valued to increase by USD 437 million, at a CAGR of 6.1% from 2025 to 2030. Industrial automation and rise of industry 4.0 will drive the ethernet connector and transformer market.

Major Market Trends & Insights

  • APAC dominated the market and accounted for a 44.5% growth during the forecast period.
  • By Type - Ethernet connectors segment was valued at USD 815.6 million in 2024
  • By Product Type - RJ45 segment accounted for the largest market revenue share in 2024

Market Size & Forecast

  • Market Opportunities: USD 713 million
  • Market Future Opportunities: USD 437 million
  • CAGR from 2025 to 2030 : 6.1%

Market Summary

  • The Ethernet Connector And Transformer ecosystem dictates the structural reliability of high-speed data communications across enterprise and industrial infrastructures. Market momentum is heavily driven by the widespread transition toward smart manufacturing, which forces facilities to replace legacy serial communication protocols with real-time, high-bandwidth networks.
  • This operational upgrade necessitates ruggedized interfaces providing superior shielding to resist severe mechanical vibration and moisture ingress. For instance, textile production facilities upgrading to automated robotic coordination have achieved a 25% reduction in signal latency by deploying specialized magnetic components. Despite these efficiency gains, the sector faces substantial limitations due to ongoing resource constraints.
  • Fluctuating costs for specialized ferrite cores and copper consistently disrupt production planning, pressuring component manufacturers to invest heavily in alternative sourcing strategies. Successfully balancing these procurement hurdles against the escalating demand for flawless data delivery remains critical for sustaining continuous operational uptime and ensuring broad digital transformation across multiple technological sectors.

What will be the Size of the Ethernet Connector And Transformer Market during the forecast period?
Get Key Insights on Market Forecast (PDF) Get Free Sample

How is the Ethernet Connector And Transformer Market Segmented?

The ethernet connector and transformer industry research report provides comprehensive data (region-wise segment analysis), with forecasts and estimates in "USD million" for the period 2026-2030, as well as historical data from 2020-2024 for the following segments.

  • Type
    • Ethernet connectors
    • Ethernet transformers
  • Product type
    • RJ45
    • M12
    • M8
    • Others
  • End-user
    • Data centers and networking equipment
    • Industrial automation
    • Telecommunications
    • Automotive
    • Others
  • Geography
    • APAC
      • China
      • Japan
      • India
      • South Korea
      • Australia
      • Indonesia
    • North America
      • US
      • Canada
      • Mexico
    • Europe
      • Germany
      • UK
      • France
      • Italy
      • Spain
      • The Netherlands
    • South America
      • Brazil
      • Argentina
      • Chile
    • Middle East and Africa
      • Saudi Arabia
      • UAE
      • South Africa
      • Israel
      • Turkey

By Type Insights

The ethernet connectors segment is estimated to witness significant growth during the forecast period.

The hardware foundation of modern networking infrastructures relies heavily on robust physical data transmission capabilities. Demand for advanced connectivity components surges as artificial intelligence workloads and edge computing architectures require massive bandwidth scaling across telecommunications infrastructure.

Incorporating high-grade ethernet magnetics improves signal transmission, directly resulting in a 15% improvement in error detection rates. Business applications within smart factory automation heavily favor compact designs capable of withstanding extreme temperature fluctuations.

Concurrently, enterprise environments push for high density packaging to support expansive base t networks and power over ethernet requirements.

These components optimize available space on printed circuit board assemblies while maintaining transmission reliability, providing critical interconnectivity for advanced driver assistance systems and hyperscale data centers without compromising structural footprints.
Get Free Sample

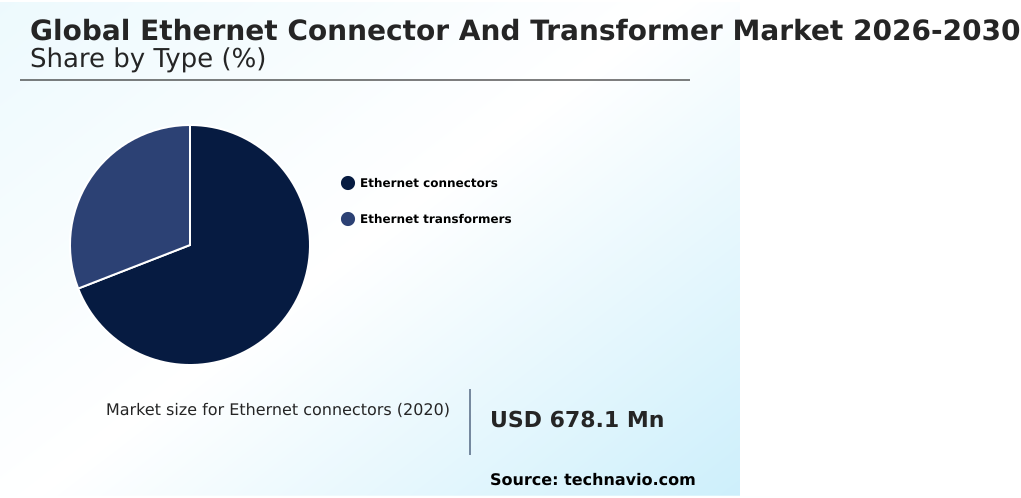
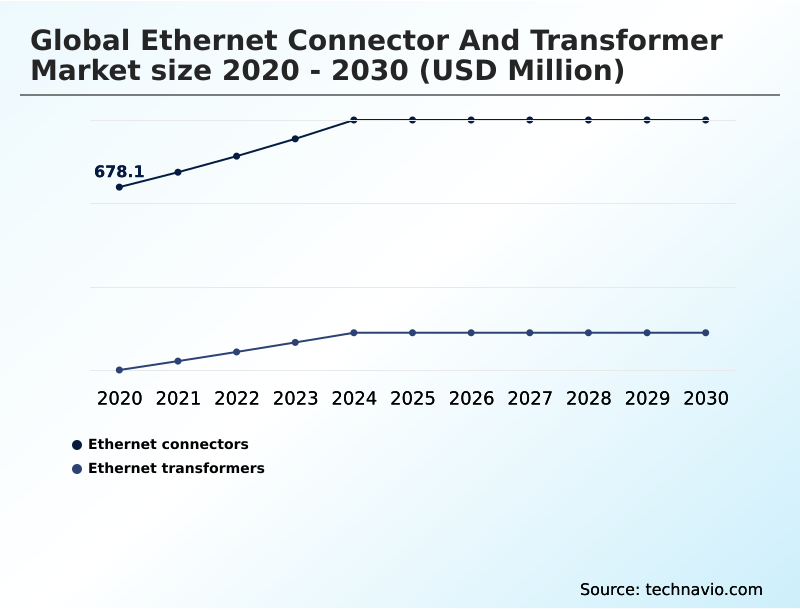
The Ethernet connectors segment was valued at USD 815.6 million in 2024 and showed a gradual increase during the forecast period.
Get Free Sample

Regional Analysis

APAC is estimated to contribute 44.5% to the growth of the global market during the forecast period.Technavio’s analysts have elaborately explained the regional trends and drivers that shape the market during the forecast period.
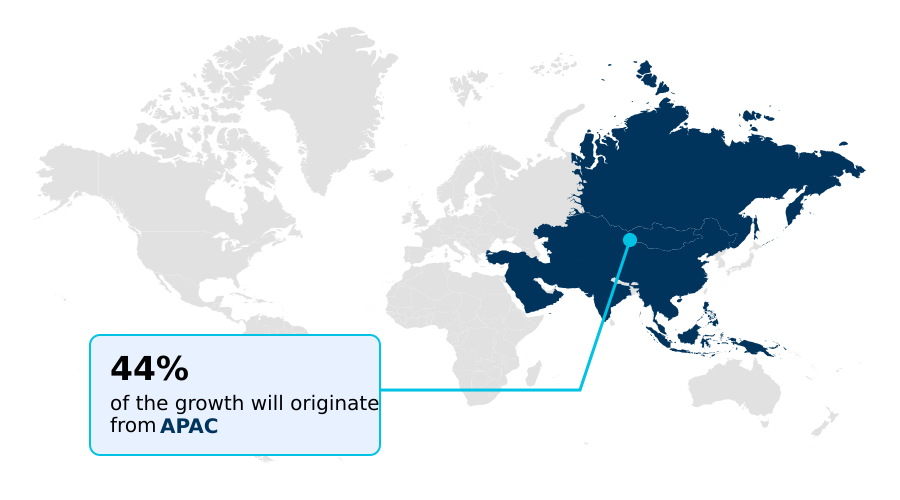
See How Ethernet Connector And Transformer Market Demand is Rising in APAC Get Free Sample

The geographic distribution of the Ethernet Connector And Transformer sector highlights distinct operational priorities between North America and Europe. North America focuses intensely on maximizing broadband transmission hardware throughput, where deploying high-capacity infrastructure has enhanced computing node efficiency by 35%.

Conversely, Europe prioritizes strict environmental compliance, driving a 22% higher adoption rate of fully recyclable components due to evolving circular economy mandates.

This regulatory shift actively supports the sustainable product initiative, forcing manufacturers to innovate eco-friendly designs without sacrificing transient voltage protection.

Concurrently, facilities in both regions rely heavily on automated winding technologies and precise surface mount technology to maintain production volume across precision engineering systems.

However, European markets demonstrate a 15% reduction in overall hardware replacement costs by standardizing robust industrial ethernet protocols across older manufacturing plants.

Market Dynamics

Our researchers analyzed the data with 2025 as the base year, along with the key drivers, trends, and challenges. A holistic analysis of drivers will help companies refine their marketing strategies to gain a competitive advantage.

  • The ongoing evolution of the Ethernet Connector And Transformer framework is fundamentally changing how complex systems handle continuous data exchange. As enterprise and industrial networks push toward greater data loads, manufacturers are rapidly adopting high speed automated winding technologies to ensure absolute precision and consistency in magnetic core production.
  • This specialized manufacturing approach yields a component defect rate that is nearly 30% lower than traditional hand-wound methodologies, significantly streamlining inventory management and supply chain predictability. Simultaneously, heavy industries require robust infrastructure, driving the widespread deployment of ruggedized industrial ethernet connection solutions that provide uninterrupted performance despite severe mechanical vibration and moisture exposure.
  • To support advanced computing hubs, engineers are heavily leveraging integrated magnetic connector design architecture, which optimizes signal pathways and drastically reduces the overall motherboard footprint. These optimizations are especially vital for developing highly efficient space constrained operational environment interfaces used in compact robotics and edge computing hardware.
  • The automotive sector also reflects this shift, as the surge in software-defined vehicle platforms necessitates the use of automotive grade discrete lan transformers to manage high-frequency internal telemetry safely. By standardizing these advanced physical layer components, organizations globally ensure higher operational resilience, improved electrical isolation, and seamless data transmission across increasingly demanding technological ecosystems.
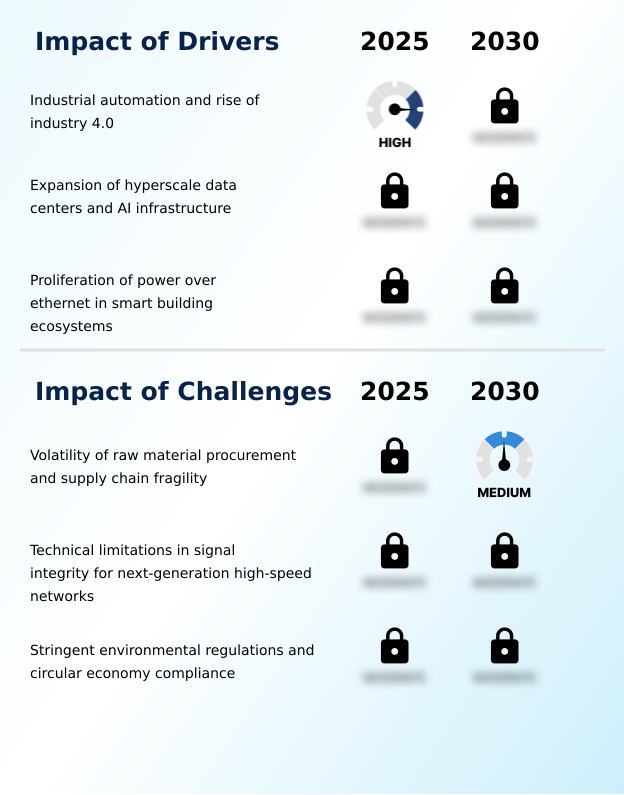
What are the key market drivers leading to the rise in the adoption of Ethernet Connector And Transformer Industry?

  • The rapid expansion of industrial automation and the widespread integration of Industry 4.0 frameworks serve as the primary drivers propelling market growth.

  • The rapid integration of complex automation directly accelerates demand within the Ethernet Connector And Transformer environment. Organizations across industrial automation sectors require ruggedized interconnects to replace fragile cables because legacy wiring cannot support massive real-time data flow.
  • Transitioning to these advanced protocols facilitates seamless machine to machine communication, which immediately lowers unexpected factory downtime by 35%. Additionally, the rising implementation of single pair ethernet frameworks powers remote sensors efficiently, providing crucial galvanic isolation.
  • This convergence reduces total installation costs by 18% across expansive internet of things frameworks. Deploying components optimized for multi gigabit transmission enables uninterrupted performance in robotic assembly lines and autonomous driving platforms.
  • Ultimately, ensuring strict compliance with time sensitive networking protocols empowers enterprises to scale digital operations securely.

What are the market trends shaping the Ethernet Connector And Transformer Industry?

  • The continuous miniaturization and rapid proliferation of high-density interconnect solutions constitute a defining market trend. These advancements directly facilitate more compact and efficient component integration across modern networking architectures.

  • The architectural shift toward miniaturized infrastructure fundamentally redefines the Ethernet Connector And Transformer landscape. Engineers are widely deploying integrated connector modules to condense physical footprints and streamline motherboard layouts. This transition occurs because modern programmable logic controllers demand superior signal integrity within highly restricted spaces.
  • By incorporating advanced common mode chokes with superior electromagnetic interference shielding, organizations experience a 40% decrease in data packet corruption during high-frequency transmissions. Furthermore, sophisticated core materials are preventing magnetic core saturation even under heavy power loads within expansive cloud computing facilities.
  • This ensures consistent electrical isolation across complex process control systems, resulting in a 28% improvement in machine synchronization accuracy. Consequently, businesses accelerate their digital transformation initiatives while maintaining absolute reliability across demanding factory floor environments.

What challenges does the Ethernet Connector And Transformer Industry face during its growth?

  • The persistent volatility of raw material procurement and broader supply chain fragility represent critical challenges that significantly constrain industry expansion.

  • Structural limitations regarding resource availability and physical physics represent severe obstacles for the Ethernet Connector And Transformer ecosystem. The persistent instability surrounding raw material procurement, particularly for high-grade copper used in discrete lan transformers, severely restricts consistent manufacturing outputs. Because of these constraints, hardware producers suffer a 22% increase in logistics costs while striving to maintain adequate supply chain resilience.
  • Simultaneously, as network speeds push higher, complying with stringent electromagnetic compatibility requirements becomes extraordinarily difficult. Engineering compact planar transformers for software defined vehicles and zonal electronic architectures often results in a 15% drop in automated testing yield rates.
  • These profound technical barriers require constant innovation in insertion loss mitigation and return loss optimization to successfully meet emerging high frequency data standards.

Exclusive Technavio Analysis on Customer Landscape

The ethernet connector and transformer market forecasting report includes the adoption lifecycle of the market, covering from the innovator’s stage to the laggard’s stage. It focuses on adoption rates in different regions based on penetration. Furthermore, the ethernet connector and transformer market report also includes key purchase criteria and drivers of price sensitivity to help companies evaluate and develop their market growth analysis strategies.
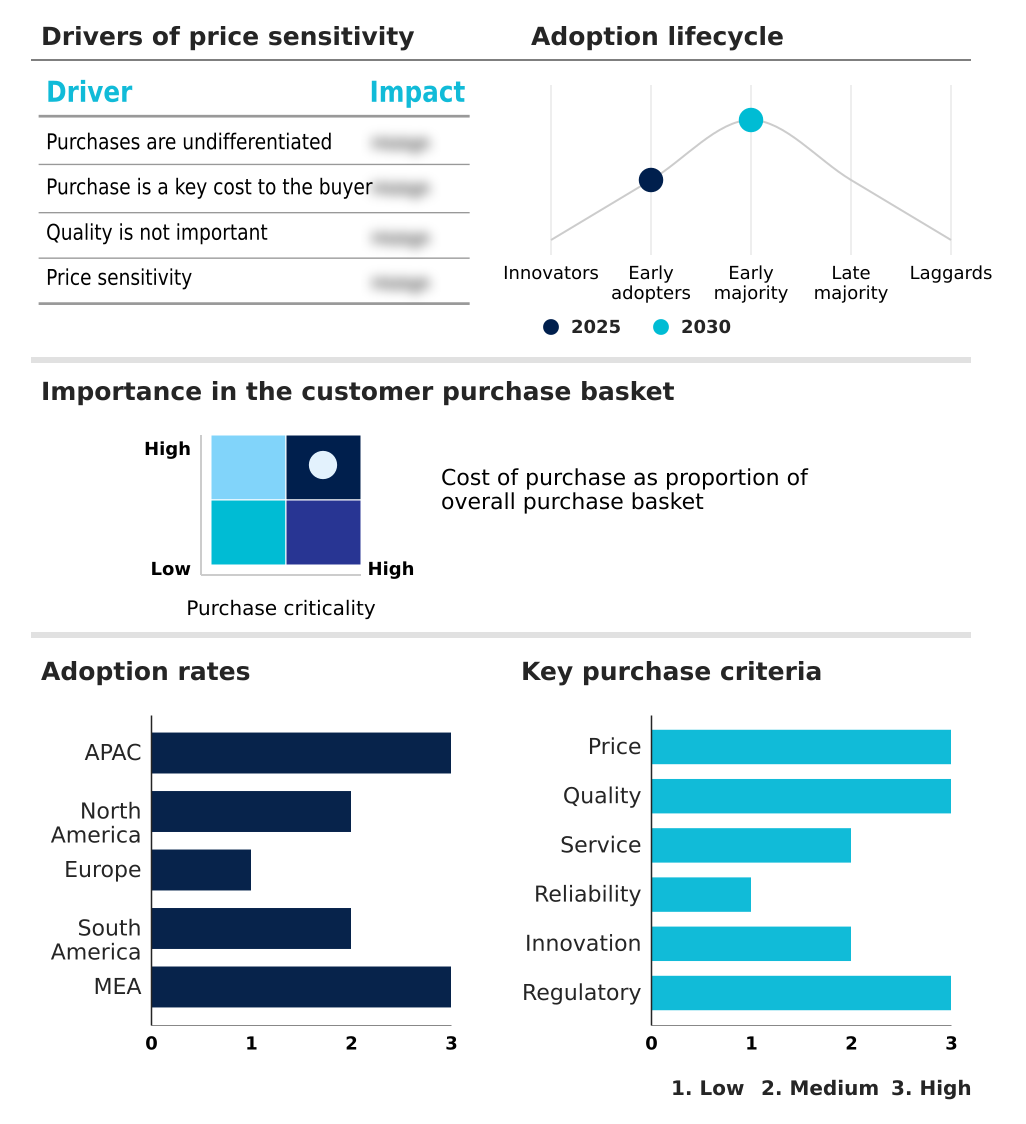
Customer Landscape of Ethernet Connector And Transformer Industry

Competitive Landscape

Companies are implementing various strategies, such as strategic alliances, ethernet connector and transformer market forecast, partnerships, mergers and acquisitions, geographical expansion, and product/service launches, to enhance their presence in the industry.

Abracon LLC - The company engineers high-performance connectivity components specializing in reliable passive magnetic modules and ruggedized physical layer interfaces designed to optimize signal integrity across demanding industrial and enterprise network environments.

The industry research and growth report includes detailed analyses of the competitive landscape of the market and information about key companies, including:

  • Abracon LLC
  • Amphenol Corp.
  • Bel Fuse Inc.
  • Bourns Inc.
  • Coilcraft Inc.
  • Delta Electronics Inc.
  • HALO Electronics Inc.
  • HanRun Electronics Co. Ltd.
  • HARTING Technology Group
  • HIROSE ELECTRIC Co. Ltd.
  • Kyocera Corp.
  • Molex LLC
  • Murata Manufacturing Co. Ltd.
  • Neutrik AG
  • Phoenix Contact GmbH and Co.
  • Standex Electronics Inc.
  • Sumida Corp.
  • TDK Corp.
  • TE Connectivity plc
  • Wurth Elektronik GmbH and Co. KG

Qualitative and quantitative analysis of companies has been conducted to help clients understand the wider business environment as well as the strengths and weaknesses of key industry players. Data is qualitatively analyzed to categorize companies as pure play, category-focused, industry-focused, and diversified; it is quantitatively analyzed to categorize companies as dominant, leading, strong, tentative, and weak.

Recent Development and News in Ethernet connector and transformer market

  • In the Electronic Components industry, the rapid transition toward AI-optimized server architectures escalated the requirement for thermal management, directly impacting Ethernet Connector And Transformer demand by increasing reliance on integrated connector modules for hyperscale data centers.
  • The implementation of strict electromagnetic compatibility requirements within global regulatory bodies forced a complete redesign of automated components, accelerating Ethernet Connector And Transformer consumption to ensure compliance across robotic assembly lines and smart factory automation.
  • The shift toward centralized zonal electronic architectures in modern vehicular networks mandated enhanced electrical isolation mechanisms, elevating Ethernet Connector And Transformer integration to stabilize signal integrity across software defined vehicles and autonomous driving platforms.
  • The widespread adoption of industrial automation sectors upgrading legacy systems streamlined wiring harnesses, driving Ethernet Connector And Transformer volume to facilitate miniaturized internet of things frameworks within complex process control systems.

Dive into Technavio’s robust research methodology, blending expert interviews, extensive data synthesis, and validated models for unparalleled Ethernet Connector And Transformer Market insights. See full methodology.

Market Scope
Page number 308
Base year 2025
Historic period 2020-2024
Forecast period 2026-2030
Growth momentum & CAGR Accelerate at a CAGR of 6.1%
Market growth 2026-2030 USD 437.0 million
Market structure Fragmented
YoY growth 2025-2026(%) 5.5%
Key countries China, Japan, India, South Korea, Australia, Indonesia, US, Canada, Mexico, Germany, UK, France, Italy, Spain, The Netherlands, Brazil, Argentina, Chile, Saudi Arabia, UAE, South Africa, Israel and Turkey
Competitive landscape Leading Companies, Market Positioning of Companies, Competitive Strategies, and Industry Risks

Request Free Sample

Research Analyst Overview

  • The continuous advancement of the Ethernet Connector And Transformer ecosystem dictates fundamental shifts in how organizations plan infrastructure budgets and evaluate operational risk. Boardroom executives increasingly prioritize physical layer reliability when approving network expansion, recognizing that standardizing discrete lan transformers directly influences long-term IT compliance and hardware longevity.
  • Utilizing modern planar transformers provides superior thermal stability, enabling a 25% reduction in overall cooling expenditures across dense computing environments. This efficiency empowers technology leaders to aggressively deploy single pair ethernet frameworks that support multi gigabit transmission without increasing cabling weight.
  • Furthermore, shifting assembly lines toward advanced surface mount technology ensures absolute precision when manufacturing components required for high frequency data standards. Implementing these refined designs guarantees excellent insertion loss mitigation and superior return loss optimization, safeguarding delicate network processors from sudden electrical transients.
  • Consequently, technology decision-makers view these passive interconnect elements not merely as commodity parts, but as essential strategic assets that dictate system uptime, structural resilience, and absolute operational certainty across demanding enterprise architectures.

What are the Key Data Covered in this Ethernet Connector And Transformer Market Research and Growth Report?

  • What is the expected growth of the Ethernet Connector And Transformer Market between 2026 and 2030?

    • USD 437 million, at a CAGR of 6.1%

  • What segmentation does the market report cover?

    • The report is segmented by Type (Ethernet connectors, and Ethernet transformers), Product Type (RJ45, M12, M8, and Others), End-user (Data centers and networking equipment, Industrial automation, Telecommunications, Automotive, and Others) and Geography (APAC, North America, Europe, South America, Middle East and Africa)

  • Which regions are analyzed in the report?

    • APAC, North America, Europe, South America and Middle East and Africa

  • What are the key growth drivers and market challenges?

    • Industrial automation and rise of industry 4.0, Volatility of raw material procurement and supply chain fragility

  • Who are the major players in the Ethernet Connector And Transformer Market?

    • Abracon LLC, Amphenol Corp., Bel Fuse Inc., Bourns Inc., Coilcraft Inc., Delta Electronics Inc., HALO Electronics Inc., HanRun Electronics Co. Ltd., HARTING Technology Group, HIROSE ELECTRIC Co. Ltd., Kyocera Corp., Molex LLC, Murata Manufacturing Co. Ltd., Neutrik AG, Phoenix Contact GmbH and Co., Standex Electronics Inc., Sumida Corp., TDK Corp., TE Connectivity plc and Wurth Elektronik GmbH and Co. KG

Market Research Insights

  • The Ethernet Connector And Transformer landscape is rapidly evolving to support critical machine to machine communication and digital transformation initiatives. Deploying these advanced physical layer components enables enterprises to increase operational bandwidth throughput by 40% compared to legacy architectures. This transition directly supports cloud computing facilities by lowering energy consumption metrics by 12%, an essential improvement for modern hardware sustainability.
  • Organizations heavily prioritize these specialized interconnects to ensure uninterrupted data flow within precise factory floor environments. Furthermore, companies integrating these solutions experience a 20% reduction in long-term maintenance overhead, proving the immense ROI potential of upgrading foundational connectivity hardware amidst strict regulatory and operational efficiency demands.

We can help! Our analysts can customize this ethernet connector and transformer market research report to meet your requirements.

Get in touch

1. Executive Summary

1.1 Market overview

Executive Summary - Chart on Market Overview
Executive Summary - Data Table on Market Overview
Executive Summary - Chart on Global Market Characteristics
Executive Summary - Chart on Market by Geography
Executive Summary - Chart on Market Segmentation by Type
Executive Summary - Chart on Market Segmentation by Product Type
Executive Summary - Chart on Market Segmentation by End-user
Executive Summary - Chart on Incremental Growth
Executive Summary - Data Table on Incremental Growth
Executive Summary - Chart on Company Market Positioning

2. Technavio Analysis

2.1 Analysis of price sensitivity, lifecycle, customer purchase basket, adoption rates, and purchase criteria

2.2 Criticality of inputs and Factors of differentiation

Chart on Overview on criticality of inputs and factors of differentiation

2.3 Factors of disruption

Chart on Overview on factors of disruption

2.4 Impact of drivers and challenges

Chart on Impact of drivers and challenges in 2025 and 2030

3. Market Landscape

3.1 Market ecosystem

Chart on Parent Market
Data Table on - Parent Market

3.2 Market characteristics

Chart on Market characteristics analysis

3.3 Value chain analysis

Chart on Value chain analysis

4. Market Sizing

4.1 Market definition

Data Table on Offerings of companies included in the market definition

4.2 Market segment analysis

Market segments

4.3 Market size 2025

4.4 Market outlook: Forecast for 2025-2030

Chart on Global - Market size and forecast 2025-2030 ($ million)
Data Table on Global - Market size and forecast 2025-2030 ($ million)
Chart on Global Market: Year-over-year growth 2025-2030 (%)
Data Table on Global Market: Year-over-year growth 2025-2030 (%)

5. Historic Market Size

5.1 Global Ethernet Connector And Transformer Market 2020 - 2024

Historic Market Size - Data Table on Global Ethernet Connector And Transformer Market 2020 - 2024 ($ million)

5.2 Type segment analysis 2020 - 2024

Historic Market Size - Type Segment 2020 - 2024 ($ million)

5.3 Product Type segment analysis 2020 - 2024

Historic Market Size - Product Type Segment 2020 - 2024 ($ million)

5.4 End-user segment analysis 2020 - 2024

Historic Market Size - End-user Segment 2020 - 2024 ($ million)

5.5 Geography segment analysis 2020 - 2024

Historic Market Size - Geography Segment 2020 - 2024 ($ million)

5.6 Country segment analysis 2020 - 2024

Historic Market Size - Country Segment 2020 - 2024 ($ million)

6. Qualitative Analysis

6.1 Impact of AI on Global Ethernet Connector and Transformer Market

6.2 Impact of geopolitical conflicts on Global Ethernet Connector and Transformer Market

7. Five Forces Analysis

7.1 Five forces summary

Five forces analysis - Comparison between 2025 and 2030

7.2 Bargaining power of buyers

Bargaining power of buyers - Impact of key factors 2025 and 2030

7.3 Bargaining power of suppliers

Bargaining power of suppliers - Impact of key factors in 2025 and 2030

7.4 Threat of new entrants

Threat of new entrants - Impact of key factors in 2025 and 2030

7.5 Threat of substitutes

Threat of substitutes - Impact of key factors in 2025 and 2030

7.6 Threat of rivalry

Threat of rivalry - Impact of key factors in 2025 and 2030

7.7 Market condition

Chart on Market condition - Five forces 2025 and 2030

8. Market Segmentation by Type

8.1 Market segments

Chart on Type - Market share 2025-2030 (%)
Data Table on Type - Market share 2025-2030 (%)

8.2 Comparison by Type

Chart on Comparison by Type
Data Table on Comparison by Type

8.3 Ethernet connectors - Market size and forecast 2025-2030

Chart on Ethernet connectors - Market size and forecast 2025-2030 ($ million)
Data Table on Ethernet connectors - Market size and forecast 2025-2030 ($ million)
Chart on Ethernet connectors - Year-over-year growth 2025-2030 (%)
Data Table on Ethernet connectors - Year-over-year growth 2025-2030 (%)

8.4 Ethernet transformers - Market size and forecast 2025-2030

Chart on Ethernet transformers - Market size and forecast 2025-2030 ($ million)
Data Table on Ethernet transformers - Market size and forecast 2025-2030 ($ million)
Chart on Ethernet transformers - Year-over-year growth 2025-2030 (%)
Data Table on Ethernet transformers - Year-over-year growth 2025-2030 (%)

8.5 Market opportunity by Type

Market opportunity by Type ($ million)
Data Table on Market opportunity by Type ($ million)

9. Market Segmentation by Product Type

9.1 Market segments

Chart on Product Type - Market share 2025-2030 (%)
Data Table on Product Type - Market share 2025-2030 (%)

9.2 Comparison by Product Type

Chart on Comparison by Product Type
Data Table on Comparison by Product Type

9.3 RJ45 - Market size and forecast 2025-2030

Chart on RJ45 - Market size and forecast 2025-2030 ($ million)
Data Table on RJ45 - Market size and forecast 2025-2030 ($ million)
Chart on RJ45 - Year-over-year growth 2025-2030 (%)
Data Table on RJ45 - Year-over-year growth 2025-2030 (%)

9.4 M12 - Market size and forecast 2025-2030

Chart on M12 - Market size and forecast 2025-2030 ($ million)
Data Table on M12 - Market size and forecast 2025-2030 ($ million)
Chart on M12 - Year-over-year growth 2025-2030 (%)
Data Table on M12 - Year-over-year growth 2025-2030 (%)

9.5 M8 - Market size and forecast 2025-2030

Chart on M8 - Market size and forecast 2025-2030 ($ million)
Data Table on M8 - Market size and forecast 2025-2030 ($ million)
Chart on M8 - Year-over-year growth 2025-2030 (%)
Data Table on M8 - Year-over-year growth 2025-2030 (%)

9.6 Others - Market size and forecast 2025-2030

Chart on Others - Market size and forecast 2025-2030 ($ million)
Data Table on Others - Market size and forecast 2025-2030 ($ million)
Chart on Others - Year-over-year growth 2025-2030 (%)
Data Table on Others - Year-over-year growth 2025-2030 (%)

9.7 Market opportunity by Product Type

Market opportunity by Product Type ($ million)
Data Table on Market opportunity by Product Type ($ million)

10. Market Segmentation by End-user

10.1 Market segments

Chart on End-user - Market share 2025-2030 (%)
Data Table on End-user - Market share 2025-2030 (%)

10.2 Comparison by End-user

Chart on Comparison by End-user
Data Table on Comparison by End-user

10.3 Data centers and networking equipment - Market size and forecast 2025-2030

Chart on Data centers and networking equipment - Market size and forecast 2025-2030 ($ million)
Data Table on Data centers and networking equipment - Market size and forecast 2025-2030 ($ million)
Chart on Data centers and networking equipment - Year-over-year growth 2025-2030 (%)
Data Table on Data centers and networking equipment - Year-over-year growth 2025-2030 (%)

10.4 Industrial automation - Market size and forecast 2025-2030

Chart on Industrial automation - Market size and forecast 2025-2030 ($ million)
Data Table on Industrial automation - Market size and forecast 2025-2030 ($ million)
Chart on Industrial automation - Year-over-year growth 2025-2030 (%)
Data Table on Industrial automation - Year-over-year growth 2025-2030 (%)

10.5 Telecommunications - Market size and forecast 2025-2030

Chart on Telecommunications - Market size and forecast 2025-2030 ($ million)
Data Table on Telecommunications - Market size and forecast 2025-2030 ($ million)
Chart on Telecommunications - Year-over-year growth 2025-2030 (%)
Data Table on Telecommunications - Year-over-year growth 2025-2030 (%)

10.6 Automotive - Market size and forecast 2025-2030

Chart on Automotive - Market size and forecast 2025-2030 ($ million)
Data Table on Automotive - Market size and forecast 2025-2030 ($ million)
Chart on Automotive - Year-over-year growth 2025-2030 (%)
Data Table on Automotive - Year-over-year growth 2025-2030 (%)

10.7 Others - Market size and forecast 2025-2030

Chart on Others - Market size and forecast 2025-2030 ($ million)
Data Table on Others - Market size and forecast 2025-2030 ($ million)
Chart on Others - Year-over-year growth 2025-2030 (%)
Data Table on Others - Year-over-year growth 2025-2030 (%)

10.8 Market opportunity by End-user

Market opportunity by End-user ($ million)
Data Table on Market opportunity by End-user ($ million)

11. Customer Landscape

11.1 Customer landscape overview

Analysis of price sensitivity, lifecycle, customer purchase basket, adoption rates, and purchase criteria

12. Geographic Landscape

12.1 Geographic segmentation

Chart on Market share by geography 2025-2030 (%)
Data Table on Market share by geography 2025-2030 (%)

12.2 Geographic comparison

Chart on Geographic comparison
Data Table on Geographic comparison

12.3 APAC - Market size and forecast 2025-2030

Chart on APAC - Market size and forecast 2025-2030 ($ million)
Data Table on APAC - Market size and forecast 2025-2030 ($ million)
Chart on APAC - Year-over-year growth 2025-2030 (%)
Data Table on APAC - Year-over-year growth 2025-2030 (%)
Chart on Regional Comparison - APAC
Data Table on Regional Comparison - APAC

12.3.1 China - Market size and forecast 2025-2030

Chart on China - Market size and forecast 2025-2030 ($ million)
Data Table on China - Market size and forecast 2025-2030 ($ million)
Chart on China - Year-over-year growth 2025-2030 (%)
Data Table on China - Year-over-year growth 2025-2030 (%)

12.3.2 Japan - Market size and forecast 2025-2030

Chart on Japan - Market size and forecast 2025-2030 ($ million)
Data Table on Japan - Market size and forecast 2025-2030 ($ million)
Chart on Japan - Year-over-year growth 2025-2030 (%)
Data Table on Japan - Year-over-year growth 2025-2030 (%)

12.3.3 India - Market size and forecast 2025-2030

Chart on India - Market size and forecast 2025-2030 ($ million)
Data Table on India - Market size and forecast 2025-2030 ($ million)
Chart on India - Year-over-year growth 2025-2030 (%)
Data Table on India - Year-over-year growth 2025-2030 (%)

12.3.4 South Korea - Market size and forecast 2025-2030

Chart on South Korea - Market size and forecast 2025-2030 ($ million)
Data Table on South Korea - Market size and forecast 2025-2030 ($ million)
Chart on South Korea - Year-over-year growth 2025-2030 (%)
Data Table on South Korea - Year-over-year growth 2025-2030 (%)

12.3.5 Australia - Market size and forecast 2025-2030

Chart on Australia - Market size and forecast 2025-2030 ($ million)
Data Table on Australia - Market size and forecast 2025-2030 ($ million)
Chart on Australia - Year-over-year growth 2025-2030 (%)
Data Table on Australia - Year-over-year growth 2025-2030 (%)

12.3.6 Indonesia - Market size and forecast 2025-2030

Chart on Indonesia - Market size and forecast 2025-2030 ($ million)
Data Table on Indonesia - Market size and forecast 2025-2030 ($ million)
Chart on Indonesia - Year-over-year growth 2025-2030 (%)
Data Table on Indonesia - Year-over-year growth 2025-2030 (%)

12.4 North America - Market size and forecast 2025-2030

Chart on North America - Market size and forecast 2025-2030 ($ million)
Data Table on North America - Market size and forecast 2025-2030 ($ million)
Chart on North America - Year-over-year growth 2025-2030 (%)
Data Table on North America - Year-over-year growth 2025-2030 (%)
Chart on Regional Comparison - North America
Data Table on Regional Comparison - North America

12.4.1 US - Market size and forecast 2025-2030

Chart on US - Market size and forecast 2025-2030 ($ million)
Data Table on US - Market size and forecast 2025-2030 ($ million)
Chart on US - Year-over-year growth 2025-2030 (%)
Data Table on US - Year-over-year growth 2025-2030 (%)

12.4.2 Canada - Market size and forecast 2025-2030

Chart on Canada - Market size and forecast 2025-2030 ($ million)
Data Table on Canada - Market size and forecast 2025-2030 ($ million)
Chart on Canada - Year-over-year growth 2025-2030 (%)
Data Table on Canada - Year-over-year growth 2025-2030 (%)

12.4.3 Mexico - Market size and forecast 2025-2030

Chart on Mexico - Market size and forecast 2025-2030 ($ million)
Data Table on Mexico - Market size and forecast 2025-2030 ($ million)
Chart on Mexico - Year-over-year growth 2025-2030 (%)
Data Table on Mexico - Year-over-year growth 2025-2030 (%)

12.5 Europe - Market size and forecast 2025-2030

Chart on Europe - Market size and forecast 2025-2030 ($ million)
Data Table on Europe - Market size and forecast 2025-2030 ($ million)
Chart on Europe - Year-over-year growth 2025-2030 (%)
Data Table on Europe - Year-over-year growth 2025-2030 (%)
Chart on Regional Comparison - Europe
Data Table on Regional Comparison - Europe

12.5.1 Germany - Market size and forecast 2025-2030

Chart on Germany - Market size and forecast 2025-2030 ($ million)
Data Table on Germany - Market size and forecast 2025-2030 ($ million)
Chart on Germany - Year-over-year growth 2025-2030 (%)
Data Table on Germany - Year-over-year growth 2025-2030 (%)

12.5.2 UK - Market size and forecast 2025-2030

Chart on UK - Market size and forecast 2025-2030 ($ million)
Data Table on UK - Market size and forecast 2025-2030 ($ million)
Chart on UK - Year-over-year growth 2025-2030 (%)
Data Table on UK - Year-over-year growth 2025-2030 (%)

12.5.3 France - Market size and forecast 2025-2030

Chart on France - Market size and forecast 2025-2030 ($ million)
Data Table on France - Market size and forecast 2025-2030 ($ million)
Chart on France - Year-over-year growth 2025-2030 (%)
Data Table on France - Year-over-year growth 2025-2030 (%)

12.5.4 Italy - Market size and forecast 2025-2030

Chart on Italy - Market size and forecast 2025-2030 ($ million)
Data Table on Italy - Market size and forecast 2025-2030 ($ million)
Chart on Italy - Year-over-year growth 2025-2030 (%)
Data Table on Italy - Year-over-year growth 2025-2030 (%)

12.5.5 Spain - Market size and forecast 2025-2030

Chart on Spain - Market size and forecast 2025-2030 ($ million)
Data Table on Spain - Market size and forecast 2025-2030 ($ million)
Chart on Spain - Year-over-year growth 2025-2030 (%)
Data Table on Spain - Year-over-year growth 2025-2030 (%)

12.5.6 The Netherlands - Market size and forecast 2025-2030

Chart on The Netherlands - Market size and forecast 2025-2030 ($ million)
Data Table on The Netherlands - Market size and forecast 2025-2030 ($ million)
Chart on The Netherlands - Year-over-year growth 2025-2030 (%)
Data Table on The Netherlands - Year-over-year growth 2025-2030 (%)

12.6 South America - Market size and forecast 2025-2030

Chart on South America - Market size and forecast 2025-2030 ($ million)
Data Table on South America - Market size and forecast 2025-2030 ($ million)
Chart on South America - Year-over-year growth 2025-2030 (%)
Data Table on South America - Year-over-year growth 2025-2030 (%)
Chart on Regional Comparison - South America
Data Table on Regional Comparison - South America

12.6.1 Brazil - Market size and forecast 2025-2030

Chart on Brazil - Market size and forecast 2025-2030 ($ million)
Data Table on Brazil - Market size and forecast 2025-2030 ($ million)
Chart on Brazil - Year-over-year growth 2025-2030 (%)
Data Table on Brazil - Year-over-year growth 2025-2030 (%)

12.6.2 Argentina - Market size and forecast 2025-2030

Chart on Argentina - Market size and forecast 2025-2030 ($ million)
Data Table on Argentina - Market size and forecast 2025-2030 ($ million)
Chart on Argentina - Year-over-year growth 2025-2030 (%)
Data Table on Argentina - Year-over-year growth 2025-2030 (%)

12.6.3 Chile - Market size and forecast 2025-2030

Chart on Chile - Market size and forecast 2025-2030 ($ million)
Data Table on Chile - Market size and forecast 2025-2030 ($ million)
Chart on Chile - Year-over-year growth 2025-2030 (%)
Data Table on Chile - Year-over-year growth 2025-2030 (%)

12.7 Middle East and Africa - Market size and forecast 2025-2030

Chart on Middle East and Africa - Market size and forecast 2025-2030 ($ million)
Data Table on Middle East and Africa - Market size and forecast 2025-2030 ($ million)
Chart on Middle East and Africa - Year-over-year growth 2025-2030 (%)
Data Table on Middle East and Africa - Year-over-year growth 2025-2030 (%)
Chart on Regional Comparison - Middle East and Africa
Data Table on Regional Comparison - Middle East and Africa

12.7.1 Saudi Arabia - Market size and forecast 2025-2030

Chart on Saudi Arabia - Market size and forecast 2025-2030 ($ million)
Data Table on Saudi Arabia - Market size and forecast 2025-2030 ($ million)
Chart on Saudi Arabia - Year-over-year growth 2025-2030 (%)
Data Table on Saudi Arabia - Year-over-year growth 2025-2030 (%)

12.7.2 UAE - Market size and forecast 2025-2030

Chart on UAE - Market size and forecast 2025-2030 ($ million)
Data Table on UAE - Market size and forecast 2025-2030 ($ million)
Chart on UAE - Year-over-year growth 2025-2030 (%)
Data Table on UAE - Year-over-year growth 2025-2030 (%)

12.7.3 South Africa - Market size and forecast 2025-2030

Chart on South Africa - Market size and forecast 2025-2030 ($ million)
Data Table on South Africa - Market size and forecast 2025-2030 ($ million)
Chart on South Africa - Year-over-year growth 2025-2030 (%)
Data Table on South Africa - Year-over-year growth 2025-2030 (%)

12.7.4 Israel - Market size and forecast 2025-2030

Chart on Israel - Market size and forecast 2025-2030 ($ million)
Data Table on Israel - Market size and forecast 2025-2030 ($ million)
Chart on Israel - Year-over-year growth 2025-2030 (%)
Data Table on Israel - Year-over-year growth 2025-2030 (%)

12.7.5 Turkey - Market size and forecast 2025-2030

Chart on Turkey - Market size and forecast 2025-2030 ($ million)
Data Table on Turkey - Market size and forecast 2025-2030 ($ million)
Chart on Turkey - Year-over-year growth 2025-2030 (%)
Data Table on Turkey - Year-over-year growth 2025-2030 (%)

12.8 Market opportunity by geography

Market opportunity by geography ($ million)
Data Tables on Market opportunity by geography ($ million)

13. Drivers, Challenges, and Opportunity

13.1 Market drivers

Industrial automation and rise of industry 4.0
Expansion of hyperscale data centers and AI infrastructure
Proliferation of power over ethernet in smart building ecosystems

13.2 Market challenges

Volatility of raw material procurement and supply chain fragility
Technical limitations in signal integrity for next-generation high-speed networks
Stringent environmental regulations and circular economy compliance

13.3 Impact of drivers and challenges

Impact of drivers and challenges in 2025 and 2030

13.4 Market opportunities

Miniaturization and proliferation of high-density interconnect solutions
Transition toward integrated connector modules for enhanced signal integrity
Advancement of single pair ethernet in automotive and transportation sectors

14. Competitive Landscape

14.1 Overview

14.2

Overview on criticality of inputs and factors of differentiation

14.3 Landscape disruption

Overview on factors of disruption

14.4 Industry risks

Impact of key risks on business

15. Competitive Analysis

15.1 Companies profiled

Companies covered

15.2 Company ranking index

15.3 Market positioning of companies

Matrix on companies position and classification

15.4 Abracon LLC

Abracon LLC - Overview
Abracon LLC - Product / Service
Abracon LLC - Key offerings
SWOT

15.5 Amphenol Corp.

Amphenol Corp. - Overview
Amphenol Corp. - Business segments
Amphenol Corp. - Key news
Amphenol Corp. - Key offerings
Amphenol Corp. - Segment focus
SWOT

15.6 Bel Fuse Inc.

Bel Fuse Inc. - Overview
Bel Fuse Inc. - Product / Service
Bel Fuse Inc. - Key offerings
SWOT

15.7 Bourns Inc.

Bourns Inc. - Overview
Bourns Inc. - Product / Service
Bourns Inc. - Key offerings
SWOT

15.8 Delta Electronics Inc.

Delta Electronics Inc. - Overview
Delta Electronics Inc. - Business segments
Delta Electronics Inc. - Key offerings
Delta Electronics Inc. - Segment focus
SWOT

15.9 HALO Electronics Inc.

HALO Electronics Inc. - Overview
HALO Electronics Inc. - Product / Service
HALO Electronics Inc. - Key offerings
SWOT

15.10 HanRun Electronics Co. Ltd.

HanRun Electronics Co. Ltd. - Overview
HanRun Electronics Co. Ltd. - Product / Service
HanRun Electronics Co. Ltd. - Key offerings
SWOT

15.11 HARTING Technology Group

HARTING Technology Group - Overview
HARTING Technology Group - Product / Service
HARTING Technology Group - Key offerings
SWOT

15.12 Kyocera Corp.

Kyocera Corp. - Overview
Kyocera Corp. - Business segments
Kyocera Corp. - Key offerings
Kyocera Corp. - Segment focus
SWOT

15.13 Molex LLC

Molex LLC - Overview
Molex LLC - Product / Service
Molex LLC - Key offerings
SWOT

15.14 Murata Manufacturing Co. Ltd.

Murata Manufacturing Co. Ltd. - Overview
Murata Manufacturing Co. Ltd. - Business segments
Murata Manufacturing Co. Ltd. - Key offerings
Murata Manufacturing Co. Ltd. - Segment focus
SWOT

15.15 Standex Electronics Inc.

Standex Electronics Inc. - Overview
Standex Electronics Inc. - Product / Service
Standex Electronics Inc. - Key offerings
SWOT

15.16 Sumida Corp.

Sumida Corp. - Overview
Sumida Corp. - Product / Service
Sumida Corp. - Key offerings
SWOT

15.17 TDK Corp.

TDK Corp. - Overview
TDK Corp. - Business segments
TDK Corp. - Key offerings
TDK Corp. - Segment focus
SWOT

15.18 TE Connectivity plc

TE Connectivity plc - Overview
TE Connectivity plc - Business segments
TE Connectivity plc - Key offerings
TE Connectivity plc - Segment focus
SWOT

16. Appendix

16.1 Scope of the report

Market definition
Objectives
Notes and caveats

16.2 Inclusions and exclusions checklist

Inclusions checklist
Exclusions checklist

16.3 Currency conversion rates for US$

16.4 Research methodology

16.5 Data procurement

Information sources

16.6 Data validation

16.7 Validation techniques employed for market sizing

16.8 Data synthesis

16.9 360 degree market analysis

16.10 List of abbreviations

Research Methodology

Technavio presents a detailed picture of the market by way of study, synthesis, and summation of data from multiple sources. The analysts have presented the various facets of the market with a particular focus on identifying the key industry influencers. The data thus presented is comprehensive, reliable, and the result of extensive research, both primary and secondary.

INFORMATION SOURCES

Primary sources

  • Manufacturers and suppliers
  • Channel partners
  • Industry experts
  • Strategic decision makers

Secondary sources

  • Industry journals and periodicals
  • Government data
  • Financial reports of key industry players
  • Historical data
  • Press releases

DATA ANALYSIS

Data Synthesis

  • Collation of data
  • Estimation of key figures
  • Analysis of derived insights

Data Validation

  • Triangulation with data models
  • Reference against proprietary databases
  • Corroboration with industry experts

REPORT WRITING

Qualitative

  • Market drivers
  • Market challenges
  • Market trends
  • Five forces analysis

Quantitative

  • Market size and forecast
  • Market segmentation
  • Geographical insights
  • Competitive landscape

Interested in this report?

Get your sample now to see our research methodology and insights!

Download Now

Frequently Asked Questions

Ethernet Connector And Transformer market growth will increase by USD 437.0 million during 2026-2030.

The Ethernet Connector And Transformer market is expected to grow at a CAGR of 6.1% during 2026-2030.

Ethernet Connector And Transformer market is segmented by Type (Ethernet connectors, Ethernet transformers) Product type (RJ45, M12, M8, Others) End-user (Data centers and networking equipment, Industrial automation, Telecommunications, Automotive, Others)

Abracon LLC, Amphenol Corp., Bel Fuse Inc., Bourns Inc., Coilcraft Inc., Delta Electronics Inc., HALO Electronics Inc., HanRun Electronics Co. Ltd., HARTING Technology Group, HIROSE ELECTRIC Co. Ltd., Kyocera Corp., Molex LLC, Murata Manufacturing Co. Ltd., Neutrik AG, Phoenix Contact GmbH and Co., Standex Electronics Inc., Sumida Corp., TDK Corp., TE Connectivity plc, Wurth Elektronik GmbH and Co. KG are a few of the key vendors in the Ethernet Connector And Transformer market.

APAC will register the highest growth rate of 44.5% among the other regions. Therefore, the Ethernet Connector And Transformer market in APAC is expected to garner significant business opportunities for the vendors during the forecast period.

China, Japan, India, South Korea, Australia, Indonesia, US, Canada, Mexico, Germany, UK, France, Italy, Spain, The Netherlands, Brazil, Argentina, Chile, Saudi Arabia, UAE, South Africa, Israel, Turkey

  • Industrial automation and rise of industry 4.0 is the driving factor this market.

The Ethernet Connector And Transformer market vendors should focus on grabbing business opportunities from the Type segment as it accounted for the largest market share in the base year.
RIA - Research AI Assistant
Ask RIA
