Interactive Whiteboard Market Analysis Europe - Size and Forecast 2024-2028

Interactive Whiteboard Market Analysis Europe - Size and Forecast 2024-2028

Published: Jul 2024 155 Pages SKU: IRTNTR76480

Market Overview at a Glance

$226.4 Mn
Market Opportunity
6.78%
CAGR
6.23
YoY growth 2023-2024(%)

Europe Interactive Whiteboard Market Size 2024-2028

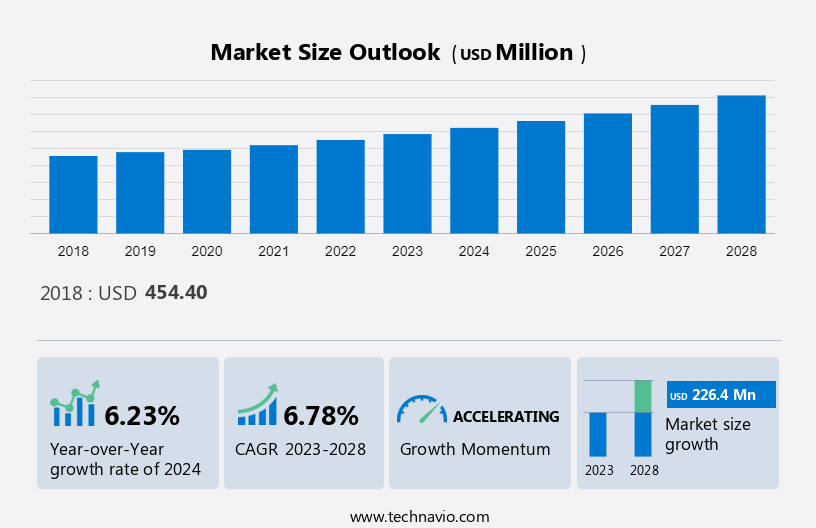
The Europe Interactive Whiteboard Market size is estimated to grow by USD 226.4 million at a CAGR of 6.78% between 2023 and 2028. The education sector is undergoing a significant transformation with the integration of advanced technologies. One notable shift is the replacement of traditional whiteboards with digital whiteboards, which offer enhanced interactivity and collaboration. Moreover, the widespread use of smartphones and improved internet access have made digital learning more accessible than ever before. These technologies enable personalized learning experiences, real-time feedback, and remote education, thereby revolutionizing the way knowledge is imparted and acquired. Digital whiteboards, in particular, provide an engaging and interactive learning environment, allowing teachers to create dynamic content, record lessons, and share resources seamlessly. This technological evolution is set to redefine the education landscape and create new opportunities for learners and educators alike.

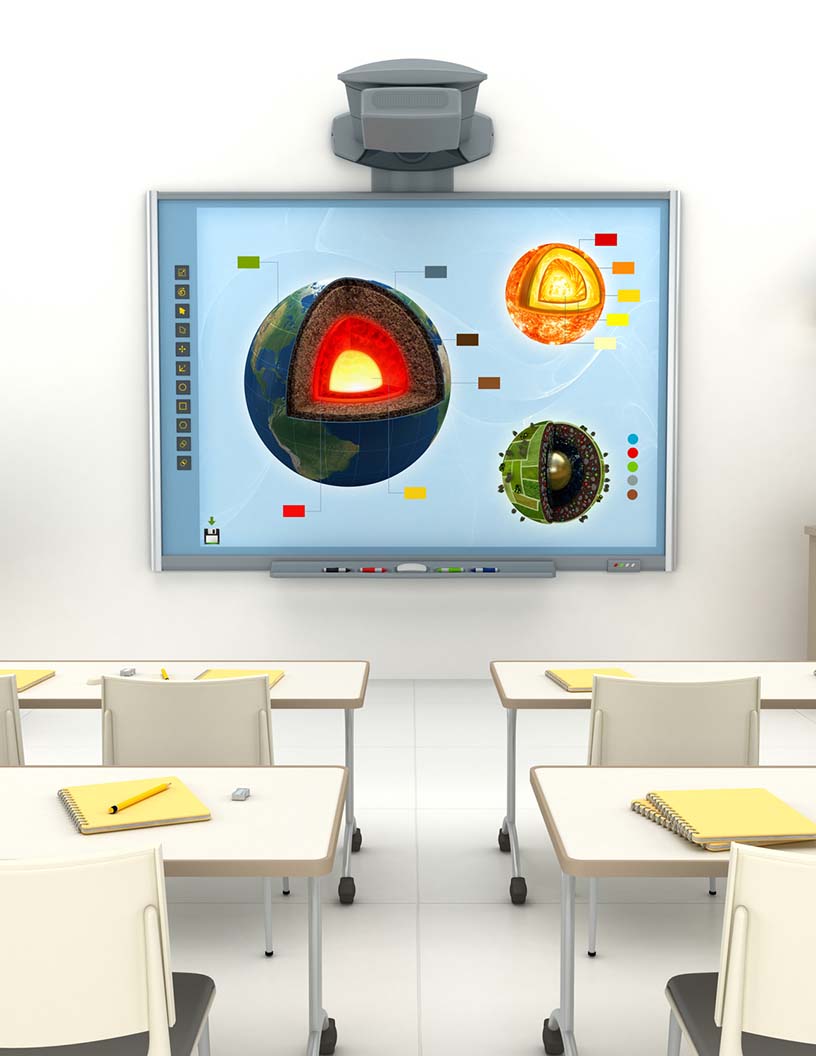
The increasing use of advanced technologies in the education sector is notably driving market growth. Over the past decade, the education sector in Europe has seen an impressive growth rate of double digits, largely due to a heightened focus on basic education. As a result, governments across the continent are investing more in this sector by opening new schools and educational institutions. One significant advancement that has contributed to improved learning outcomes is the integration of these whiteboards into classrooms. These boards allow teachers to create interactive and engaging lessons, which help to reduce distractions among students while boosting their overall learning experience. Compared to traditional teaching methods, these whiteboards also provide clearer and more accurate images and graphs. With the younger generation becoming increasingly tech-savvy, it is crucial for educational institutions in Europe to adopt advanced technologies such as interactive whiteboards. This trend is expected to drive the demand for these whiteboards in the region, thereby fueling the growth of the market in Europe during the forecast period. 

What will be the size of the Market During the Forecast Period?

Interactive Whiteboard Market in Europe Size

View Sample PDF at your Fingertips

Who are the Major Market Companies?

Companies are implementing various strategies, such as strategic alliances, partnerships, mergers and acquisitions, geographical expansion, and product/service launches, to enhance their presence in the market.

Hitachi Ltd. - The company offers interactive whiteboards such as Creative Touch 5 plus series 65, Creative Touch 5 plus series 75 and Creative Touch 5 series 75, under the subsidiary of Optoma Corp.

The market report also includes detailed analyses of the competitive landscape of the market and information about 15 market companies, including:

  • Classroom365 Ltd.
  • LG Electronics Inc.
  • Mercells services
  • Microsoft Corp.
  • NTS systems and trade Ltd.
  • Ricoh Co. Ltd.
  • Samsung Electronics Co. Ltd.
  • Seiko Epson Corp.
  • Sharp Corp.
  • SMART Technologies ULC
  • StarBoard Solution GmbH
  • VideoCentric Ltd.
  • ViDiS SA
  • ViewSonic Corp.

Qualitative and quantitative analysis of companies has been conducted to help clients understand the wider business environment as well as the strengths and weaknesses of key market players. Data is qualitatively analyzed to categorize companies as pure play, category-focused, industry-focused, and diversified; it is quantitatively analyzed to categorize companies as dominant, leading, strong, tentative, and weak.

Market Segmentation

By End-user

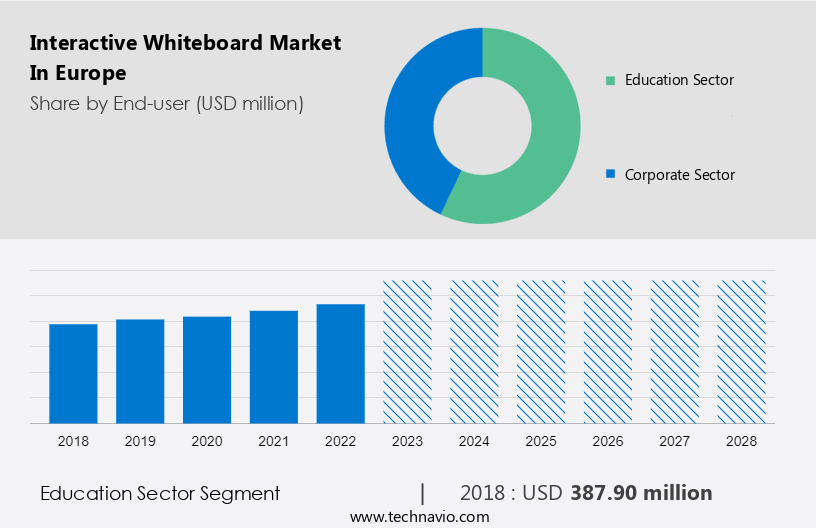
The market share growth by the education sector segment will be significant during the forecast period. The education sector comprises schools and colleges that are managed by either government or private organizations. Interactive whiteboards are the newest and most interactive teaching tools for modern and connected classrooms in Europe. 

Interactive Whiteboard Market in Europe Size

Get a glance at the market contribution of various segments View PDF Sample

The education sector segment was the largest and was valued at USD 387.90 million in 2018. These panels provide a platform for teachers to present content more effectively than traditional teaching methods. The significant investments in Information and Learning Technology (ILT) infrastructure in colleges, the development of digital content and mobile learning applications, and national training initiatives have transformed traditional learning and teaching methods in the region which resulted in market expansion. Due to all these factors, the adoption of interactive whiteboards in the education sector is gaining traction, and the market in Europe is expected to grow during the forecast period.

Market Dynamics

The market is evolving rapidly with the integration of gamification and e-learning solutions in corporate sectors and educational institutions. Digital classrooms equipped with mobiles, tablets, laptops, and projectors facilitate immersive learning experiences through high-resolution videos and graphics. Virtual classrooms enhance digitalization and outsourcing functions, leveraging internet connectivity for seamless multimedia support and cloud connectivity. Universities adopt interactive whiteboards like IR boards, interactive ceramic boards, and resistive membranes to enrich educational resources and promote interactive teaching methods. These technologies enhance engagement and collaboration in classrooms, offering versatile tools for educators to deliver dynamic lessons and interactive content. As digital transformation continues to shape the education landscape, interactive whiteboards play a pivotal role in fostering innovative learning environments and preparing students for future challenges in a technologically advanced world. Our researchers analyzed the data with 2023 as the base year, along with the key drivers, trends, and challenges. A holistic analysis of drivers will help companies refine their marketing strategies to gain a competitive advantage.

Major Market Trends

Implementation of multi-touch technology in education is an emerging trend shaping the market growth. Multi-touch interface technology recognizes multiple simultaneous touches, allowing several users to interact with computer applications at the same time. It includes gestures such as swipes, pinches, and rotations, providing immediate interaction with digital content. Multi-touch technology is commonly associated with capacitive touchscreen displays. Incorporating multi-touch technology in education offers immense opportunities for interaction with graphical user interfaces (GUIs), more gestural control, and multi-user collaboration. It enables dynamic interaction around content, making classroom sessions more engaging for students. Multi-touch technology is easy to implement, offering a broad range of possibilities.

As a result, instructors are increasingly incorporating it into their delivery methods. As this trend continues, it is expected to enhance student interest in classroom sessions, which may positively impact the market in Europe during the forecast period. 

Significant Market Challenge

Challenges in implementation is a significant challenge hindering the market growth. The role of technology in education has changed, but many institutions haven't increased their budget for improving IT infrastructure at the same pace. While classroom technology needs to be flexible, a lack of financial resources for transformational work is a major hurdle in adopting interactive whiteboards. Full implementation of content management has significantly strengthened the education system in Europe. The availability of necessary hardware and understanding of how to use it optimally by faculty and instructors has played a crucial role in the adoption of technology in education. This has also made upgrading from traditional to digital learning and marketing institute websites more efficient.

However, teachers find it challenging to use technology to engage with students and support e-learning which is restricting the market expansion. Programs for training and professional development are essential to help teachers teach with technology. These factors are expected to hinder the growth of the market in Europe during the forecast period

Market Customer Landscape

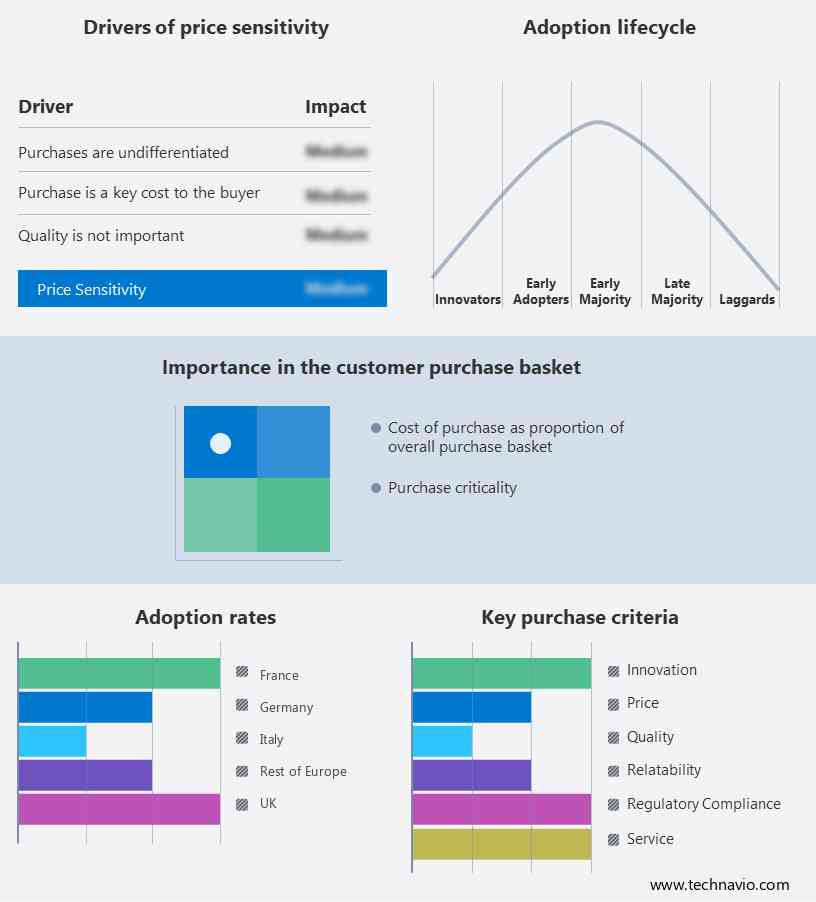
The report includes the adoption lifecycle of the market, from the innovator’s stage to the laggard’s stage. It focuses on adoption rates in different regions based on market penetration. Furthermore, the report also includes key purchase criteria and drivers of price sensitivity to help companies evaluate and develop their growth strategies. 

Interactive Whiteboard Market in Europe Share by Geography

Market Customer Landscape

Segment Overview

The market research report provides comprehensive data (region-wise segment analysis), with forecasts and estimates in "USD Million " for the period 2024-2028, as well as historical data from 2018 - 2022 for the following segments.

  • End-user Outlook 
    • Education sector
    • Corporate sector
  • Technology Outlook 
    • Resistive
    • Capacitive
    • Infrared
    • Electromagnetic pen
    • Others

You may also interested in below market reports:

  • Interactive Whiteboard Market Research Report by End-user, Technology, Geography Forecast

  • Interactive Flat Panels Market Analysis North America, APAC, Europe, Middle East and Africa, South America - US, UK, China, Germany, Japan - Size and Forecast

  • Projector Market Analysis APAC, Europe, North America, South America, Middle East and Africa - US, China, Japan, India, Germany - Size and Forecast 

Market Analyst Overview

The market is at the forefront of educational technology, leveraging e-learning environments and disruptive technologies such as artificial intelligence and machine learning. Bring Your Own Device (BYOD) policies are enhancing accessibility, while high-resolution videos and holographic displays enrich virtual learning experiences. Digital operation boards and smart education solutions integrate with Enterprise Resource Planning (ERP) and Learning Management Systems (LMS) for comprehensive educational management. Interactive whiteboards come in various forms including portable and fixed options utilizing resistive membrane and capacitive technology.

Furthermore, they support diverse teaching methods through front and rear projection capabilities, and innovations like the Interactive Ceramic Board and ultrasonic technology enhance interactivity and engagement in classrooms. As digital transformation accelerates, interactive whiteboards continue to evolve, offering dynamic tools to enhance student learning and collaboration. The eLearning industry embraces disruptive technology and utilizes high resolution videos alongside innovative solutions such as resistive membrane technology and a variety of interactive whiteboards including portable interactive whiteboards, fixed interactive whiteboards, front projection interactive whiteboards, and rear projection interactive whiteboards.

Market Scope

Report Coverage

Details

Page number

155

Base year

2023

Historic period

2018 - 2022

Forecast period

2024-2028

Growth momentum & CAGR

Accelerate at a CAGR of 6.78%

Market growth 2024-2028

USD 226.4 million

Market structure

Fragmented

YoY growth 2023-2024(%)

6.23

Competitive landscape

Leading Companies, Market Positioning of Companies, Competitive Strategies, and Industry Risks

Key companies profiled

Classroom365 Ltd., Coretronic Corp., Dahua Technology Co. Ltd., Emerald X LLC, Hitachi Ltd., LG Electronics Inc., Mercells services, Microsoft Corp., NTS systems and trade Ltd., Qisda Corp., Ricoh Co. Ltd., Samsung Electronics Co. Ltd., Seiko Epson Corp., Sharp Corp., SMART Technologies ULC, StarBoard Solution GmbH, VideoCentric Ltd., ViDiS SA, and ViewSonic Corp.

Market dynamics

Parent market analysis, Market forecasting, Market growth inducers and obstacles, Fast-growing and slow-growing segment analysis, Market growth and Forecasting, COVID 19 impact and recovery analysis and future consumer dynamics, Market condition analysis for market forecast period

Customization purview

If our report has not included the data that you are looking for, you can reach out to our analysts and get segments customized.

View PDF Sample

What are the Key Data Covered in this Market Report?

  • CAGR of the market during the forecast period
  • Detailed information on factors that will drive the market growth and forecasting of the market between 2024 and 2028
  • Precise estimation of the size of the market size and its contribution to the parent market
  • Accurate predictions about upcoming market trends and analysis and changes in consumer behavior
  • market growth and trends across Europe
  • Thorough market growth analysis of the market’s competitive landscape and detailed information about companies
  • Comprehensive market analysis and report on the factors that will challenge the market research and growth of market companies

We can help! Our analysts can customize this market research report to meet your requirements. Get in touch

1 Executive Summary

  • 1.1 Market overview
    • Executive Summary - Chart on Market Overview
    • Executive Summary - Data Table on Market Overview
    • Executive Summary - Chart on Country Market Characteristics
    • Executive Summary - Chart on Market by Geography
    • Executive Summary - Chart on Market Segmentation by End-user
    • Executive Summary - Chart on Market Segmentation by Technology
    • Executive Summary - Chart on Incremental Growth
    • Executive Summary - Data Table on Incremental Growth
    • Executive Summary - Chart on Company Market Positioning

2 Market Landscape

  • 2.1 Market ecosystem
    • Parent Market
    • Data Table on - Parent Market
  • 2.2 Market characteristics
    • Market characteristics analysis
  • 2.3 Value chain analysis
    • Value Chain Analysis

3 Market Sizing

  • 3.1 Market definition
    • Offerings of companies included in the market definition
  • 3.2 Market segment analysis
    • Market segments
  • 3.3 Market size 2023
    • 3.4 Market outlook: Forecast for 2023-2028
      • Chart on Europe - Market size and forecast 2023-2028 ($ million)
      • Data Table on Regional - Market size and forecast 2023-2028 ($ million)
      • Chart on Europe: Year-over-year growth 2023-2028 (%)
      • Data Table on Regional - Market size and forecast 2023-2028 ($ million)

    4 Historic Market Size

    • 4.1 Interactive Whiteboard Market in Europe 2018 - 2022
      • Historic Market Size - Data Table on Interactive Whiteboard Market in Europe 2018 - 2022 ($ million)
    • 4.2 End-user segment analysis 2018 - 2022
      • Historic Market Size - End-user Segment 2018 - 2022 ($ million)
    • 4.3 Technology segment analysis 2018 - 2022
      • Historic Market Size - Technology Segment 2018 - 2022 ($ million)
    • 4.4 Geography segment analysis 2018 - 2022
      • Historic Market Size - Geography Segment 2018 - 2022 ($ million)

    5 Five Forces Analysis

    • 5.1 Five forces summary
      • Five forces analysis - Comparison between 2023 and 2028
    • 5.2 Bargaining power of buyers
      • Bargaining power of buyers - Impact of key factors 2023 and 2028
    • 5.3 Bargaining power of suppliers
      • Bargaining power of suppliers - Impact of key factors in 2023 and 2028
    • 5.4 Threat of new entrants
      • Threat of new entrants - Impact of key factors in 2023 and 2028
    • 5.5 Threat of substitutes
      • Threat of substitutes - Impact of key factors in 2023 and 2028
    • 5.6 Threat of rivalry
      • Threat of rivalry - Impact of key factors in 2023 and 2028
    • 5.7 Market condition
      • Chart on Market condition - Five forces 2023 and 2028

    6 Market Segmentation by End-user

    • 6.1 Market segments
      • Chart on End-user - Market share 2023-2028 (%)
      • Data Table on End-user - Market share 2023-2028 (%)
    • 6.2 Comparison by End-user
      • Chart on Comparison by End-user
      • Data Table on Comparison by End-user
    • 6.3 Education sector - Market size and forecast 2023-2028
      • Chart on Education sector - Market size and forecast 2023-2028 ($ million)
      • Data Table on Education sector - Market size and forecast 2023-2028 ($ million)
      • Chart on Education sector - Year-over-year growth 2023-2028 (%)
      • Data Table on Education sector - Year-over-year growth 2023-2028 (%)
    • 6.4 Corporate sector - Market size and forecast 2023-2028
      • Chart on Corporate sector - Market size and forecast 2023-2028 ($ million)
      • Data Table on Corporate sector - Market size and forecast 2023-2028 ($ million)
      • Chart on Corporate sector - Year-over-year growth 2023-2028 (%)
      • Data Table on Corporate sector - Year-over-year growth 2023-2028 (%)
    • 6.5 Market opportunity by End-user
      • Market opportunity by End-user ($ million)
      • Data Table on Market opportunity by End-user ($ million)

    7 Market Segmentation by Technology

    • 7.1 Market segments
      • Chart on Technology - Market share 2023-2028 (%)
      • Data Table on Technology - Market share 2023-2028 (%)
    • 7.2 Comparison by Technology
      • Chart on Comparison by Technology
      • Data Table on Comparison by Technology
    • 7.3 Resistive - Market size and forecast 2023-2028
      • Chart on Resistive - Market size and forecast 2023-2028 ($ million)
      • Data Table on Resistive - Market size and forecast 2023-2028 ($ million)
      • Chart on Resistive - Year-over-year growth 2023-2028 (%)
      • Data Table on Resistive - Year-over-year growth 2023-2028 (%)
    • 7.4 Capacitive - Market size and forecast 2023-2028
      • Chart on Capacitive - Market size and forecast 2023-2028 ($ million)
      • Data Table on Capacitive - Market size and forecast 2023-2028 ($ million)
      • Chart on Capacitive - Year-over-year growth 2023-2028 (%)
      • Data Table on Capacitive - Year-over-year growth 2023-2028 (%)
    • 7.5 Infrared - Market size and forecast 2023-2028
      • Chart on Infrared - Market size and forecast 2023-2028 ($ million)
      • Data Table on Infrared - Market size and forecast 2023-2028 ($ million)
      • Chart on Infrared - Year-over-year growth 2023-2028 (%)
      • Data Table on Infrared - Year-over-year growth 2023-2028 (%)
    • 7.6 Electromagnetic pen - Market size and forecast 2023-2028
      • Chart on Electromagnetic pen - Market size and forecast 2023-2028 ($ million)
      • Data Table on Electromagnetic pen - Market size and forecast 2023-2028 ($ million)
      • Chart on Electromagnetic pen - Year-over-year growth 2023-2028 (%)
      • Data Table on Electromagnetic pen - Year-over-year growth 2023-2028 (%)
    • 7.7 Others - Market size and forecast 2023-2028
      • Chart on Others - Market size and forecast 2023-2028 ($ million)
      • Data Table on Others - Market size and forecast 2023-2028 ($ million)
      • Chart on Others - Year-over-year growth 2023-2028 (%)
      • Data Table on Others - Year-over-year growth 2023-2028 (%)
    • 7.8 Market opportunity by Technology
      • Market opportunity by Technology ($ million)
      • Data Table on Market opportunity by Technology ($ million)

    8 Customer Landscape

    • 8.1 Customer landscape overview
      • Analysis of price sensitivity, lifecycle, customer purchase basket, adoption rates, and purchase criteria

    9 Geographic Landscape

    • 9.1 Geographic segmentation
      • Chart on Market share by geography - 2023-2028 (%)
      • Data Table on Market share by geography - 2023-2028 (%)
    • 9.2 Geographic comparison
      • Chart on Geographic comparison
      • Data Table on Geographic comparison
    • 9.3 UK - Market size and forecast 2023-2028
      • Chart on UK - Market size and forecast 2023-2028 ($ million)
      • Data Table on UK - Market size and forecast 2023-2028 ($ million)
      • Chart on UK - Year-over-year growth 2023-2028 (%)
      • Data Table on UK - Year-over-year growth 2023-2028 (%)
    • 9.4 Germany - Market size and forecast 2023-2028
      • Chart on Germany - Market size and forecast 2023-2028 ($ million)
      • Data Table on Germany - Market size and forecast 2023-2028 ($ million)
      • Chart on Germany - Year-over-year growth 2023-2028 (%)
      • Data Table on Germany - Year-over-year growth 2023-2028 (%)
    • 9.5 France - Market size and forecast 2023-2028
      • Chart on France - Market size and forecast 2023-2028 ($ million)
      • Data Table on France - Market size and forecast 2023-2028 ($ million)
      • Chart on France - Year-over-year growth 2023-2028 (%)
      • Data Table on France - Year-over-year growth 2023-2028 (%)
    • 9.6 Italy - Market size and forecast 2023-2028
      • Chart on Italy - Market size and forecast 2023-2028 ($ million)
      • Data Table on Italy - Market size and forecast 2023-2028 ($ million)
      • Chart on Italy - Year-over-year growth 2023-2028 (%)
      • Data Table on Italy - Year-over-year growth 2023-2028 (%)
    • 9.7 Rest of Europe - Market size and forecast 2023-2028
      • Chart on Rest of Europe - Market size and forecast 2023-2028 ($ million)
      • Data Table on Rest of Europe - Market size and forecast 2023-2028 ($ million)
      • Chart on Rest of Europe - Year-over-year growth 2023-2028 (%)
      • Data Table on Rest of Europe - Year-over-year growth 2023-2028 (%)
    • 9.8 Market opportunity by geography
      • Market opportunity by geography ($ million)
      • Data Table on Market opportunity by geography ($ million)

    10 Drivers, Challenges, and Opportunity/Restraints

    • 10.1 Market drivers
      • 10.2 Market challenges
        • 10.3 Impact of drivers and challenges
          • Impact of drivers and challenges in 2023 and 2028
        • 10.4 Market opportunities/restraints

          11 Competitive Landscape

          • 11.1 Overview
            • 11.2 Competitive Landscape
              • Overview on criticality of inputs and factors of differentiation
            • 11.3 Landscape disruption
              • Overview on factors of disruption
            • 11.4 Industry risks
              • Impact of key risks on business

            12 Competitive Analysis

            • 12.1 Companies profiled
              • Companies covered
            • 12.2 Market positioning of companies
              • Matrix on companies position and classification
            • 12.3 Coretronic Corp.
              • Coretronic Corp. - Overview
              • Coretronic Corp. - Business segments
              • Coretronic Corp. - Key offerings
              • Coretronic Corp. - Segment focus
            • 12.4 Dahua Technology Co. Ltd.
              • Dahua Technology Co. Ltd. - Overview
              • Dahua Technology Co. Ltd. - Product / Service
              • Dahua Technology Co. Ltd. - Key news
              • Dahua Technology Co. Ltd. - Key offerings
            • 12.5 Emerald X LLC
              • Emerald X LLC - Overview
              • Emerald X LLC - Business segments
              • Emerald X LLC - Key offerings
              • Emerald X LLC - Segment focus
            • 12.6 Hitachi Ltd.
              • Hitachi Ltd. - Overview
              • Hitachi Ltd. - Business segments
              • Hitachi Ltd. - Key news
              • Hitachi Ltd. - Key offerings
              • Hitachi Ltd. - Segment focus
            • 12.7 Microsoft Corp.
              • Microsoft Corp. - Overview
              • Microsoft Corp. - Business segments
              • Microsoft Corp. - Key news
              • Microsoft Corp. - Key offerings
              • Microsoft Corp. - Segment focus
            • 12.8 Qisda Corp.
              • Qisda Corp. - Overview
              • Qisda Corp. - Product / Service
              • Qisda Corp. - Key offerings
            • 12.9 Ricoh Co. Ltd.
              • Ricoh Co. Ltd. - Overview
              • Ricoh Co. Ltd. - Business segments
              • Ricoh Co. Ltd. - Key news
              • Ricoh Co. Ltd. - Key offerings
              • Ricoh Co. Ltd. - Segment focus
            • 12.10 Samsung Electronics Co. Ltd.
              • Samsung Electronics Co. Ltd. - Overview
              • Samsung Electronics Co. Ltd. - Business segments
              • Samsung Electronics Co. Ltd. - Key news
              • Samsung Electronics Co. Ltd. - Key offerings
              • Samsung Electronics Co. Ltd. - Segment focus
            • 12.11 Seiko Epson Corp.
              • Seiko Epson Corp. - Overview
              • Seiko Epson Corp. - Business segments
              • Seiko Epson Corp. - Key news
              • Seiko Epson Corp. - Key offerings
              • Seiko Epson Corp. - Segment focus
            • 12.12 Sharp Corp.
              • Sharp Corp. - Overview
              • Sharp Corp. - Business segments
              • Sharp Corp. - Key news
              • Sharp Corp. - Key offerings
              • Sharp Corp. - Segment focus
            • 12.13 SMART Technologies ULC
              • SMART Technologies ULC - Overview
              • SMART Technologies ULC - Product / Service
              • SMART Technologies ULC - Key offerings
            • 12.14 StarBoard Solution GmbH
              • StarBoard Solution GmbH - Overview
              • StarBoard Solution GmbH - Product / Service
              • StarBoard Solution GmbH - Key offerings
            • 12.15 VideoCentric Ltd.
              • VideoCentric Ltd. - Overview
              • VideoCentric Ltd. - Product / Service
              • VideoCentric Ltd. - Key offerings
            • 12.16 ViDiS SA
              • ViDiS SA - Overview
              • ViDiS SA - Product / Service
              • ViDiS SA - Key offerings
            • 12.17 ViewSonic Corp.
              • ViewSonic Corp. - Overview
              • ViewSonic Corp. - Product / Service
              • ViewSonic Corp. - Key offerings

            13 Appendix

            • 13.1 Scope of the report
              • 13.2 Inclusions and exclusions checklist
                • Inclusions checklist
                • Exclusions checklist
              • 13.3 Currency conversion rates for US$
                • Currency conversion rates for US$
              • 13.4 Research methodology
                • Research methodology
              • 13.5 Data procurement
                • Information sources
              • 13.6 Data validation
                • Data validation
              • 13.7 Validation techniques employed for market sizing
                • Validation techniques employed for market sizing
              • 13.8 Data synthesis
                • Data synthesis
              • 13.9 360 degree market analysis
                • 360 degree market analysis
              • 13.10 List of abbreviations
                • List of abbreviations

              Research Methodology

              Technavio presents a detailed picture of the market by way of study, synthesis, and summation of data from multiple sources. The analysts have presented the various facets of the market with a particular focus on identifying the key industry influencers. The data thus presented is comprehensive, reliable, and the result of extensive research, both primary and secondary.

              INFORMATION SOURCES

              Primary sources

              • Manufacturers and suppliers
              • Channel partners
              • Industry experts
              • Strategic decision makers

              Secondary sources

              • Industry journals and periodicals
              • Government data
              • Financial reports of key industry players
              • Historical data
              • Press releases

              DATA ANALYSIS

              Data Synthesis

              • Collation of data
              • Estimation of key figures
              • Analysis of derived insights

              Data Validation

              • Triangulation with data models
              • Reference against proprietary databases
              • Corroboration with industry experts

              REPORT WRITING

              Qualitative

              • Market drivers
              • Market challenges
              • Market trends
              • Five forces analysis

              Quantitative

              • Market size and forecast
              • Market segmentation
              • Geographical insights
              • Competitive landscape

              Interested in this report?

              Get your sample now to see our research methodology and insights!

              Download Now

              Frequently Asked Questions

              Interactive Whiteboardin Europe market growth will increase by $ 226.4 mn during 2024-2028.

              The Interactive Whiteboardin Europe market is expected to grow at a CAGR of 6.78% during 2024-2028.

              Interactive Whiteboardin Europe market is segmented by End-user( Education sector, Corporate sector) Technology( Resistive, Capacitive, Infrared, Electromagnetic pen, Others)

              Classroom365 Ltd., Coretronic Corp., Dahua Technology Co. Ltd., Emerald X LLC, Hitachi Ltd., LG Electronics Inc., Mercells services, Microsoft Corp., NTS systems and trade Ltd., Qisda Corp., Ricoh Co. Ltd., Samsung Electronics Co. Ltd., Seiko Epson Corp., Sharp Corp., SMART Technologies ULC, StarBoard Solution GmbH, VideoCentric Ltd., ViDiS SA, ViewSonic Corp. are a few of the key vendors in the Interactive Whiteboardin Europe market.

              Europe will register the highest growth rate of 100% among the other regions. Therefore, the Interactive Whiteboardin Europe market in Europe is expected to garner significant business opportunities for the vendors during the forecast period.

              UK, Germany, France, Italy, Rest of Europe

              • Increasing use of advanced technologies in education sectorThe education sector in Europe has grown by double digits during the last decade due to an increased focus on basic education. Moreover is the driving factor this market.
              • governments in Europe are supporting this sector's growth by increasingly investing in opening new schools and educational institutions. The education sector in Europe has witnessed substantial technological advances over the past decade in terms of how education is imparted. As a result of the technological innovation wave is the driving factor this market.
              • which has changed every sector is the driving factor this market.
              • the education sector has also seen noticeable changes in classroom teaching techniques. Schools across Europe are becoming increasingly reliant on advanced technologies to make the education system more efficient and effective. Teachers are increasingly using advanced technologies such as interactive whiteboards is the driving factor this market.
              • flat-panel technology is the driving factor this market.
              • touchscreen tablets and computers is the driving factor this market.
              • and other educational audio/visual technology such as 3D projectors. With the integration of interactive whiteboards into the classroom is the driving factor this market.
              • teachers can create interactive and engaging lessons that boost learning and reduce distractions among students. Also is the driving factor this market.
              • images and graphs appear clearer and more accurate in interactive whiteboards when compared with traditional teaching methods. As the new generation of learners becomes more tech-savvy is the driving factor this market.
              • it is important for educational institutions to adopt technologies such as interactive whiteboards in Europe. Hence is the driving factor this market.
              • the growing use of advanced technologies in the education sector in Europe is expected to drive the demand for interactive whiteboards in the region is the driving factor this market.
              • thereby driving the growth of the interactive whiteboard market in Europe during the forecast period. is the driving factor this market.

              The Interactive Whiteboardin Europe market vendors should focus on grabbing business opportunities from the Education sector segment as it accounted for the largest market share in the base year.
              RIA - Research AI Assistant
              Ask RIA