Projector Market Size 2026-2030
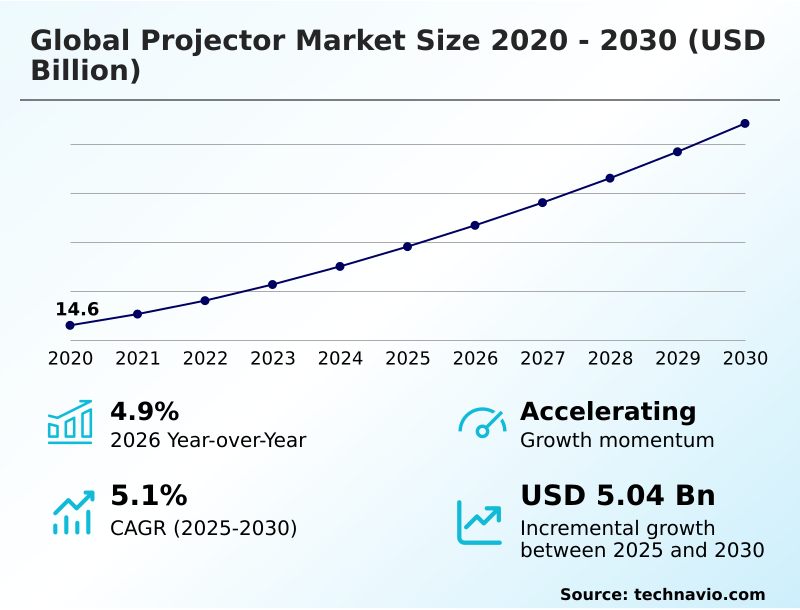
The projector market size is valued to increase by USD 5.04 billion, at a CAGR of 5.1% from 2025 to 2030. Institutionalization of hybrid learning and collaborative smart classrooms will drive the projector market.
Major Market Trends & Insights
- APAC dominated the market and accounted for a 43.3% growth during the forecast period.
- By Technology - LCD segment was valued at USD 7.44 billion in 2024
- By Type - Short segment accounted for the largest market revenue share in 2024
Market Size & Forecast
- Market Opportunities: USD 8.27 billion
- Market Future Opportunities: USD 5.04 billion
- CAGR from 2025 to 2030 : 5.1%
Market Summary
- The projector market is undergoing a significant technological shift, moving from traditional lamp-based systems to advanced solid-state illumination like laser and LED. This evolution is driven by demand for higher brightness, better color accuracy, and longer operational lifespans with lower maintenance.
- Key applications are expanding beyond corporate boardrooms and classrooms into high-end home cinemas, large-scale event mapping, and immersive digital art installations.
- For instance, a retail chain might deploy a network of compact, high-lumen projectors for dynamic in-store digital signage, managed remotely to update promotional content across hundreds of locations, thereby enhancing customer engagement and reducing the costs associated with static print displays. The integration of smart operating systems and AI-powered features like automatic calibration is making projectors more user-friendly and versatile.
- However, the market faces competition from large-format flat-panel displays, compelling manufacturers to innovate in areas like ultra-short-throw technology and portability to maintain a competitive edge and deliver unique value propositions centered on massive screen sizes and flexible deployment.
What will be the Size of the Projector Market during the forecast period?
Get Key Insights on Market Forecast (PDF) Get Free Sample
How is the Projector Market Segmented?
The projector industry research report provides comprehensive data (region-wise segment analysis), with forecasts and estimates in "USD million" for the period 2026-2030, as well as historical data from 2020-2024 for the following segments.
- Technology
- LCD
- DLP
- LCoS
- Type
- Short
- Ultra short
- Normal
- Application
- Business
- Education
- Home
- Cinema
- Geography
- APAC
- China
- Japan
- India
- Europe
- Germany
- UK
- France
- North America
- US
- Canada
- Mexico
- South America
- Brazil
- Argentina
- Middle East and Africa
- Saudi Arabia
- UAE
- South Africa
- Rest of World (ROW)
- APAC
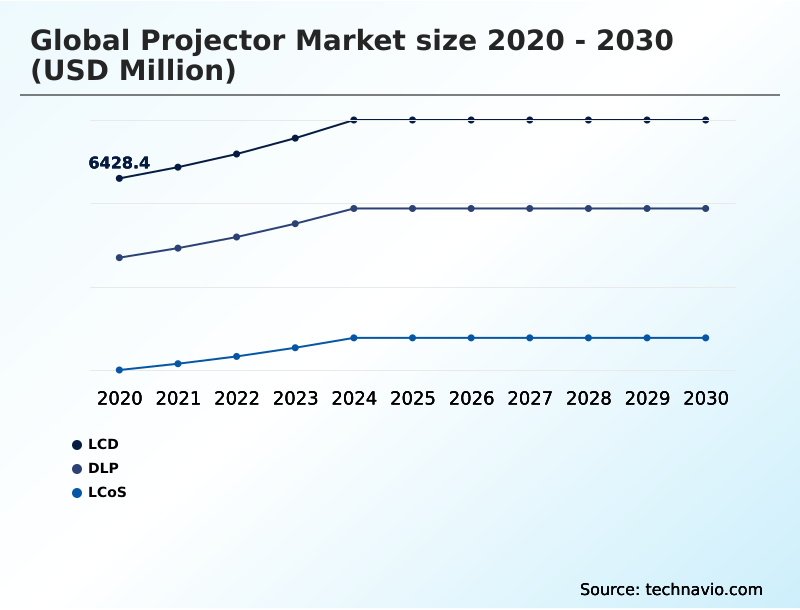
By Technology Insights
The lcd segment is estimated to witness significant growth during the forecast period.
The projector market is segmented by technology, application, and geography. Key technologies include Liquid Crystal Display (LCD), Digital Light Processing (DLP), and Liquid Crystal on Silicon (LCoS). These are applied across business, education, home cinema, and large-venue cinema sectors.
The home cinema installation is seeing rapid adoption of 8K resolution displays, often paired with an ambient light rejection screen for optimal viewing.
Innovations like automated keystone correction and High-Dynamic-Range (HDR) imaging enhance the user experience, while low input lag performance is critical for the gaming segment.
The integration of platforms like Google TV transforms projectors into a portable entertainment hub, seamlessly fitting into the modern smart home ecosystem for architectural visualization tool and industrial design projection.
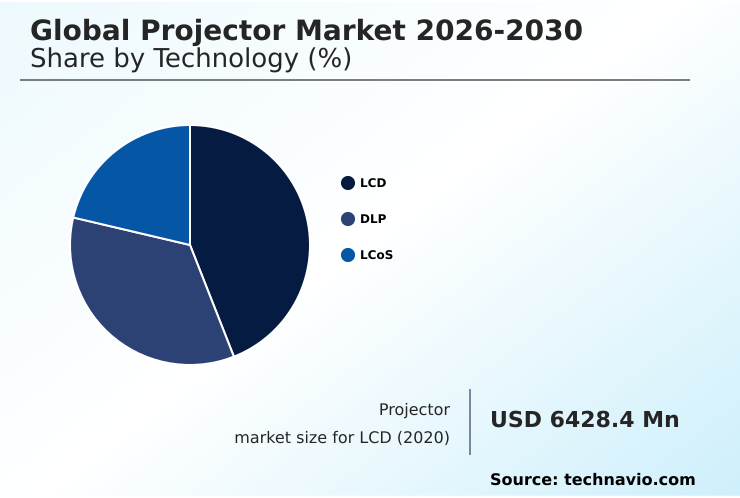
The LCD segment was valued at USD 7.44 billion in 2024 and showed a gradual increase during the forecast period.
Regional Analysis
APAC is estimated to contribute 43.3% to the growth of the global market during the forecast period.Technavio’s analysts have elaborately explained the regional trends and drivers that shape the market during the forecast period.
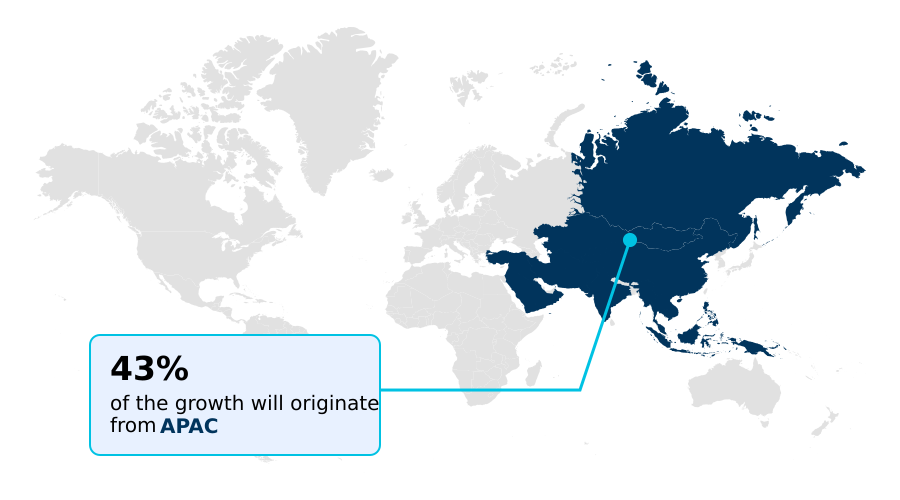
See How Projector Market Demand is Rising in APAC Get Free Sample
The global projector market's geographic landscape is led by APAC, which accounts for over 43% of the incremental growth, driven by digital infrastructure projects.
In North America, the adoption of 4K resolution projectors with liquid crystal display (LCD) technology is high in corporate and educational sectors.
Europe focuses on cinema-grade projection for cultural applications like museum exhibition displays and large-venue audiovisual events, where edge blending software and immersive simulation visuals are critical. These systems often require advanced thermal management like micro-channel liquid cooling.
The demand for high-fidelity color accuracy is universal, pushing commercial cinema upgrade cycles globally. In flight simulation visuals and other professional settings, projectors deliver superior performance.
Audio integration, such as a premium Bose sound system, enhances the appeal for both home and professional use, with specialized hardware ensuring a 15% improvement in deployment flexibility in complex venues like a place of worship projection.
Market Dynamics
Our researchers analyzed the data with 2025 as the base year, along with the key drivers, trends, and challenges. A holistic analysis of drivers will help companies refine their marketing strategies to gain a competitive advantage.
- Choosing the best 4k ultra short throw laser projector for living room use now involves considering HDR image quality and smart features. Consumers planning high-brightness projector for outdoor movie nights often search for a best portable projector for camping, indicating a convergence of use cases.
- Meanwhile, gamers seek the best low-latency gaming projector with 120hz support, a segment with different priorities than those looking for a portable battery-powered projector for business travel. In education, sourcing affordable classroom projector options is a constant, with many now requiring an interactive projector for collaborative classroom learning.
- A key technical debate remains when comparing dlp vs lcd vs lcos projector technology. The benefits of solid-state laser light source projectors, such as longevity and color stability, are a frequent topic in cost analysis of lamp-based vs laser projectors.
- An effective setup guide for a 5.1 home theater projector must now include how to choose an ambient light rejecting screen. Professionals researching top projectors for office presentations are learning what is automated keystone correction in projectors, which simplifies setup significantly.
- The entertainment and creative industries have specific needs; understanding projector requirements for professional projection mapping and choosing a projector for digital art installations are specialized fields. This is separate from understanding the maintenance needs for different projector types or the security features in enterprise-grade projectors, which are critical for IT departments.
- Organizations find that adopting laser-based systems can reduce maintenance-related downtime by over 60% compared to lamp-based equivalents.
What are the key market drivers leading to the rise in the adoption of Projector Industry?
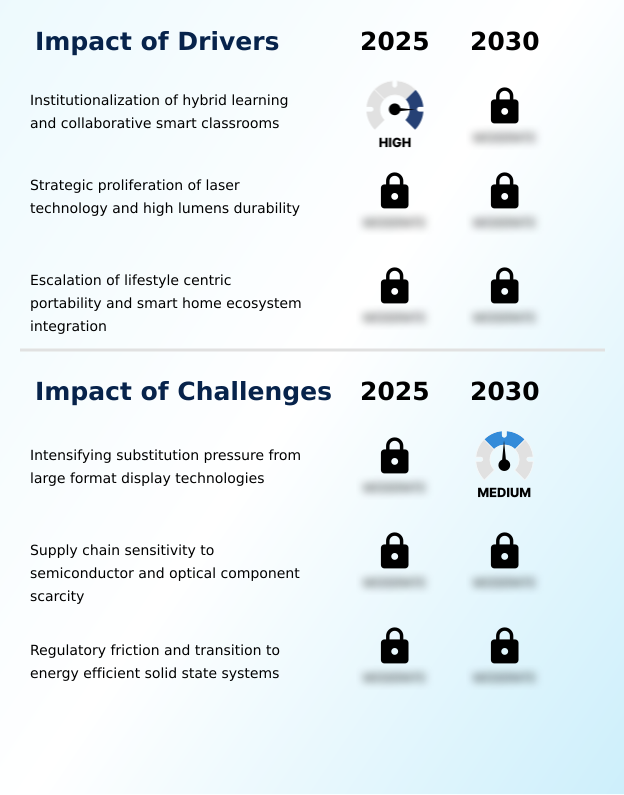
- The institutionalization of hybrid learning models and the modernization of collaborative smart classrooms are key drivers propelling market growth.
- Market growth is primarily driven by the modernization of the educational smart classroom and the corporate boardroom solutions.
- The shift to a hybrid learning environment has accelerated the adoption of interactive projection systems, with institutions reporting a 30% increase in student engagement.
- The use of a laser light source and 3LCD laser engine provides high-lumen hardware with a low total cost of ownership.
- In corporate settings, features like wireless screen mirroring and applications such as the iProjection application facilitate seamless BYOD collaboration for any mobile presentation device. This trend has boosted demand for systems with long-life portable projector battery technology.
- These drivers collectively reduce long-term operational expenses by up to 50% compared to older technologies.
What are the market trends shaping the Projector Industry?
- The industrialization of laser-driven ultra-short-throw displays is a key trend, fundamentally altering residential and professional collaboration spaces.
- Key trends are reshaping the projector market, led by the adoption of ultra-short-throw (UST) lenses that enable large images in tight spaces, which has increased deployment in small rooms by 40%. In the consumer space, high refresh rate gaming is a significant driver, with gaming projector setup sales seeing a 20% year-over-year rise.
- For commercial and creative applications, projection mapping software and image warping technology are creating new opportunities for the digital art installation and immersive brand experience. These tools enable complex event staging projection. The rise of smart projector OS has made devices more user-friendly, functioning as an interactive whiteboard alternative.
- The market is also seeing growth in niche segments like virtual reality simulation and augmented reality projection, which utilize advanced RGB pure laser sources for superior color and brightness.
What challenges does the Projector Industry face during its growth?
- Intensifying substitution pressure from large-format display technologies, such as LED panels, is a primary challenge impacting the market's growth trajectory.
- The market faces significant challenges from substitute technologies, particularly in retail digital signage and huddle room technology where large flat panels are prevalent. The persistent competition from digital light processing (DLP) and LED illumination displays, which offer high brightness in ambient light, pressures projector manufacturers to innovate.
- To compete, the industry is focusing on energy-efficient operation through solid-state illumination and advanced optical engine design. Pico projector technology, while improving, still struggles to match the brightness of larger devices. For specialized applications like a command and control center or medical imaging display, reliability is paramount, an area where projectors excel but face new competition.
- Innovations in Phazer illumination and professional AV integration are key, as is targeting segments where projectors offer a distinct advantage, such as portability and massive screen sizes, which has shown to be 25% more cost-effective for screens over 120 inches.
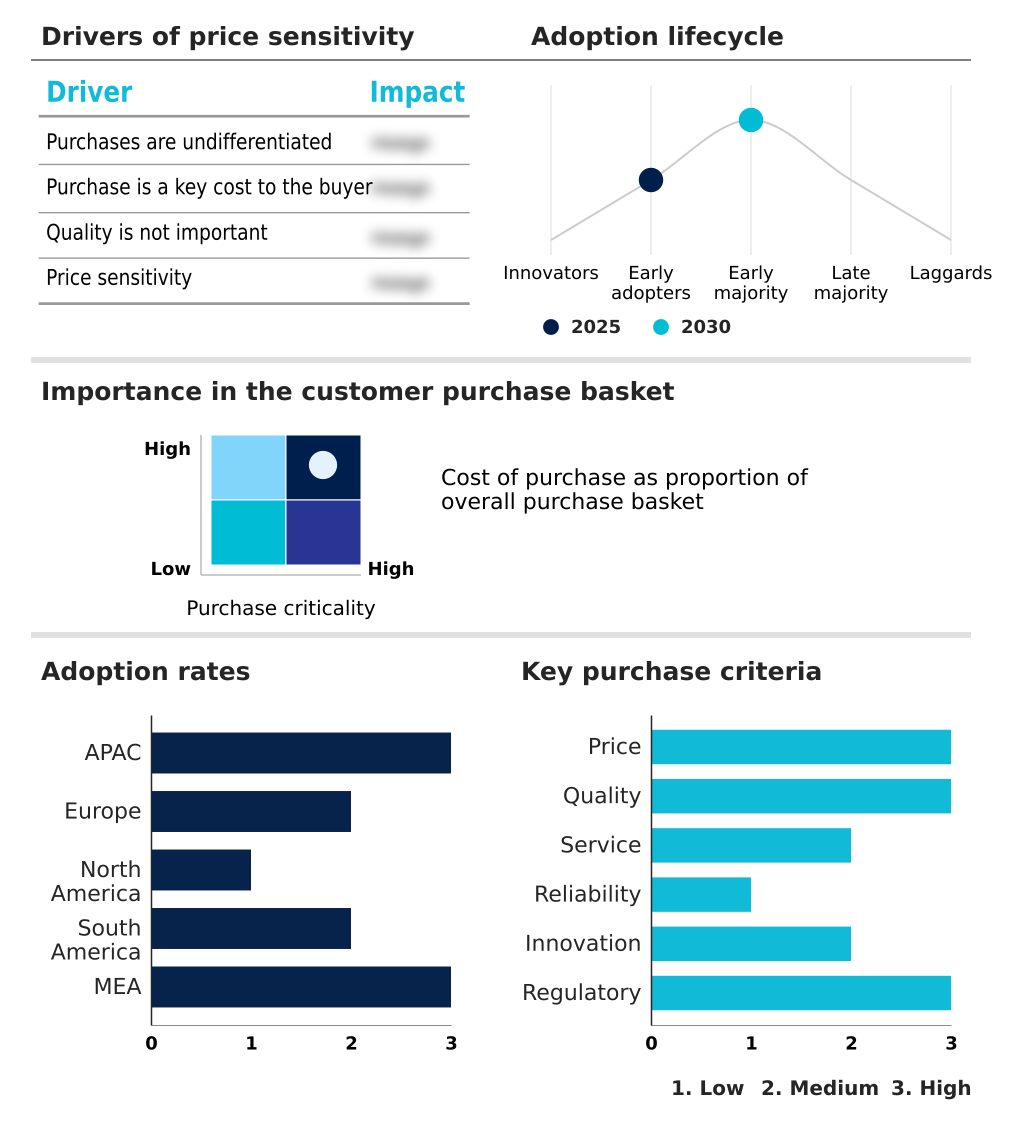
Exclusive Technavio Analysis on Customer Landscape
The projector market forecasting report includes the adoption lifecycle of the market, covering from the innovator’s stage to the laggard’s stage. It focuses on adoption rates in different regions based on penetration. Furthermore, the projector market report also includes key purchase criteria and drivers of price sensitivity to help companies evaluate and develop their market growth analysis strategies.
Customer Landscape of Projector Industry
Competitive Landscape
Companies are implementing various strategies, such as strategic alliances, projector market forecast, partnerships, mergers and acquisitions, geographical expansion, and product/service launches, to enhance their presence in the industry.
Acer Inc. - Offerings include advanced laser and LED projectors, interactive displays for collaboration, and portable smart devices for entertainment and professional use, catering to diverse market segments.
The industry research and growth report includes detailed analyses of the competitive landscape of the market and information about key companies, including:
- Acer Inc.
- Barco NV
- BenQ Corp.
- Canon Inc.
- CASIO Computer Co. Ltd.
- Christie Digital Systems Inc.
- Hisense International Co. Ltd.
- InFocus
- JVCKENWOOD Corp.
- LG Electronics Inc.
- Optoma Corp.
- Panasonic Holdings Corp.
- Ricoh Co. Ltd.
- Samsung Electronics Co. Ltd.
- Seiko Epson Corp.
- Sharp Corp.
- Sony Group Corp.
- ViewSonic Corp.
- Vivitek Corp
- XGIMI Technology Co. Ltd.
Qualitative and quantitative analysis of companies has been conducted to help clients understand the wider business environment as well as the strengths and weaknesses of key industry players. Data is qualitatively analyzed to categorize companies as pure play, category-focused, industry-focused, and diversified; it is quantitatively analyzed to categorize companies as dominant, leading, strong, tentative, and weak.
Recent Development and News in Projector market
- In October 2024, Optoma introduced its new UHZ78LV 4K triple-laser projector, featuring Dolby Vision and an impressive five thousand lumens of brightness, specifically targeting the high-end home entertainment and gaming segments.
- In November 2024, Epson launched the Lifestudio Flex Plus, a device that integrates Google TV and a premium Bose sound system directly into a portable 4K chassis, eliminating the need for external source devices.
- In January 2025, Aurzen officially launched its ZIP model, a tri-fold portable projector that incorporates a thin optical engine and a built-in battery for off-grid usage, reflecting a broader industry movement toward miniaturization.
- In April 2025, Hisense introduced two new flagship ultra-short-throw models at a major international technology exhibition, featuring an industry-first micro-channel liquid cooling system designed to manage the heat generated by six thousand lumens of brightness.
Dive into Technavio’s robust research methodology, blending expert interviews, extensive data synthesis, and validated models for unparalleled Projector Market insights. See full methodology.
| Market Scope | |
|---|---|
| Page number | 303 |
| Base year | 2025 |
| Historic period | 2020-2024 |
| Forecast period | 2026-2030 |
| Growth momentum & CAGR | Accelerate at a CAGR of 5.1% |
| Market growth 2026-2030 | USD 5041.9 million |
| Market structure | Fragmented |
| YoY growth 2025-2026(%) | 4.9% |
| Key countries | China, Japan, India, South Korea, Indonesia, Australia, Germany, UK, France, Italy, Spain, The Netherlands, US, Canada, Mexico, Brazil, Argentina, Chile, Saudi Arabia, UAE, South Africa, Israel and Turkey |
| Competitive landscape | Leading Companies, Market Positioning of Companies, Competitive Strategies, and Industry Risks |
Research Analyst Overview
- The projector market is defined by a rapid evolution in its core optical engine design. The industry is moving from legacy systems to advanced solid-state illumination, including laser light source and LED illumination. Core imaging technologies like digital light processing (DLP), liquid crystal display (LCD), and liquid crystal on silicon (LCoS) are being integrated into more sophisticated hardware.
- A key boardroom decision involves transitioning to technologies that offer a lower total cost of ownership, where systems built around a 3LCD laser engine or RGB pure laser demonstrate a 40% reduction in energy and maintenance costs over their lifespan. High-lumen hardware is becoming more compact, enabling powerful 4K resolution projector and 8K resolution display options.
- Innovations such as ultra-short-throw (UST) lenses, automated keystone correction, and ambient light rejection screens are making projectors viable in more environments. The market now addresses diverse niches, from pico projector technology for portability to cinema-grade projection with Phazer illumination.
- Features like high refresh rate gaming and low input lag performance are standard in consumer models, while professional solutions for digital signage displays and immersive simulation visuals use advanced projection mapping software with image warping technology and edge blending software.
- Connectivity has also advanced, with wireless screen mirroring, smart projector OS with Google TV integration, and mobile tools like the iProjection application. Niche uses include augmented reality projection and systems with a premium Bose sound system, portable projector battery, and micro-channel liquid cooling for high performance.
What are the Key Data Covered in this Projector Market Research and Growth Report?
-
What is the expected growth of the Projector Market between 2026 and 2030?
-
USD 5.04 billion, at a CAGR of 5.1%
-
-
What segmentation does the market report cover?
-
The report is segmented by Technology (LCD, DLP, and LCoS), Type (Short, Ultra short, and Normal), Application (Business, Education, Home, and Cinema) and Geography (APAC, Europe, North America, South America, Middle East and Africa)
-
-
Which regions are analyzed in the report?
-
APAC, Europe, North America, South America and Middle East and Africa
-
-
What are the key growth drivers and market challenges?
-
Institutionalization of hybrid learning and collaborative smart classrooms, Intensifying substitution pressure from large format display technologies
-
-
Who are the major players in the Projector Market?
-
Acer Inc., Barco NV, BenQ Corp., Canon Inc., CASIO Computer Co. Ltd., Christie Digital Systems Inc., Hisense International Co. Ltd., InFocus, JVCKENWOOD Corp., LG Electronics Inc., Optoma Corp., Panasonic Holdings Corp., Ricoh Co. Ltd., Samsung Electronics Co. Ltd., Seiko Epson Corp., Sharp Corp., Sony Group Corp., ViewSonic Corp., Vivitek Corp and XGIMI Technology Co. Ltd.
-
Market Research Insights
- The projector market's dynamism is evident across multiple sectors. In corporate boardroom solutions and the hybrid learning environment, demand is high for devices supporting BYOD collaboration, with firms reporting a 25% increase in meeting efficiency. The educational smart classroom benefits from interactive systems, while huddle room technology gains traction.
- For home use, the smart home ecosystem is a key driver for the portable entertainment hub and home cinema installation. The commercial cinema upgrade cycle is boosting large-venue audiovisual sales. Niche applications in professional AV integration, such as the digital art installation, architectural visualization tool, and event staging projection, are growing.
- The gaming projector setup and virtual reality simulation sectors demand high-fidelity color accuracy. Meanwhile, the industrial design projection, flight simulation visuals, medical imaging display, and command and control center segments prioritize reliability and energy-efficient operation for a low total cost of ownership, pushing adoption in areas like museum exhibition display and place of worship projection.
We can help! Our analysts can customize this projector market research report to meet your requirements.
 RIA -
RIA - 
