Interactive Flat Panels Market Analysis North America, APAC, Europe, Middle East and Africa, South America - US, UK, China, Germany, Japan - Size and Forecast 2024-2028

Interactive Flat Panels Market Analysis North America, APAC, Europe, Middle East and Africa, South America - US, UK, China, Germany, Japan - Size and Forecast 2024-2028

Published: May 2024 172 Pages SKU: IRTNTR45592

Market Overview at a Glance

$10.16 B
Market Opportunity
10.93%
CAGR
9.57
YoY growth 2023-2024(%)

Interactive Flat Panels Market Size 2024-2028

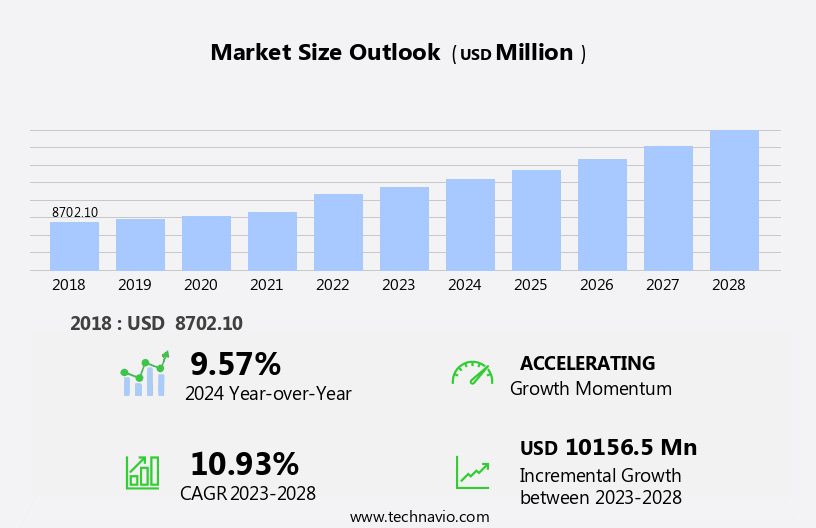
The interactive flat panels market size is forecast to increase by USD 10.16 billion at a CAGR of 10.93% between 2023 and 2028.

  • The market is witnessing significant growth due to the expansion of the e-learning sector and the increasing adoption of gamification in education. The integration of advanced technologies, such as touchscreens and interactive whiteboards, is enhancing the learning experience, making it more engaging and interactive. However, the high cost of interactive flat panels remains a major challenge for market growth. Despite this, the market is expected to continue expanding as schools and universities recognize the benefits of using these advanced technologies to enhance teaching and learning. The market analysis report provides a comprehensive study of these trends and growth factors, offering valuable insights for stakeholders and industry participants.
  • What will be the Size of the Interactive Flat Panels Market During the Forecast Period?

    Interactive Flat Panels Market Size

     Request Free Sample

  • The market is experiencing significant growth in various business settings due to the increasing demand for collaborative decision-making and dynamic data visualization. These advanced displays offer accessibility and affordability, making them an attractive alternative to traditional whiteboards and monitors. Technological advancements, such as touchscreen displays and peripheral devices, have expanded the market's scope, enabling applications in sectors like education, mobiles, tablets, interactive kiosks, and video walls. Economies of scale have further fueled market growth, allowing manufacturers to offer competitive pricing and high-quality products. The market's versatility, including its compatibility with various tablets and monitors, has increased its adoption across industries, solidifying its position as a valuable business solution.
  • How is this Interactive Flat Panels Industry segmented and which is the largest segment?

    The interactive flat panels industry research report provides comprehensive data (region-wise segment analysis), with forecasts and estimates in "USD million" for the period 2024-2028, as well as historical data from 2018-2022 for the following segments.

    • Application
      • Education sector
      • Corporate sector
    • Display Type
      • Plasma and LCD flat panels
      • Interactive UHD/4K flat panels
      • HD flat panels
    • Geography
      • North America
        • US
      • APAC
        • China
        • Japan
      • Europe
        • Germany
        • UK
      • Middle East and Africa
        • South America

        By Application Insights

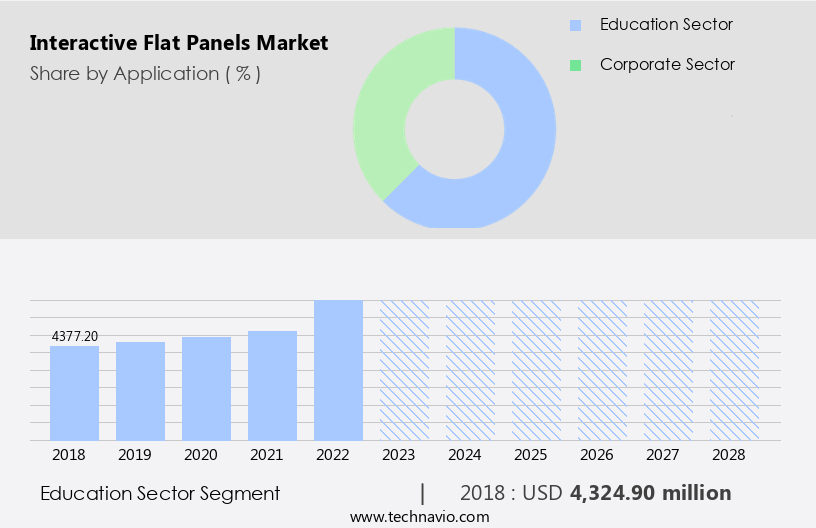
        • The education sector segment is estimated to witness significant growth during the forecast period.

        Interactive flat panels have become essential tools in modern education settings, transforming traditional classrooms into digital learning environments. These panels enable teachers to present content more effectively, allowing them to display materials from their computers or laptops for student engagement. The education sector, comprising schools and colleges managed by both government and private entities, is increasingly embracing e-learning. Interactive displays play a crucial role in delivering content interactively within this e-learning landscape, enhancing the educational experience. Key industries like BFSI, Corporate, and Hospitality are also adopting interactive flat panels for collaborative decision-making, digital signage, and customer engagement. Accessibility features, such as touchscreens and touchless interactive displays, cater to diverse user needs.

        Affordability, technological advancements, and economies of scale contribute to the growing popularity of interactive flat panels in various business settings.

        Interactive Flat Panels Market Size

        Get a glance at the  Interactive Flat Panels Industry report of share of various segments Request Free Sample

        The Education sector segment was valued at USD 4.32 billion in 2018 and showed a gradual increase during the forecast period.

        Regional Analysis

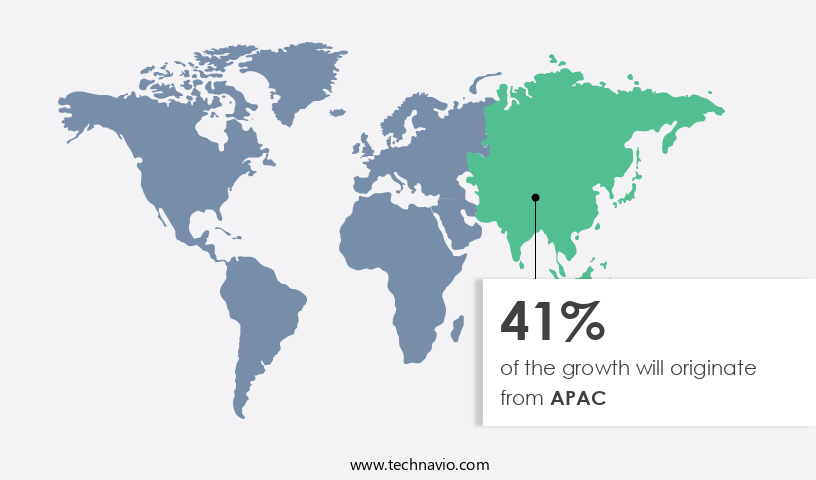
        • APAC is estimated to contribute 41% to the growth of the global market during the forecast period.

        Technavio’s analysts have elaborately explained the regional trends and drivers that shape the market during the forecast period.

        Interactive Flat Panels Market Share by Geography

        For more insights on the market share of various regions, Request Free Sample

        In North America, the education sector is embracing interactive technologies to enhance the learning experience. The US government's focus on improving education quality through Common Core Standards (CSS) in K-12 and higher education sectors fuels this trend. Interactive components, such as gamification and video tutorials, are popular active learning techniques. Collaborative software, including learning management systems (LMS) and classroom management systems (CMS), facilitate a collaborative learning environment. These tools are integral to digital classrooms, which are increasingly common in schools and businesses. Accessibility features, such as touchless interactive displays, cater to diverse learning needs. The adoption of high definition displays, dynamic data visualization, and virtual meetings further enhances productivity in corporate sectors and the BFSI industry.

        Affordability, driven by economies of scale and competition, makes these technologies accessible to a wider audience. Retail applications, advertising, and urbanization also contribute to the growth of the interactive display market.

        Market Dynamics

        Our  researchers analyzed the data with 2023 as the base year, along with the key drivers, trends, and challenges. A holistic analysis of drivers will help companies refine their marketing strategies to gain a competitive advantage.

        What are the key market drivers leading to the rise In the adoption of Interactive Flat Panels Industry?

        Growth of e-learning is the key driver of the market.

      • The market encompasses a range of technologies and applications, including interactive whiteboards, touchscreen displays, and video walls. These panels offer enhanced accessibility for users through additional hardware and software features, such as wireless connectivity and collaborative decision-making tools. The market is driven by various factors, including technological advancements, increased affordability, and the growing demand for digital classrooms and remote work environments. In business settings, interactive flat panels are utilized In the Corporate industry and BFSI sector for presentations, advertising, and online shopping. In education, they are increasingly adopted in schools and universities for interactive learning experiences and dynamic data visualization.
      • The hospitality industry also leverages these panels for digital signage and entertainment. The use of interactive components, such as touch screens and touchless interactive displays, has become essential in various applications, including medical imaging and virtual meetings. However, high costs associated with production delays and supply chain disruptions can pose challenges to the market's growth. The market for Interactive Flat Panels is expected to grow significantly due to economies of scale, increased internet penetration, and the adoption of technological advancements. Applications in retail sectors, urbanization, and online advertising are also expected to contribute to the market's expansion. In summary, the market offers numerous benefits, including reduced operational costs, consistent quality, and better retention.
      • Its applications span across various industries, including education, business, hospitality, and healthcare, making it a versatile and valuable technology for organizations and individuals alike.
      • What are the market trends shaping the Interactive Flat Panels Industry?

        Increased adoption of gamification is the upcoming market trend.

      • The market has witnessed significant growth in various industries, including education, corporate sectors, and the BFSI industry. This market is driven by technological advancements, increased accessibility, and affordability. Interactive components, such as touch screens and touchless interactive displays, have become essential in digital classrooms, enabling interactive learning experiences. In the education sector, gamification has emerged as a popular trend, enhancing collaborative decision-making and making learning more engaging for students. Interactive whiteboards and touchscreen tables are increasingly used in corporate settings for remote work and virtual meetings. Additionally, digital signage and video walls are prevalent in retail applications and hospitality industries for advertising and promotions.
      • The market's expansion is further fueled by economies of scale, production delays, and supply chain disruptions. High definition displays and monitors are in high demand, with laptops, mobiles, and tablets acting as peripheral devices. Medical professionals rely on high-definition displays for CT scans and MRIs, while urbanization and online shopping have increased the demand for interactive kiosks. The market's growth is expected to continue as technological advancements and internet penetration drive adoption in various industries.
      • What challenges does the Interactive Flat Panels Industry face during its growth?

        High cost of interactive flat panels is a key challenge affecting the industry growth.

      • Interactive flat panels, also known as interactive whiteboards or touchscreen displays, are becoming increasingly popular in various sectors due to their ability to enhance collaboration and engagement. These advanced display panels offer additional hardware and software features, such as interactive components, dynamic data visualization, and gamification, making them suitable for use in classrooms, business settings, and the entertainment industry. However, the high costs associated with these panels, including production delays and increased costs for additional hardware and software, can hinder market growth. In the education sector, interactive flat panels are transforming digital classrooms by providing interactive learning experiences and enabling remote learning.
      • In the corporate industry and sectors, they facilitate collaborative decision-making and virtual meetings. In the hospitality industry, they are used for digital signage and online advertising. However, the high costs and lack of modularity can limit their adoption, particularly in smaller businesses and schools. Interactive flat panels come in various sizes, from small touchscreen tables to large video walls, and employ technologies such as multi-touch screens and touchless interactive displays. They offer high definition displays and support for peripheral devices such as laptops, mobiles, and projectors. In the healthcare industry, they are used for displaying medical images, such as CT scans and MRIs, to medical professionals for diagnosis and treatment planning.
      • Despite the high costs, the market for interactive flat panels is expected to grow due to increased internet penetration, technological advancements, and the need for affordability. The market is also driven by the adoption of remote work and online shopping, as well as the use of interactive kiosks in retail applications and at transportation hubs such as airports and railway stations. In conclusion, the interactive flat panel market offers numerous benefits, including increased productivity, engagement, and collaboration. However, the high costs and lack of modularity can be barriers to entry for some businesses and organizations. Despite these challenges, the market is expected to grow due to technological advancements, increased demand, and the need for affordability.
      • Exclusive Customer Landscape

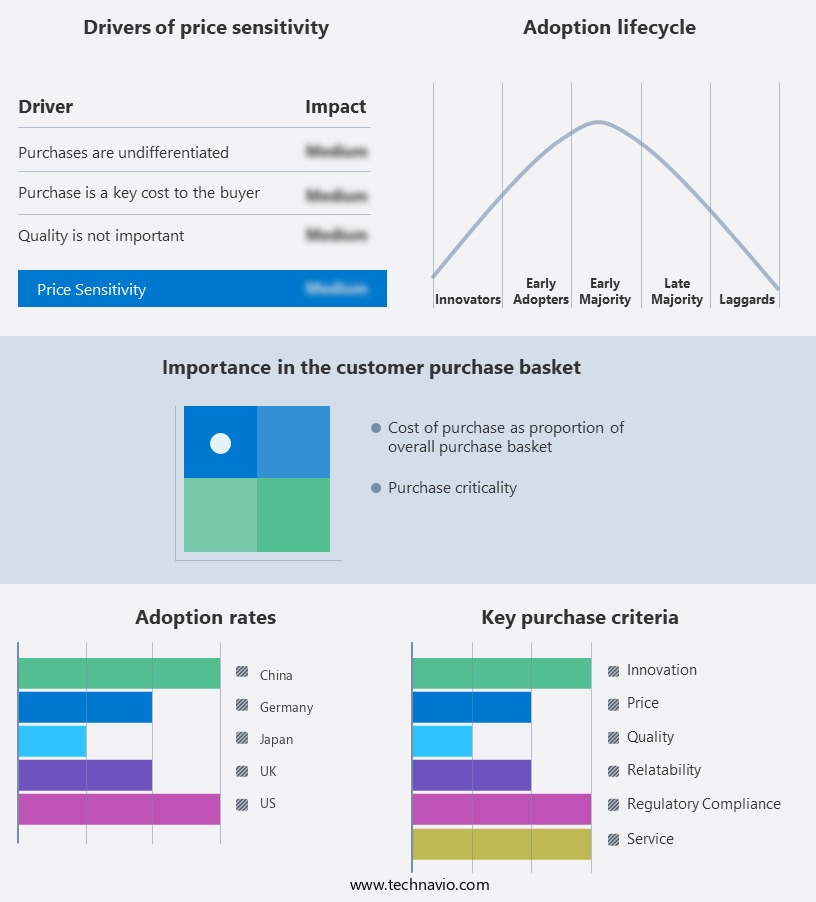
        The interactive flat panels market forecasting report includes the adoption lifecycle of the market, covering from the innovator’s stage to the laggard’s stage. It focuses on adoption rates in different regions based on penetration. Furthermore, the interactive flat panels market report also includes key purchase criteria and drivers of price sensitivity to help companies evaluate and develop their market growth analysis strategies.

        Interactive Flat Panels Market Share by Geography

         Customer Landscape

        Key Companies & Market Insights

        Companies are implementing various strategies, such as strategic alliances, interactive flat panels market forecast, partnerships, mergers and acquisitions, geographical expansion, and product/service launches, to enhance their presence In the industry.

        Accuview Inc - The company provides a range of interactive flat panels, including models OFU084F, OFU084FPUA, and OFU084FRUA. These advanced displays enable engaging and interactive learning experiences, enhancing education and collaboration in various settings. Interactive flat panels offer versatility, allowing users to write, draw, and manipulate digital content with ease, fostering creativity and improved communication. The technology supports multiple users, making it an ideal solution for group activities and collaborative projects. With high resolution displays and integrated multimedia capabilities, these panels deliver crisp visuals and rich multimedia content, ensuring an immersive and interactive experience.

        The industry research and growth report includes detailed analyses of the competitive landscape of the market and information about key companies, including:

        • Accuview Inc
        • Baanto International Ltd.
        • BenQ Corp.
        • Boxlight Corp
        • Crystal Display Systems Ltd.
        • Elo Touch Solutions Inc.
        • Hangzhou Hikvision Digital Technology Co. Ltd.
        • Hitachi Ltd.
        • Horizon Display Inc.
        • Koninklijke Philips N.V.
        • LG Electronics Inc.
        • NEC Corp.
        • Panasonic Holdings Corp.
        • Planar Systems Inc.
        • Promethean World Ltd.
        • Samsung Electronics Co. Ltd.
        • Sharp Corp.
        • SMART Technologies ULC
        • ViewSonic Corp.
        • Wishtel Private Ltd.

        Qualitative and quantitative analysis of companies has been conducted to help clients understand the wider business environment as well as the strengths and weaknesses of key industry players. Data is qualitatively analyzed to categorize companies as pure play, category-focused, industry-focused, and diversified; it is quantitatively analyzed to categorize companies as dominant, leading, strong, tentative, and weak.

        Research Analyst Overview

        The interactive flat panel market has experienced significant growth in recent years, driven by the increasing demand for advanced technology solutions in various industries and sectors. These panels offer unique features such as high definition displays, interactive components, and dynamic data visualization, making them an attractive option for businesses and educational institutions. One of the key factors fueling the market's expansion is the affordability of these panels. With economies of scale and technological advancements, the cost of producing and purchasing interactive flat panels has decreased, making them accessible to a wider audience. This affordability has led to their adoption in various industries, including corporate sectors, education, and hospitality.

        Interactive flat panels are transforming the way businesses operate, particularly in collaborative decision-making processes. They provide an interactive and engaging platform for teams to brainstorm, share ideas, and work together in real-time. In the corporate industry, these panels are being used for presentations, virtual meetings, and training sessions, enhancing productivity and efficiency. The education sector has also seen a surge In the adoption of interactive flat panels. Digital classrooms have become the norm, and these panels are being used to create interactive learning experiences for students. Interactive whiteboards and touchscreen tables are popular choices for schools and universities, providing a more engaging and effective learning process.

        The entertainment industry is another sector that is benefiting from the use of interactive flat panels. They are being used for digital signage, gaming, and even in medical imaging applications, such as CT scans and MRIs. The ability to display high definition images and videos in real-time makes these panels an ideal solution for entertainment applications. Despite the numerous benefits of interactive flat panels, there are challenges that the market faces. Production delays, supply chain disruptions, and increased costs are some of the issues that manufacturers and buyers must contend with. However, the market is expected to continue growing, driven by technological advancements and the increasing demand for smart technologies.

        In conclusion, the interactive flat panel market is experiencing significant growth, driven by the affordability of these panels and their adoption in various industries and sectors. They offer unique features such as high definition displays, interactive components, and dynamic data visualization, making them an attractive option for businesses and educational institutions. Despite the challenges, the market is expected to continue growing, driven by technological advancements and the increasing demand for smart technologies.

        Market Scope

        Report Coverage

        Details

        Page number

        172

        Base year

        2023

        Historic period

        2018-2022

        Forecast period

        2024-2028

        Growth momentum & CAGR

        Accelerate at a CAGR of 10.93%

        Market growth 2024-2028

        USD 10156.5 million

        Market structure

        Fragmented

        YoY growth 2023-2024(%)

        9.57

        Key countries

        US, UK, China, Germany, and Japan

        Competitive landscape

        Leading Companies, Market Positioning of Companies, Competitive Strategies, and Industry Risks

        Request Free Sample

        What are the Key Data Covered in this Interactive Flat Panels Market Research and Growth Report?

        • CAGR of the Interactive Flat Panels industry during the forecast period
        • Detailed information on factors that will drive the growth and forecasting between 2024 and 2028
        • Precise estimation of the size of the market and its contribution of the industry in focus to the parent market
        • Accurate predictions about upcoming growth and trends and changes in consumer behaviour
        • Growth of the market across North America, APAC, Europe, Middle East and Africa, and South America
        • Thorough analysis of the market’s competitive landscape and detailed information about companies
        • Comprehensive analysis of factors that will challenge the interactive flat panels market growth of industry companies

        We can help! Our analysts can customize this interactive flat panels market research report to meet your requirements.

        Get in touch


        1 Executive Summary

        • 1.1 Market overview
          • Executive Summary - Chart on Market Overview
          • Executive Summary - Data Table on Market Overview
          • Executive Summary - Chart on Global Market Characteristics
          • Executive Summary - Chart on Market by Geography
          • Executive Summary - Chart on Market Segmentation by Application
          • Executive Summary - Chart on Market Segmentation by Display Type
          • Executive Summary - Chart on Incremental Growth
          • Executive Summary - Data Table on Incremental Growth
          • Executive Summary - Chart on Company Market Positioning

        2 Market Landscape

        • 2.1 Market ecosystem
          • Parent Market
          • Data Table on - Parent Market
        • 2.2 Market characteristics
          • Market characteristics analysis
        • 2.3 Value chain analysis
          • Value Chain Analysis

        3 Market Sizing

        • 3.1 Market definition
          • Offerings of companies included in the market definition
        • 3.2 Market segment analysis
          • Market segments
        • 3.3 Market size 2023
          • 3.4 Market outlook: Forecast for 2023-2028
            • Chart on Global - Market size and forecast 2023-2028 ($ million)
            • Data Table on Global - Market size and forecast 2023-2028 ($ million)
            • Chart on Global Market: Year-over-year growth 2023-2028 (%)
            • Data Table on Global Market: Year-over-year growth 2023-2028 (%)

          4 Historic Market Size

          • 4.1 Global Interactive Flat Panels Market 2018 - 2022
            • Historic Market Size - Data Table on Global Interactive Flat Panels Market 2018 - 2022 ($ million)
          • 4.2 Application segment analysis 2018 - 2022
            • Historic Market Size - Application Segment 2018 - 2022 ($ million)
          • 4.3 Display Type segment analysis 2018 - 2022
            • Historic Market Size - Display Type Segment 2018 - 2022 ($ million)
          • 4.4 Geography segment analysis 2018 - 2022
            • Historic Market Size - Geography Segment 2018 - 2022 ($ million)
          • 4.5 Country segment analysis 2018 - 2022
            • Historic Market Size - Country Segment 2018 - 2022 ($ million)

          5 Five Forces Analysis

          • 5.1 Five forces summary
            • Five forces analysis - Comparison between 2023 and 2028
          • 5.2 Bargaining power of buyers
            • Bargaining power of buyers - Impact of key factors 2023 and 2028
          • 5.3 Bargaining power of suppliers
            • Bargaining power of suppliers - Impact of key factors in 2023 and 2028
          • 5.4 Threat of new entrants
            • Threat of new entrants - Impact of key factors in 2023 and 2028
          • 5.5 Threat of substitutes
            • Threat of substitutes - Impact of key factors in 2023 and 2028
          • 5.6 Threat of rivalry
            • Threat of rivalry - Impact of key factors in 2023 and 2028
          • 5.7 Market condition
            • Chart on Market condition - Five forces 2023 and 2028

          6 Market Segmentation by Application

          • 6.1 Market segments
            • Chart on Application - Market share 2023-2028 (%)
            • Data Table on Application - Market share 2023-2028 (%)
          • 6.2 Comparison by Application
            • Chart on Comparison by Application
            • Data Table on Comparison by Application
          • 6.3 Education sector - Market size and forecast 2023-2028
            • Chart on Education sector - Market size and forecast 2023-2028 ($ million)
            • Data Table on Education sector - Market size and forecast 2023-2028 ($ million)
            • Chart on Education sector - Year-over-year growth 2023-2028 (%)
            • Data Table on Education sector - Year-over-year growth 2023-2028 (%)
          • 6.4 Corporate sector - Market size and forecast 2023-2028
            • Chart on Corporate sector - Market size and forecast 2023-2028 ($ million)
            • Data Table on Corporate sector - Market size and forecast 2023-2028 ($ million)
            • Chart on Corporate sector - Year-over-year growth 2023-2028 (%)
            • Data Table on Corporate sector - Year-over-year growth 2023-2028 (%)
          • 6.5 Market opportunity by Application
            • Market opportunity by Application ($ million)
            • Data Table on Market opportunity by Application ($ million)

          7 Market Segmentation by Display Type

          • 7.1 Market segments
            • Chart on Display Type - Market share 2023-2028 (%)
            • Data Table on Display Type - Market share 2023-2028 (%)
          • 7.2 Comparison by Display Type
            • Chart on Comparison by Display Type
            • Data Table on Comparison by Display Type
          • 7.3 Plasma and LCD flat panels - Market size and forecast 2023-2028
            • Chart on Plasma and LCD flat panels - Market size and forecast 2023-2028 ($ million)
            • Data Table on Plasma and LCD flat panels - Market size and forecast 2023-2028 ($ million)
            • Chart on Plasma and LCD flat panels - Year-over-year growth 2023-2028 (%)
            • Data Table on Plasma and LCD flat panels - Year-over-year growth 2023-2028 (%)
          • 7.4 Interactive UHD/4K flat panels - Market size and forecast 2023-2028
            • Chart on Interactive UHD/4K flat panels - Market size and forecast 2023-2028 ($ million)
            • Data Table on Interactive UHD/4K flat panels - Market size and forecast 2023-2028 ($ million)
            • Chart on Interactive UHD/4K flat panels - Year-over-year growth 2023-2028 (%)
            • Data Table on Interactive UHD/4K flat panels - Year-over-year growth 2023-2028 (%)
          • 7.5 HD flat panels - Market size and forecast 2023-2028
            • Chart on HD flat panels - Market size and forecast 2023-2028 ($ million)
            • Data Table on HD flat panels - Market size and forecast 2023-2028 ($ million)
            • Chart on HD flat panels - Year-over-year growth 2023-2028 (%)
            • Data Table on HD flat panels - Year-over-year growth 2023-2028 (%)
          • 7.6 Market opportunity by Display Type
            • Market opportunity by Display Type ($ million)
            • Data Table on Market opportunity by Display Type ($ million)

          8 Customer Landscape

          • 8.1 Customer landscape overview
            • Analysis of price sensitivity, lifecycle, customer purchase basket, adoption rates, and purchase criteria

          9 Geographic Landscape

          • 9.1 Geographic segmentation
            • Chart on Market share by geography 2023-2028 (%)
            • Data Table on Market share by geography 2023-2028 (%)
          • 9.2 Geographic comparison
            • Chart on Geographic comparison
            • Data Table on Geographic comparison
          • 9.3 North America - Market size and forecast 2023-2028
            • Chart on North America - Market size and forecast 2023-2028 ($ million)
            • Data Table on North America - Market size and forecast 2023-2028 ($ million)
            • Chart on North America - Year-over-year growth 2023-2028 (%)
            • Data Table on North America - Year-over-year growth 2023-2028 (%)
          • 9.4 APAC - Market size and forecast 2023-2028
            • Chart on APAC - Market size and forecast 2023-2028 ($ million)
            • Data Table on APAC - Market size and forecast 2023-2028 ($ million)
            • Chart on APAC - Year-over-year growth 2023-2028 (%)
            • Data Table on APAC - Year-over-year growth 2023-2028 (%)
          • 9.5 Europe - Market size and forecast 2023-2028
            • Chart on Europe - Market size and forecast 2023-2028 ($ million)
            • Data Table on Europe - Market size and forecast 2023-2028 ($ million)
            • Chart on Europe - Year-over-year growth 2023-2028 (%)
            • Data Table on Europe - Year-over-year growth 2023-2028 (%)
          • 9.6 Middle East and Africa - Market size and forecast 2023-2028
            • Chart on Middle East and Africa - Market size and forecast 2023-2028 ($ million)
            • Data Table on Middle East and Africa - Market size and forecast 2023-2028 ($ million)
            • Chart on Middle East and Africa - Year-over-year growth 2023-2028 (%)
            • Data Table on Middle East and Africa - Year-over-year growth 2023-2028 (%)
          • 9.7 South America - Market size and forecast 2023-2028
            • Chart on South America - Market size and forecast 2023-2028 ($ million)
            • Data Table on South America - Market size and forecast 2023-2028 ($ million)
            • Chart on South America - Year-over-year growth 2023-2028 (%)
            • Data Table on South America - Year-over-year growth 2023-2028 (%)
          • 9.8 US - Market size and forecast 2023-2028
            • Chart on US - Market size and forecast 2023-2028 ($ million)
            • Data Table on US - Market size and forecast 2023-2028 ($ million)
            • Chart on US - Year-over-year growth 2023-2028 (%)
            • Data Table on US - Year-over-year growth 2023-2028 (%)
          • 9.9 China - Market size and forecast 2023-2028
            • Chart on China - Market size and forecast 2023-2028 ($ million)
            • Data Table on China - Market size and forecast 2023-2028 ($ million)
            • Chart on China - Year-over-year growth 2023-2028 (%)
            • Data Table on China - Year-over-year growth 2023-2028 (%)
          • 9.10 Germany - Market size and forecast 2023-2028
            • Chart on Germany - Market size and forecast 2023-2028 ($ million)
            • Data Table on Germany - Market size and forecast 2023-2028 ($ million)
            • Chart on Germany - Year-over-year growth 2023-2028 (%)
            • Data Table on Germany - Year-over-year growth 2023-2028 (%)
          • 9.11 Japan - Market size and forecast 2023-2028
            • Chart on Japan - Market size and forecast 2023-2028 ($ million)
            • Data Table on Japan - Market size and forecast 2023-2028 ($ million)
            • Chart on Japan - Year-over-year growth 2023-2028 (%)
            • Data Table on Japan - Year-over-year growth 2023-2028 (%)
          • 9.12 UK - Market size and forecast 2023-2028
            • Chart on UK - Market size and forecast 2023-2028 ($ million)
            • Data Table on UK - Market size and forecast 2023-2028 ($ million)
            • Chart on UK - Year-over-year growth 2023-2028 (%)
            • Data Table on UK - Year-over-year growth 2023-2028 (%)
          • 9.13 Market opportunity by geography
            • Market opportunity by geography ($ million)
            • Data Tables on Market opportunity by geography ($ million)

          10 Drivers, Challenges, and Opportunity/Restraints

          • 10.1 Market drivers
            • 10.2 Market challenges
              • 10.3 Impact of drivers and challenges
                • Impact of drivers and challenges in 2023 and 2028
              • 10.4 Market opportunities/restraints

                11 Competitive Landscape

                • 11.1 Overview
                  • 11.2 Competitive Landscape
                    • Overview on criticality of inputs and factors of differentiation
                  • 11.3 Landscape disruption
                    • Overview on factors of disruption
                  • 11.4 Industry risks
                    • Impact of key risks on business

                  12 Competitive Analysis

                  • 12.1 Companies profiled
                    • Companies covered
                  • 12.2 Market positioning of companies
                    • Matrix on companies position and classification
                  • 12.3 Accuview Inc
                    • Accuview Inc - Overview
                    • Accuview Inc - Product / Service
                    • Accuview Inc - Key offerings
                  • 12.4 BenQ Corp.
                    • BenQ Corp. - Overview
                    • BenQ Corp. - Product / Service
                    • BenQ Corp. - Key offerings
                  • 12.5 Boxlight Corp
                    • Boxlight Corp - Overview
                    • Boxlight Corp - Product / Service
                    • Boxlight Corp - Key news
                    • Boxlight Corp - Key offerings
                  • 12.6 Elo Touch Solutions Inc.
                    • Elo Touch Solutions Inc. - Overview
                    • Elo Touch Solutions Inc. - Product / Service
                    • Elo Touch Solutions Inc. - Key offerings
                  • 12.7 Hangzhou Hikvision Digital Technology Co. Ltd.
                    • Hangzhou Hikvision Digital Technology Co. Ltd. - Overview
                    • Hangzhou Hikvision Digital Technology Co. Ltd. - Product / Service
                    • Hangzhou Hikvision Digital Technology Co. Ltd. - Key news
                    • Hangzhou Hikvision Digital Technology Co. Ltd. - Key offerings
                  • 12.8 Hitachi Ltd.
                    • Hitachi Ltd. - Overview
                    • Hitachi Ltd. - Business segments
                    • Hitachi Ltd. - Key news
                    • Hitachi Ltd. - Key offerings
                    • Hitachi Ltd. - Segment focus
                  • 12.9 Koninklijke Philips N.V.
                    • Koninklijke Philips N.V. - Overview
                    • Koninklijke Philips N.V. - Business segments
                    • Koninklijke Philips N.V. - Key news
                    • Koninklijke Philips N.V. - Key offerings
                    • Koninklijke Philips N.V. - Segment focus
                  • 12.10 LG Electronics Inc.
                    • LG Electronics Inc. - Overview
                    • LG Electronics Inc. - Product / Service
                    • LG Electronics Inc. - Key news
                    • LG Electronics Inc. - Key offerings
                  • 12.11 NEC Corp.
                    • NEC Corp. - Overview
                    • NEC Corp. - Business segments
                    • NEC Corp. - Key news
                    • NEC Corp. - Key offerings
                    • NEC Corp. - Segment focus
                  • 12.12 Panasonic Holdings Corp.
                    • Panasonic Holdings Corp. - Overview
                    • Panasonic Holdings Corp. - Product / Service
                    • Panasonic Holdings Corp. - Key news
                    • Panasonic Holdings Corp. - Key offerings
                  • 12.13 Planar Systems Inc.
                    • Planar Systems Inc. - Overview
                    • Planar Systems Inc. - Product / Service
                    • Planar Systems Inc. - Key offerings
                  • 12.14 Promethean World Ltd.
                    • Promethean World Ltd. - Overview
                    • Promethean World Ltd. - Product / Service
                    • Promethean World Ltd. - Key offerings
                  • 12.15 Samsung Electronics Co. Ltd.
                    • Samsung Electronics Co. Ltd. - Overview
                    • Samsung Electronics Co. Ltd. - Business segments
                    • Samsung Electronics Co. Ltd. - Key news
                    • Samsung Electronics Co. Ltd. - Key offerings
                    • Samsung Electronics Co. Ltd. - Segment focus
                  • 12.16 Sharp Corp.
                    • Sharp Corp. - Overview
                    • Sharp Corp. - Business segments
                    • Sharp Corp. - Key news
                    • Sharp Corp. - Key offerings
                    • Sharp Corp. - Segment focus
                  • 12.17 ViewSonic Corp.
                    • ViewSonic Corp. - Overview
                    • ViewSonic Corp. - Product / Service
                    • ViewSonic Corp. - Key offerings

                  13 Appendix

                  • 13.1 Scope of the report
                    • 13.2 Inclusions and exclusions checklist
                      • Inclusions checklist
                      • Exclusions checklist
                    • 13.3 Currency conversion rates for US$
                      • Currency conversion rates for US$
                    • 13.4 Research methodology
                      • Research methodology
                    • 13.5 Data procurement
                      • Information sources
                    • 13.6 Data validation
                      • Data validation
                    • 13.7 Validation techniques employed for market sizing
                      • Validation techniques employed for market sizing
                    • 13.8 Data synthesis
                      • Data synthesis
                    • 13.9 360 degree market analysis
                      • 360 degree market analysis
                    • 13.10 List of abbreviations
                      • List of abbreviations

                    Research Methodology

                    Technavio presents a detailed picture of the market by way of study, synthesis, and summation of data from multiple sources. The analysts have presented the various facets of the market with a particular focus on identifying the key industry influencers. The data thus presented is comprehensive, reliable, and the result of extensive research, both primary and secondary.

                    INFORMATION SOURCES

                    Primary sources

                    • Manufacturers and suppliers
                    • Channel partners
                    • Industry experts
                    • Strategic decision makers

                    Secondary sources

                    • Industry journals and periodicals
                    • Government data
                    • Financial reports of key industry players
                    • Historical data
                    • Press releases

                    DATA ANALYSIS

                    Data Synthesis

                    • Collation of data
                    • Estimation of key figures
                    • Analysis of derived insights

                    Data Validation

                    • Triangulation with data models
                    • Reference against proprietary databases
                    • Corroboration with industry experts

                    REPORT WRITING

                    Qualitative

                    • Market drivers
                    • Market challenges
                    • Market trends
                    • Five forces analysis

                    Quantitative

                    • Market size and forecast
                    • Market segmentation
                    • Geographical insights
                    • Competitive landscape

                    Interested in this report?

                    Get your sample now to see our research methodology and insights!

                    Download Now

                    Frequently Asked Questions

                    Interactive Flat Panels market growth will increase by $ 10156.5 mn during 2024-2028 .

                    The Interactive Flat Panels market is expected to grow at a CAGR of 10.93% during 2024-2028 .

                    Interactive Flat Panels market is segmented by Application( Education sector, Corporate sector, Others) Display Type( Plasma and LCD flat panels, Interactive UHD/4K flat panels, HD flat panels, MEA, South America)

                    Accuview Inc, Baanto International Ltd., BenQ Corp., Boxlight Corp, Crystal Display Systems Ltd., Elo Touch Solutions Inc., Hangzhou Hikvision Digital Technology Co. Ltd., Hitachi Ltd., Horizon Display Inc., Koninklijke Philips N.V., LG Electronics Inc., NEC Corp., Panasonic Holdings Corp., Planar Systems Inc., Promethean World Ltd., Samsung Electronics Co. Ltd., Sharp Corp., SMART Technologies ULC, ViewSonic Corp., Wishtel Private Ltd. are a few of the key vendors in the Interactive Flat Panels market.

                    APAC will register the highest growth rate of 41% among the other regions. Therefore, the Interactive Flat Panels market in APAC is expected to garner significant business opportunities for the vendors during the forecast period.

                    US, UK, China, Germany, Japan

                    • Growth of e-learninge-learning can be simply defined as learning by utilizing electronic media and technologies to access educational curricula outside of a traditional classroom. It has gained popularity as an apt and inexpensive alternative to classroom training. The benefits offered by e-learning are listed below:Reduced operational costs: e-learning content can be accessed by multiple students in multiple locations at any time is the driving factor this market.
                    • and it eliminates the need for a classroom instructor or infrastructure.Consistent quality: e-learning delivers a consistent quality of the learning content provided.Better retention: e-learning provides better opportunities for learners by creating an interaction that engages their attention for a more effective and better learning experience.Cross-platform support: e-learning content is accessible by learners on any platform is the driving factor this market.
                    • such as Windows or Mac.The growth of e-learning is highly dependent on two major factors:E-learning delivery model:Content for e-learning can be generated through various sources such as libraries is the driving factor this market.
                    • journals is the driving factor this market.
                    • publishing houses is the driving factor this market.
                    • content developers is the driving factor this market.
                    • and open-source models. The content is developed according to the requirements of e-learning consumers. The next step after content generation involves the development of software platforms and tools to manage the content. The published content is then distributed to end-users through virtual classrooms is the driving factor this market.
                    • computers is the driving factor this market.
                    • tablets is the driving factor this market.
                    • and smartphones.ContentContent development companies in the education sector find huge opportunities in the e-learning market is the driving factor this market.
                    • especially in the low-cost regions is the driving factor this market.
                    • owing to the increase in demand from a greater number of schools and universities that are employing the services of content developers. They offer standard content or curriculums is the driving factor this market.
                    • as well as satisfy customization demands from customers. Different formats for e-learning content include text is the driving factor this market.
                    • video is the driving factor this market.
                    • animation is the driving factor this market.
                    • audio is the driving factor this market.
                    • and simulation content. Institutions present e-learning content to students using a variety of formats is the driving factor this market.
                    • including online documents is the driving factor this market.
                    • multimedia presentations is the driving factor this market.
                    • supplementary printed documents is the driving factor this market.
                    • video is the driving factor this market.
                    • audio is the driving factor this market.
                    • simulations is the driving factor this market.
                    • animations is the driving factor this market.
                    • and Internet-enabled tutor-led training.Content is no longer restricted to the standard textbook. Interactive flat panels offer effective content management features. The development of virtual learning environments has resulted in the creation of relevant and compelling content that is both interactive and virtual. Universities such as Brigham Young and Pearson have created virtual labs is the driving factor this market.
                    • and the demand for interactive flat panels is expected to rise further during the forecast period is the driving factor this market.
                    • with many more universities expected to follow their adoption. Moreover is the driving factor this market.
                    • the growth and implementation of active e-learning in higher education institutions are ensured through various software and devices. Therefore is the driving factor this market.
                    • vendors are launching such interactive flat panels which are compatible with software application. For instance is the driving factor this market.
                    • in September 2023 is the driving factor this market.
                    • BenQ announced the launch of the first Enterprise Devices Licensing Agreement (EDLA)-certified interactive displays for education with Google Mobile Services.  As more institutions adopt active learning strategies to engage students is the driving factor this market.
                    • the global interactive flat panels market will be propelled toward growth during the forecast period. is the driving factor this market.

                    The Interactive Flat Panels market vendors should focus on grabbing business opportunities from the Education sector segment as it accounted for the largest market share in the base year.