Extremity Products Market Size 2026-2030
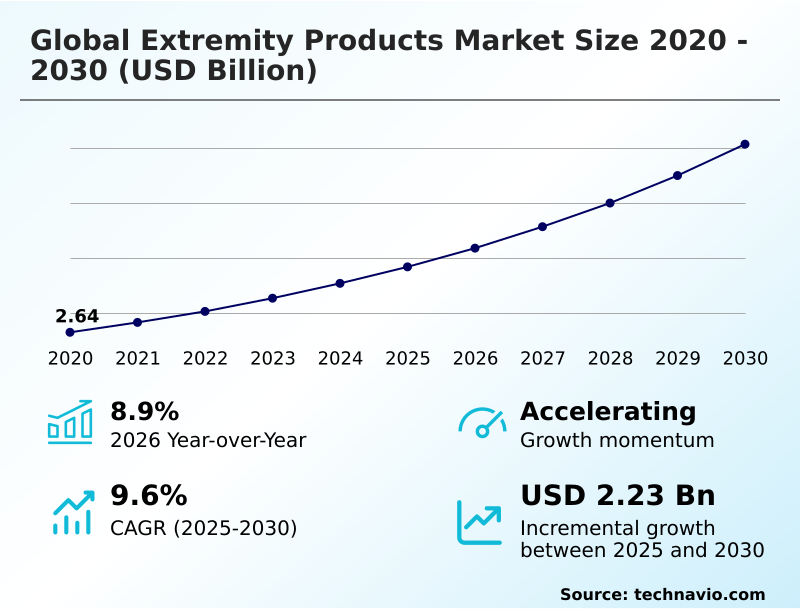
The extremity products market size is valued to increase by USD 2.23 billion, at a CAGR of 9.6% from 2025 to 2030. Rising prevalence of orthopedic conditions will drive the extremity products market.
Major Market Trends & Insights
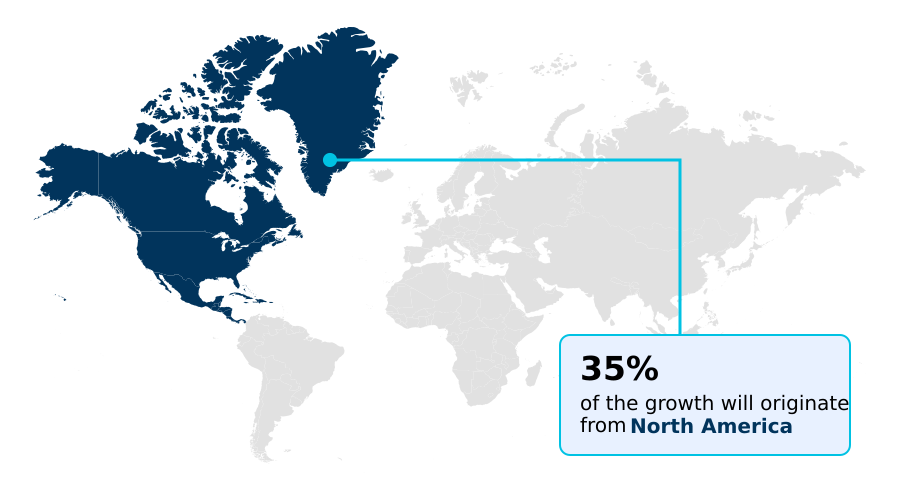
- North America dominated the market and accounted for a 35.4% growth during the forecast period.
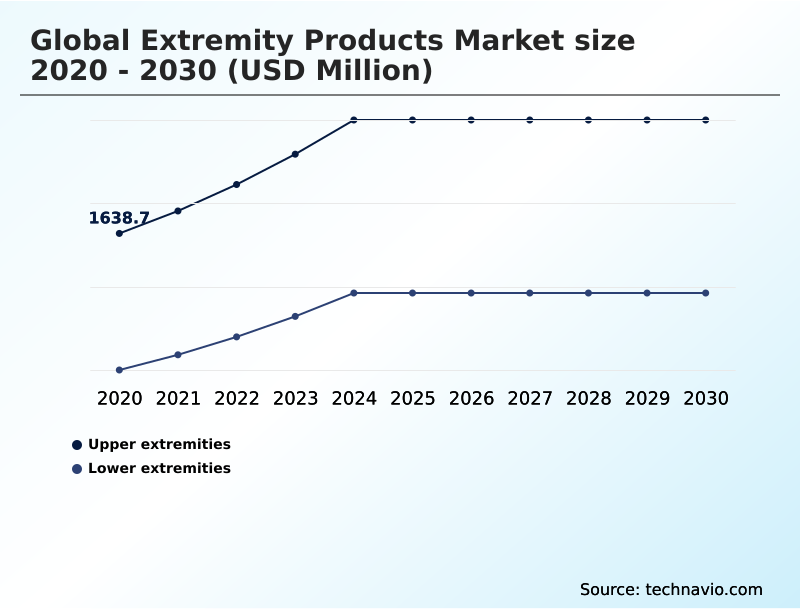
- By Type - Upper extremities segment was valued at USD 2.16 billion in 2024
- By End-user - Hospitals segment accounted for the largest market revenue share in 2024
Market Size & Forecast
- Market Opportunities: USD 3.42 billion
- Market Future Opportunities: USD 2.23 billion
- CAGR from 2025 to 2030 : 9.6%
Market Summary
- The extremity products market is defined by continuous innovation in medical devices designed for anatomic reconstruction of upper and lower limbs. Demand is driven by a rising prevalence of orthopedic conditions, including degenerative joint diseases like osteoarthritis, and an increase in trauma fracture repair cases from sports injuries and accidents.
- The growing geriatric population, which is more susceptible to fractures, further fuels the need for advanced fixation systems like locking plate systems and cementless fixation methods. Key trends shaping the industry include the increasing adoption of advanced surgical technologies such as minimally invasive surgery, computer-assisted surgery, and robotic-assisted surgery, which improve precision and patient outcomes.
- The development of patient-specific implants and 3d-printed implants offers customized solutions, enhancing the efficacy of joint reconstruction procedures like reverse shoulder arthroplasty and total ankle replacement.
- For instance, a hospital system implementing digital preoperative planning for its orthopedic trauma care can optimize its inventory of surgical instruments and orthopedic implants, reducing waste and ensuring the availability of critical hardware for emergency procedures.
- This focus on technological advancement, combined with a greater patient awareness and investment in specialized orthopedic biomaterials, sustains market momentum despite challenges like high procedural costs and stringent regulatory hurdles.
What will be the Size of the Extremity Products Market during the forecast period?
Get Key Insights on Market Forecast (PDF) Get Free Sample
How is the Extremity Products Market Segmented?
The extremity products industry research report provides comprehensive data (region-wise segment analysis), with forecasts and estimates in "USD million" for the period 2026-2030, as well as historical data from 2020-2024 for the following segments.
- Type
- Upper extremities
- Lower extremities
- End-user
- Hospitals
- Clinics
- ASCs
- Application
- Trauma fracture repair
- Joint reconstruction
- Others
- Geography
- North America
- US
- Canada
- Mexico
- Europe
- Germany
- UK
- France
- Asia
- Rest of World (ROW)
- North America
By Type Insights
The upper extremities segment is estimated to witness significant growth during the forecast period.
The upper extremities segment is driven by an increasing incidence of degenerative joint diseases and rising demand for procedures like reverse shoulder arthroplasty. Innovations in anatomic reconstruction focus on anatomical designs that replicate natural arm movement, restoring function for patients.
This segment includes complex trauma fixation products like locking plate systems and intramedullary nails. The development of specialized surgical instruments for small joint arthroplasty enables more precise interventions, improving clinical outcomes.
Digital preoperative planning, now a vital component, allows for the creation of patient-specific implants and has been shown to improve surgical accuracy by over 15%.
The integration of advanced surgical technologies and materials like high-strength titanium alloys and porous metals is standard, ensuring the longevity of orthopedic implants and reducing wear-related complications from prosthetic joints, which is crucial for modern orthopedic care.
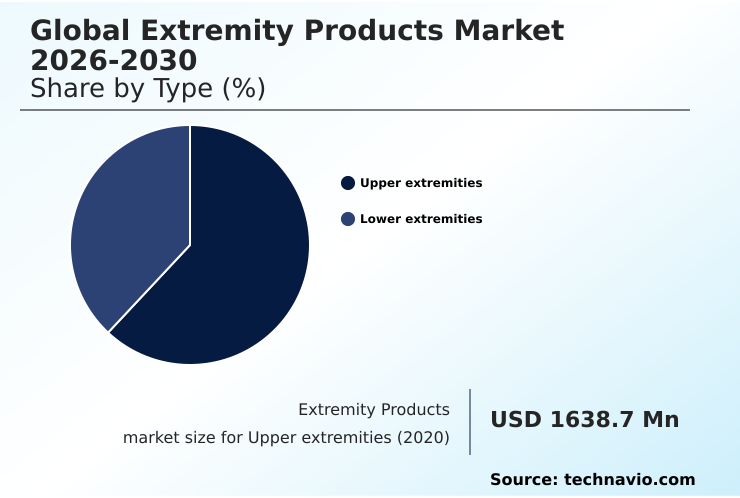
The Upper extremities segment was valued at USD 2.16 billion in 2024 and showed a gradual increase during the forecast period.
Regional Analysis
North America is estimated to contribute 35.4% to the growth of the global market during the forecast period.Technavio’s analysts have elaborately explained the regional trends and drivers that shape the market during the forecast period.
See How Extremity Products Market Demand is Rising in North America Get Free Sample
The geographic landscape of the global extremity products market is characterized by mature, high-value markets and rapidly emerging regions.
North America currently leads, contributing 35.4% of the market’s incremental growth, driven by high healthcare spending, a robust infrastructure for orthopedic trauma care, and early adoption of advanced surgical technologies.
Europe follows, with a strong emphasis on clinical evidence and geriatric orthopedic care.
However, Asia is poised to be the fastest-growing region, with a projected CAGR of 10.2%, fueled by modernizing healthcare systems, rising disposable incomes, and a significant volume of trauma fracture repair cases.
This region is witnessing a rapid uptake of both premium and cost-effective orthopedic implants, driven by an expanding middle class seeking modern orthopedic care and limb salvage interventions for conditions prevalent in the region.
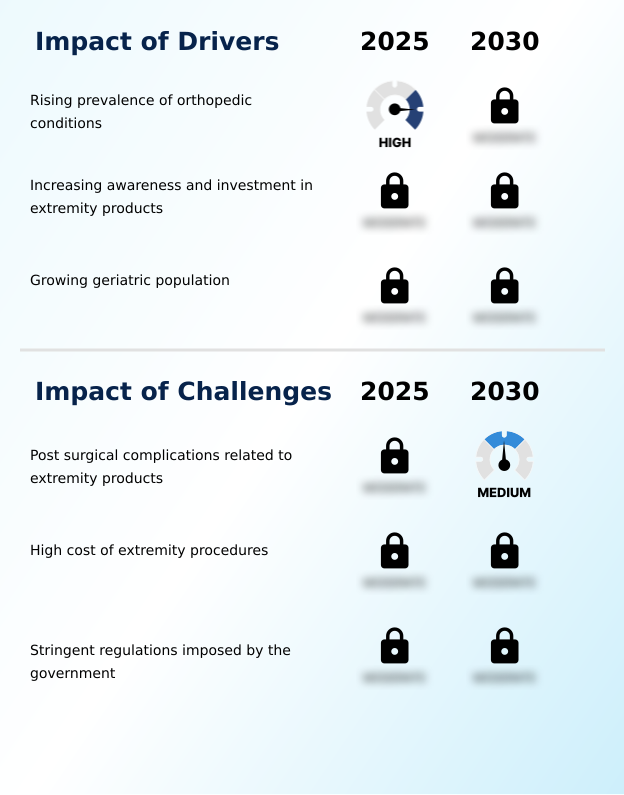
Market Dynamics
Our researchers analyzed the data with 2025 as the base year, along with the key drivers, trends, and challenges. A holistic analysis of drivers will help companies refine their marketing strategies to gain a competitive advantage.
- The strategic direction of the global extremity products market 2026-2030 is increasingly shaped by specialization and technological integration. For instance, the demand for extremity products for trauma fracture is evolving beyond standard plates and screws toward biomaterials for orthopedic trauma devices that enhance healing.
- The challenges in lower extremity implants are being addressed through innovations in small joint arthroplasty and better digital planning for ankle replacement. A significant trend is the adoption of advanced surgical technologies for extremities, where robotic systems in extremity surgery are becoming more prevalent. This shift necessitates enhanced training for minimally invasive techniques to ensure optimal outcomes.
- In terms of product development, the debate between patient-specific implants versus standard implants continues, with customized solutions showing superior results in complex cases. The cost of extremity surgical procedures remains a challenge, but efficiency gains from ambulatory surgery centers are helping to mitigate this. For manufacturers, navigating the complex regulatory pathways for orthopedic implants is critical.
- Decision-makers must also consider managing post-surgical implant complications and improving the supply chain for orthopedic hardware. The focus on joint reconstruction in upper extremities is driven by growth trends in shoulder arthroplasty, especially in geriatric care and extremity products. The fixation methods for osteoporotic bone are a key area of R&D.
- Furthermore, sports medicine soft tissue repair represents a high-growth segment, with clinical outcomes of bioabsorbable implants demonstrating efficacy. Facilities that integrate these advanced approaches report that patient recovery metrics improve nearly twice as fast as those relying on traditional methods, highlighting a clear operational advantage.
What are the key market drivers leading to the rise in the adoption of Extremity Products Industry?
- The rising prevalence of orthopedic conditions, including degenerative joint diseases and traumatic fractures, is a primary driver fueling demand in the extremity products market.
- Market growth is primarily driven by the rising prevalence of degenerative joint diseases and a growing geriatric population requiring geriatric orthopedic care.
- This demographic shift is fueling demand for procedures like reverse shoulder arthroplasty and total ankle replacement, with elective surgeries in the over-65 age group increasing by 25% in the last five years.
- Increased patient awareness and investment are also significant drivers, accelerating R&D cycles for advanced surgical technologies by up to 40%.
- The expansion of outpatient orthopedic surgery provides more accessible and cost-effective orthopedic trauma care, expanding the market for trauma stabilization systems.
- Innovations in orthopedic implants, including locking plate systems and anatomic reconstruction devices, continue to improve the standard of modern orthopedic care for patients worldwide.
What are the market trends shaping the Extremity Products Industry?
- The growing number of specialized orthopedic conferences serves as a major trend, facilitating the exchange of knowledge and the demonstration of new surgical techniques.
- Key trends reshaping the extremity products market include the increasing adoption of advanced surgical technologies and strategic market consolidation. Innovations in computer-assisted surgery and minimally invasive surgery are improving clinical outcomes, with adoption in ambulatory surgery centers leading to a 15% reduction in average procedure times.
- The rise of patient-specific instruments and 3d-printed implants is enabling a higher degree of personalization in joint reconstruction. Simultaneously, a wave of mergers and acquisitions is allowing larger entities to offer comprehensive foot and ankle portfolios. This consolidation enables streamlined supply chains, with some integrated providers achieving a 10% reduction in procurement costs for orthopedic biomaterials.
- The growing number of orthopedic conferences also accelerates the dissemination of new techniques for anatomic reconstruction and soft tissue repair.
What challenges does the Extremity Products Industry face during its growth?
- The potential for post-surgical complications related to extremity products, such as infection or implant failure, remains a significant challenge affecting industry growth.
- Key challenges constraining the market include the high cost of procedures and stringent regulatory frameworks. The financial burden of advanced fixation systems and prosthetic joints limits adoption in some regions, while post-surgical complications, though rare, can increase total treatment costs by over 400%.
- Navigating increasingly complex regulatory pathways has extended product-to-market timelines for new anatomical implant systems by an average of 18 months, creating a high-risk environment for innovators. Furthermore, the risk of implant loosening or hardware failure, particularly with small bone implants used in small joint arthroplasty, remains a technical hurdle.
- Manufacturers must invest heavily in bioactive coatings and bioabsorbable materials to mitigate these risks and ensure the long-term success of extremity reconstruction.
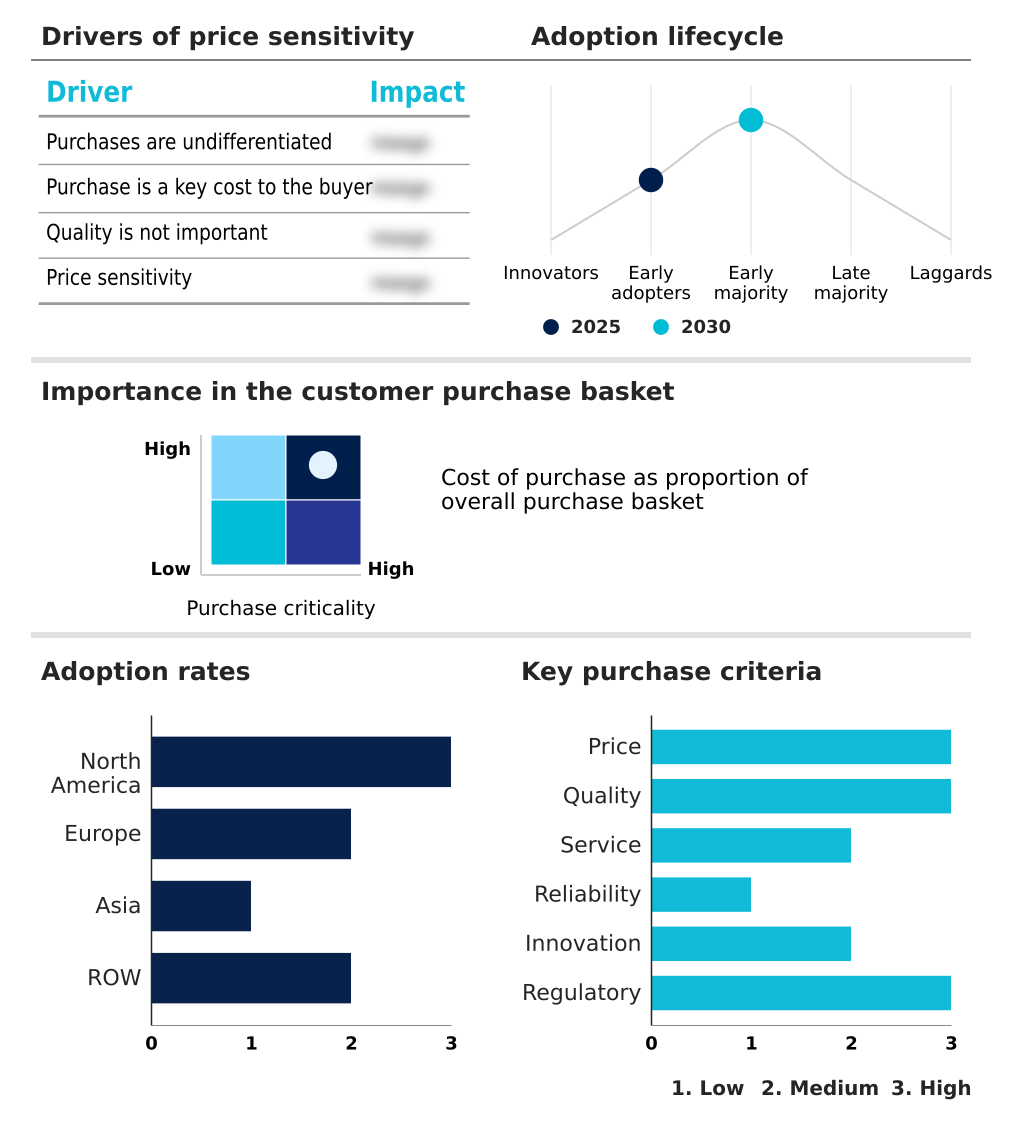
Exclusive Technavio Analysis on Customer Landscape
The extremity products market forecasting report includes the adoption lifecycle of the market, covering from the innovator’s stage to the laggard’s stage. It focuses on adoption rates in different regions based on penetration. Furthermore, the extremity products market report also includes key purchase criteria and drivers of price sensitivity to help companies evaluate and develop their market growth analysis strategies.
Customer Landscape of Extremity Products Industry
Competitive Landscape
Companies are implementing various strategies, such as strategic alliances, extremity products market forecast, partnerships, mergers and acquisitions, geographical expansion, and product/service launches, to enhance their presence in the industry.
3 Point Products Inc. - Designs and manufactures specialized splints, braces, and external fixation frames, focusing on comfort, functional fit, and effective solutions for patient compliance and deformity correction devices.
The industry research and growth report includes detailed analyses of the competitive landscape of the market and information about key companies, including:
- 3 Point Products Inc.
- Acumed LLC
- ALIMCO
- Arthrex Inc.
- Aspire Medical Innovation
- Bone Foam Inc.
- Breg Inc.
- Colfax Corp.
- CONMED Corp.
- Exactech Inc.
- Extremity Medical LLC
- Johnson and Johnson Services
- Skeletal Dynamics LLC
- Smith and Nephew plc
- SpiTrex Orthopedics
- Steeper Inc.
- Stryker Corp.
- TriMed Inc.
- Waldemar Link GmbH and Co. KG
- Zimmer Biomet Holdings Inc.
Qualitative and quantitative analysis of companies has been conducted to help clients understand the wider business environment as well as the strengths and weaknesses of key industry players. Data is qualitatively analyzed to categorize companies as pure play, category-focused, industry-focused, and diversified; it is quantitatively analyzed to categorize companies as dominant, leading, strong, tentative, and weak.
Recent Development and News in Extremity products market
- In September 2024, Zimmer Biomet Holdings Inc. announced a strategic investment in its Identity Shoulder System, responding to the growing demand for personalized and anatomical reconstruction options for patients.
- In November 2024, Colfax Corp. completed its acquisition of DJO Global, a strategic integration of a leading bracing and surgical portfolio into a single diversified medical technology platform.
- In February 2025, Stryker Corp. highlighted that the rising incidence of degenerative joint diseases and sports injuries is a fundamental driver for the growth of its foot and ankle portfolio.
- In April 2025, Arthrex Inc. showcased its latest innovations in minimally invasive extremity surgery and advanced surgical technologies at the American Academy of Orthopaedic Surgeons (AAOS) annual meeting.
Dive into Technavio’s robust research methodology, blending expert interviews, extensive data synthesis, and validated models for unparalleled Extremity Products Market insights. See full methodology.
| Market Scope | |
|---|---|
| Page number | 285 |
| Base year | 2025 |
| Historic period | 2020-2024 |
| Forecast period | 2026-2030 |
| Growth momentum & CAGR | Accelerate at a CAGR of 9.6% |
| Market growth 2026-2030 | USD 2228.5 million |
| Market structure | Fragmented |
| YoY growth 2025-2026(%) | 8.9% |
| Key countries | US, Canada, Mexico, Germany, UK, France, Italy, Spain, The Netherlands, Russia, China, Japan, India, South Korea, Indonesia, Singapore, Thailand, Australia, UAE, Brazil, Saudi Arabia, South Africa and Turkey |
| Competitive landscape | Leading Companies, Market Positioning of Companies, Competitive Strategies, and Industry Risks |
Research Analyst Overview
- The extremity products market is undergoing a significant transformation, driven by a convergence of material science and digital innovation. The evolution from standard orthopedic implants to patient-specific implants and 3d-printed implants is reshaping anatomic reconstruction.
- Procedures such as reverse shoulder arthroplasty and total ankle replacement are becoming more common, utilizing prosthetic joints made from high-strength titanium alloys and other orthopedic biomaterials. The use of locking plate systems, intramedullary nails, and external fixation frames remains fundamental to trauma fixation, especially for small bone implants and foot and ankle implants.
- Minimally invasive surgery, facilitated by advanced surgical instruments and orthopedic power tools, is now standard, with data showing it can reduce patient recovery times by up to 30%. This places a strategic emphasis on boardroom decisions regarding capital investment in computer-assisted surgery platforms.
- Furthermore, the development of bioabsorbable materials and bioactive coatings is addressing challenges in soft tissue repair and joint reconstruction. Technologies like variable angle locking technology and cementless fixation methods using porous metals are improving outcomes in small joint arthroplasty and demonstrating the market's pivot toward advanced surgical technologies.
What are the Key Data Covered in this Extremity Products Market Research and Growth Report?
-
What is the expected growth of the Extremity Products Market between 2026 and 2030?
-
USD 2.23 billion, at a CAGR of 9.6%
-
-
What segmentation does the market report cover?
-
The report is segmented by Type (Upper extremities, and Lower extremities), End-user (Hospitals, Clinics, and ASCs), Application (Trauma fracture repair, Joint reconstruction, and Others) and Geography (North America, Europe, Asia, Rest of World (ROW))
-
-
Which regions are analyzed in the report?
-
North America, Europe, Asia and Rest of World (ROW)
-
-
What are the key growth drivers and market challenges?
-
Rising prevalence of orthopedic conditions, Post surgical complications related to extremity products
-
-
Who are the major players in the Extremity Products Market?
-
3 Point Products Inc., Acumed LLC, ALIMCO, Arthrex Inc., Aspire Medical Innovation, Bone Foam Inc., Breg Inc., Colfax Corp., CONMED Corp., Exactech Inc., Extremity Medical LLC, Johnson and Johnson Services, Skeletal Dynamics LLC, Smith and Nephew plc, SpiTrex Orthopedics, Steeper Inc., Stryker Corp., TriMed Inc., Waldemar Link GmbH and Co. KG and Zimmer Biomet Holdings Inc.
-
Market Research Insights
- The dynamics of the extremity products market are shaped by a move toward value-based outcomes and procedural efficiency. The growth of outpatient orthopedic surgery, particularly in ambulatory centers, has driven demand for streamlined solutions, with some facilities reporting a 20% increase in case volume year-over-year.
- This shift is supported by digital preoperative planning tools, which have been shown to reduce surgical revision rates by up to 15% by enabling precise patient-specific instruments and anatomical implant systems. As geriatric orthopedic care becomes more critical, there is a greater focus on limb salvage interventions and modern orthopedic care that minimizes recovery time.
- The expansion of sports medicine procedures and specialized foot and ankle portfolios also reflects a market adapting to active lifestyle trends and the need for advanced fixation systems.
We can help! Our analysts can customize this extremity products market research report to meet your requirements.
 RIA -
RIA - 
