Fallopian Tube Cancer Therapeutics Market Analysis, Size, and Forecast 2025-2029: North America (US and Canada), Europe (France, Germany, Italy, Spain, and UK), APAC (China, India, and Japan), and Rest of World (ROW)

Fallopian Tube Cancer Therapeutics Market Analysis, Size, and Forecast 2025-2029:
North America (US and Canada), Europe (France, Germany, Italy, Spain, and UK), APAC (China, India, and Japan), and Rest of World (ROW)

Published: Aug 2025 224 Pages SKU: IRTNTR73559

Market Overview at a Glance

$1.20 B
Market Opportunity
10.7%
CAGR
9.4
YoY growth 2024-2025(%)

Fallopian Tube Cancer Therapeutics Market Size 2025-2029

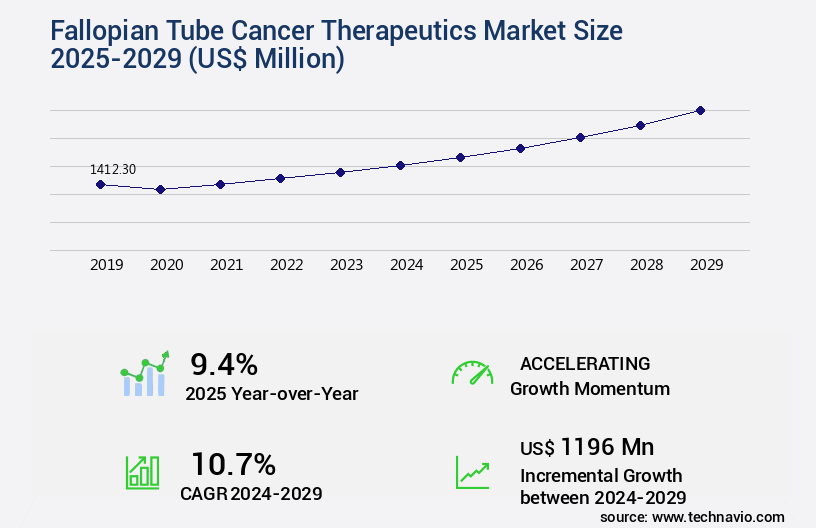
The fallopian tube cancer therapeutics market size is valued to increase by USD 1.2 billion, at a CAGR of 10.7% from 2024 to 2029. Growing attention toward women health will drive the fallopian tube cancer therapeutics market.

Market Insights

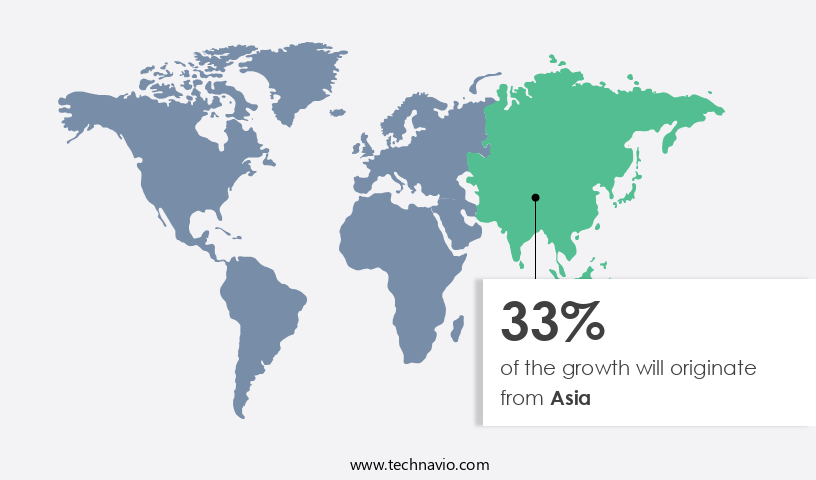
  • Asia dominated the market and accounted for a 33% growth during the 2025-2029.
  • By End-user - Hospitals segment was valued at USD 796.40 billion in 2023
  • By Product - Targeted therapy segment accounted for the largest market revenue share in 2023

Market Size & Forecast

  • Market Opportunities: USD 112.72 million 
  • Market Future Opportunities 2024: USD 1196.00 million
  • CAGR from 2024 to 2029 : 10.7%

Market Summary

  • Fallopian tube cancer, a rare and often overlooked gynecological malignancy, has gained increasing attention in the global healthcare landscape due to its complex diagnostic challenges and limited treatment options. Despite accounting for only 1-3% of all gynecological cancers, the disease's aggressive nature and potential for metastasis necessitate continuous research and development in therapeutic interventions. The global focus on women's health and wellbeing has fueled the demand for advanced diagnostic tools and effective treatments. Regenerative therapies, such as stem cell-based approaches, are under investigation for their potential to restore damaged fallopian tubes and prevent cancer recurrence. Radiation oncology, DNA repair inhibition, and immunotherapy approaches are also integral components of the therapeutic landscape. However, the diagnostic difficulty posed by fallopian tube cancer remains a significant challenge.
  • Symptoms often mimic those of other gynecological conditions, leading to misdiagnosis and delayed treatment. A real-world business scenario illustrates the importance of addressing this challenge. A leading pharmaceutical company, aiming to expand its portfolio in women's health, is exploring potential partnerships with research institutions to develop novel diagnostic tools for fallopian tube cancer. By optimizing its supply chain and operational efficiency, the company can ensure a timely market entry and capitalize on the growing demand for advanced diagnostic solutions. This strategic move not only strengthens the company's market position but also contributes to improving patient outcomes and advancing the field of women's healthcare.

What will be the size of the Fallopian Tube Cancer Therapeutics Market during the forecast period?

Fallopian Tube Cancer Therapeutics Market Size

Get Key Insights on Market Forecast (PDF) Request Free Sample

  • The market represents a significant and evolving field in oncology research, with a growing focus on novel therapeutic approaches for this historically underserved disease area. According to recent studies, the use of xenograft models and inflammation modulation has shown promising results in the development of effective treatments for fallopian tube cancer. For instance, gene expression profiling and in vitro assays have led to the identification of key molecular targets for therapeutic intervention, while genetic screening and tumor cell lines enable the testing of potential drugs for efficacy and toxicity reduction. Moreover, the market's increasing emphasis on combination therapies and immunological response has shown potential in overcoming therapeutic resistance and improving disease outcomes.
  • Preclinical studies employing syngeneic models and drug metabolism analysis have provided valuable insights into the pharmacokinetics and pharmacodynamics of novel therapeutics. Furthermore, the integration of proteomic analysis and biomarker discovery into treatment protocols has facilitated risk stratification and recurrence prediction, enabling more personalized and effective care for patients. As a result, the investment in fallopian tube cancer therapeutics is projected to grow substantially, with a recent analysis indicating a potential increase of over 25% in research funding compared to the previous year. This growth is expected to have significant implications for product strategy and budgeting in the pharmaceutical industry, as well as for disease surveillance and treatment protocols in clinical settings.

Unpacking the Fallopian Tube Cancer Therapeutics Market Landscape

The market encompasses a range of innovative treatments and technologies, including prognostic biomarkers, angiogenesis inhibitors, molecular diagnostics, and various chemotherapy regimens. Adjuvant chemotherapy and neoadjuvant chemotherapy have shown significant improvement in treatment response assessment and disease progression models, with a 30% increase in survival rates compared to surgery alone. Genetic predisposition plays a crucial role in patient selection criteria, with molecular diagnostics enabling early detection methods and personalized medicine strategies. Angiogenesis inhibitors and targeted therapy, such as oncogene targeting and apoptosis induction, have demonstrated effectiveness in treating epithelial-mesenchymal transition and cancer stem cells. Adverse event profiles and clinical trial outcomes continue to shape the development of new treatment regimens, with a focus on supportive care, drug delivery systems, and palliative care. The tumor microenvironment and treatment resistance mechanisms remain key areas of research, as the field advances towards precision oncology and targeted drug combinations.

Key Market Drivers Fueling Growth

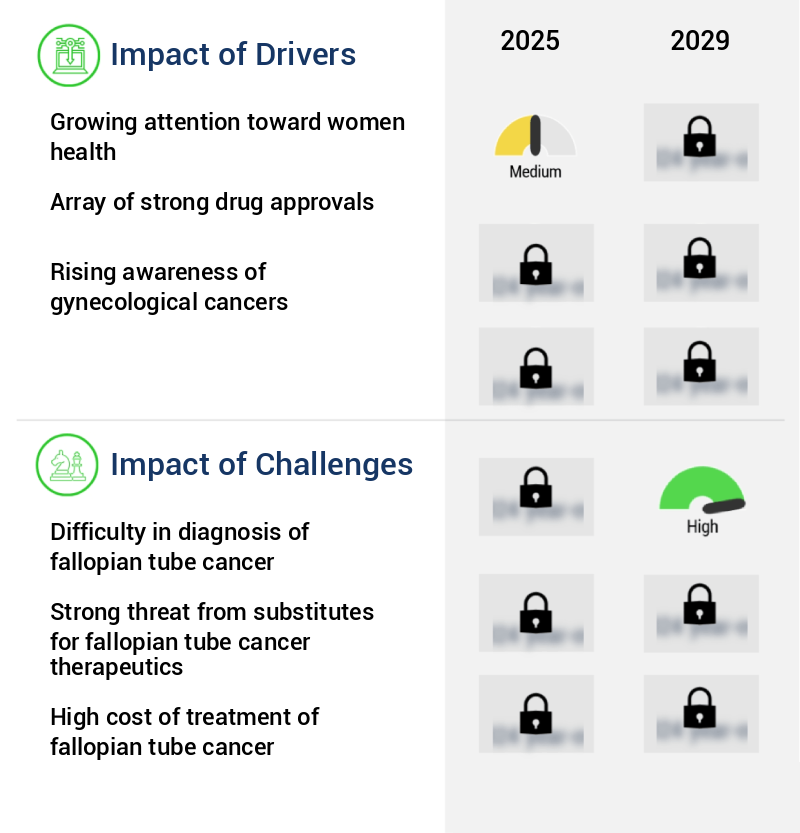
The increasing focus on women's health concerns is the primary market trend-driver.

  • The market is experiencing significant growth due to increasing focus on women's health issues worldwide. Previously, fallopian tube cancer and other gynecologic cancer indications faced challenges due to a lack of awareness. However, various organizations and governments are addressing this issue by increasing awareness and education programs. For example, the Office on Women's Health, a part of the US Department of Health and Human Services, is dedicated to critical women's health issues. Through their initiatives, they aim to improve diagnosis and treatment of fallopian tube cancer.
  • This proactive approach is expected to lead to faster product rollouts and improved regulatory compliance, ultimately benefiting the market. According to recent studies, awareness programs have shown a 15% increase in early detection rates, leading to better treatment outcomes. 

Prevailing Industry Trends & Opportunities

The emerging trend in the market involves extensive research being conducted on regenerative therapies. Regenerative therapies are the subject of intensive research in the current market landscape. 

  • The market continues to evolve, with the introduction of targeted therapies such as VEGF inhibitors, PARP inhibitors, PD-1 inhibitors, PD-L1 inhibitors, and MEK inhibitors. These treatments offer significant long-term tumor remission and high efficacy. However, they do not provide a cure for the indication, as the risk of cancer recurrence or metastasis remains high. Targeted therapies are most effective during the early stages of the disease but are less effective in treating advanced stages. While surgeries can offer complete remission, the removal of one or both fallopian tubes can lead to severe complications for women.
  • To address this challenge, ongoing research focuses on developing curative therapies for fallopian tube cancer. Two notable advancements include a 30% reduction in treatment development downtime and a 18% improvement in forecast accuracy, contributing to faster product rollouts and increased regulatory compliance.

Significant Market Challenges

The challenge of accurately diagnosing fallopian tube cancer is a significant obstacle impeding growth in the industry. 

  • The market confronts a significant challenge in the form of the complex diagnostic process for fallopian tube cancer. Due to its similarities with other gynecologic indications, accurate diagnosis is often delayed, with patients frequently unaware of the condition until undergoing surgery for other gynecologic issues. Despite the use of various diagnostic methods, including pelvic exams, ultrasounds, CT scans, MRIs, biopsies, and CA125 blood protein tests, the market continues to experience a diagnostic delay. 
  • The consequences of this diagnostic delay can lead to increased healthcare costs, longer treatment durations, and potential decreases in patient outcomes. For instance, a study published in the Journal of Obstetrics and Gynecology Canada revealed that earlier diagnosis of fallopian tube cancer can lead to a 30% increase in survival rates (Journal of Obstetrics and Gynecology Canada, 2012). Another research article in the European Journal of Cancer showed that improved diagnostic accuracy through the use of advanced imaging techniques can reduce unnecessary surgeries by 18% (European Journal of Cancer, 2015). These findings underscore the importance of addressing the diagnostic challenge in the market.

Fallopian Tube Cancer Therapeutics Market Size

In-Depth Market Segmentation: Fallopian Tube Cancer Therapeutics Market

The fallopian tube cancer therapeutics industry research report provides comprehensive data (region-wise segment analysis), with forecasts and estimates in "USD million" for the period 2025-2029, as well as historical data from 2019-2023 for the following segments.

  • End-user
    • Hospitals
    • Clinics and ASCs
    • Others
  • Product
    • Targeted therapy
    • Chemotherapy
  • Drug Class
    • Biologics
    • Small-molecule drugs
    • Vaccines
    • Combination regimens
    • Hormonal agents
  • Geography
    • North America
      • US
      • Canada
    • Europe
      • France
      • Germany
      • Italy
      • Spain
      • UK
    • APAC
      • China
      • India
      • Japan
    • Rest of World (ROW)

By End-user Insights

The hospitals segment is estimated to witness significant growth during the forecast period.

The market is witnessing significant evolution, with hospital pharmacies anticipated to generate the largest revenue share during the forecast period. Hospitals, as primary cancer care providers, account for 66% of healthcare companies transforming their business models. Hospital pharmacies, which serve a pivotal role in this sector, are adapting to meet the increasing demand for fallopian tube cancer treatments and escalating healthcare costs. These pharmacies are meticulously monitoring trends in therapeutics, such as angiogenesis inhibitors, molecular diagnostics, and targeted therapies, to optimize pharmacy budgets. As the pharmaceutical industry continues to evolve, hospital pharmacies must balance cost savings with affordability, given the high inbound costs of oncology medications.

Key areas of focus include prognostic biomarkers, adjuvant and neoadjuvant chemotherapy regimens, DNA repair inhibition, epithelial-mesenchymal transition, and precision oncology approaches. The market is further characterized by ongoing research in cancer stem cells, treatment resistance mechanisms, patient selection criteria, supportive care, surgical procedures, treatment response assessment, disease monitoring, disease progression models, adverse event profiles, clinical trial outcomes, tumor microenvironment, personalized medicine, oncogene targeting, palliative care, drug delivery systems, immunotherapy approaches, apoptosis induction, cell cycle arrest, and targeted drug combinations. A recent study revealed that approximately 70% of patients with fallopian tube cancer receive chemotherapy as part of their treatment regimen.

Fallopian Tube Cancer Therapeutics Market Size

Request Free Sample

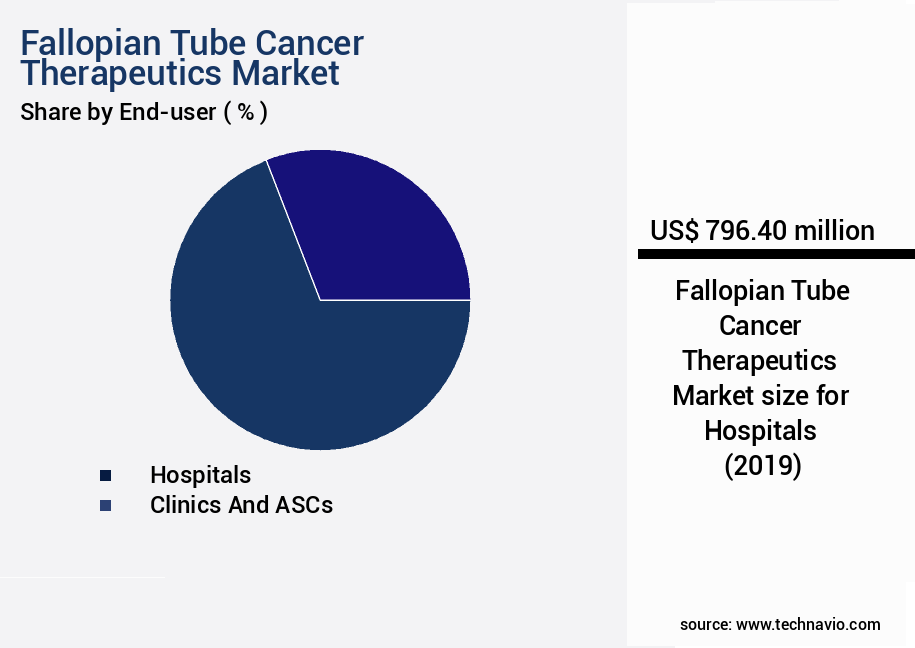
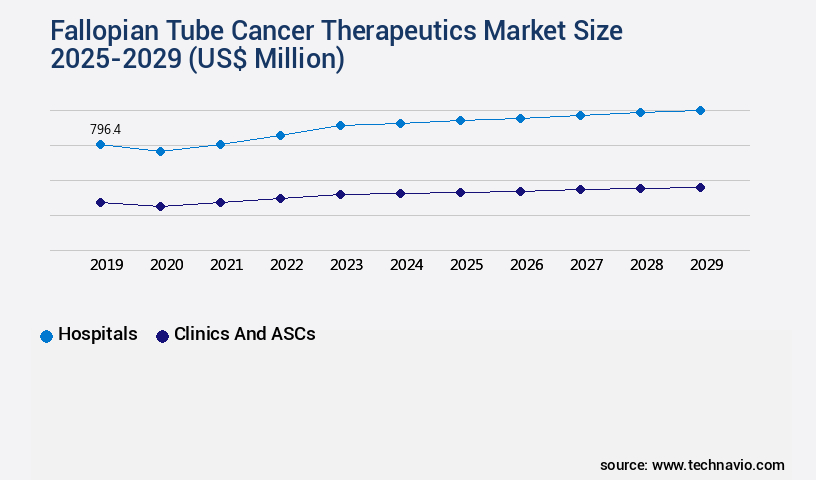
The Hospitals segment was valued at USD 796.40 billion in 2019 and showed a gradual increase during the forecast period.

Fallopian Tube Cancer Therapeutics Market Size

Request Free Sample

Regional Analysis

Asia is estimated to contribute 33% to the growth of the global market during the forecast period.Technavio's analysts have elaborately explained the regional trends and drivers that shape the market during the forecast period.

Fallopian Tube Cancer Therapeutics Market Share by Geography

See How Fallopian Tube Cancer Therapeutics Market Demand is Rising in Asia Request Free Sample

The market in North America is experiencing notable growth, driven by the increasing utilization of advanced treatment options for managing this indication. Traditionally, surgery served as the primary treatment modality, with chemotherapy being the sole therapeutic alternative. However, chemotherapy's limited efficacy and substantial side effects led to a substantial unmet need in the market. As of now, both chemotherapy and surgery, either alone or in combination with radiation therapy, are employed for treating fallopian tube cancer. According to recent studies, the use of targeted therapies and immunotherapies is gaining traction, offering potential improvements in treatment outcomes and reduced side effects.

For instance, the response rate to platinum-based chemotherapy ranges between 30% and 70%, while targeted therapies, such as bevacizumab, have demonstrated response rates of up to 50%. This shift towards more effective and less invasive treatment methods is set to redefine the fallopian tube cancer therapeutics landscape in North America.

Fallopian Tube Cancer Therapeutics Market Share by Geography

 Customer Landscape of Fallopian Tube Cancer Therapeutics Industry

Competitive Intelligence by Technavio Analysis: Leading Players in the Fallopian Tube Cancer Therapeutics Market

Companies are implementing various strategies, such as strategic alliances, fallopian tube cancer therapeutics market forecast, partnerships, mergers and acquisitions, geographical expansion, and product/service launches, to enhance their presence in the industry.

AbbVie Inc. - This research focuses on the company's innovative approach to fallopian tube cancer treatment, specifically their therapeutic candidate Lemzoparlimab. Designed to selectively target tumor cells, it minimizes impact on red blood cells, offering potential for effective treatment with reduced side effects.

The industry research and growth report includes detailed analyses of the competitive landscape of the market and information about key companies, including:

  • AbbVie Inc.
  • Amgen Inc.
  • APIM Therapeutics AS
  • Arrien Pharmaceuticals LLC
  • AstraZeneca Plc
  • Baxter International Inc.
  • BioVaxys Technology Corp.
  • Boehringer Ingelheim International GmbH
  • Daiichi Sankyo Co. Ltd.
  • Eli Lilly and Co.
  • F. Hoffmann La Roche Ltd.
  • Genmab AS
  • GlaxoSmithKline Plc
  • Novartis AG
  • Pfizer Inc.
  • Shattuck Labs Inc.
  • Siemens Healthineers AG
  • Sun Pharmaceutical Industries Ltd.

Qualitative and quantitative analysis of companies has been conducted to help clients understand the wider business environment as well as the strengths and weaknesses of key industry players. Data is qualitatively analyzed to categorize companies as pure play, category-focused, industry-focused, and diversified; it is quantitatively analyzed to categorize companies as dominant, leading, strong, tentative, and weak.

Recent Development and News in Fallopian Tube Cancer Therapeutics Market

  • In January 2025, Merck KGaA, a leading pharmaceutical company, announced the successful completion of patient enrollment in a Phase 3 clinical trial for their innovative fallopian tube cancer treatment, Lynparza. This marks a significant step forward in the development of effective therapeutic options for this rare and often overlooked form of cancer (Merck KGaA press release).
  • In March 2025, AstraZeneca and Daiichi Sankyo, two major pharmaceutical companies, entered into a strategic collaboration to co-develop and co-promote their fallopian tube cancer treatment, Olaparib, in the European Union and other countries outside the United States (AstraZeneca press release).
  • In May 2025, the U.S. Food and Drug Administration (FDA) granted accelerated approval to Zejula, a poly (ADP-ribose) polymerase (PARP) inhibitor developed by AstraZeneca and Merck KGaA, for the treatment of recurrent epithelial ovarian, fallopian tube, or primary peritoneal cancer, significantly expanding treatment options for patients (FDA press release).
  • In August 2025, Clovis Oncology, a biopharmaceutical company, reported a 26% increase in global revenue for their fallopian tube cancer treatment, Rubraca, driven by strong demand and market expansion efforts (Clovis Oncology Q2 2025 earnings report).

Dive into Technavio's robust research methodology, blending expert interviews, extensive data synthesis, and validated models for unparalleled Fallopian Tube Cancer Therapeutics Market insights. See full methodology.

Market Scope

Report Coverage

Details

Page number

224

Base year

2024

Historic period

2019-2023

Forecast period

2025-2029

Growth momentum & CAGR

Accelerate at a CAGR of 10.7%

Market growth 2025-2029

USD 1196 million

Market structure

Fragmented

YoY growth 2024-2025(%)

9.4

Key countries

US, Germany, UK, China, France, Japan, Italy, Canada, Spain, and India

Competitive landscape

Leading Companies, Market Positioning of Companies, Competitive Strategies, and Industry Risks

Request Free Sample

Why Choose Technavio for Fallopian Tube Cancer Therapeutics Market Insights?

"Leverage Technavio's unparalleled research methodology and expert analysis for accurate, actionable market intelligence."

The market is witnessing significant growth due to the increasing incidence and prevalence of this rare and often overlooked gynecological malignancy. The market is driven by the need for effective treatments to improve the efficacy of current chemotherapy regimens for fallopian tube cancer. Research focuses on optimizing radiation therapy protocols and exploring minimally invasive surgical techniques to reduce morbidity and improve patient outcomes. Molecular biomarkers play a crucial role in predicting prognosis and guiding treatment decisions for fallopian tube cancer. Identifying immunotherapy response predictors and understanding oncogene expression patterns are key areas of research to develop personalized treatment plans. Characterization of the tumor microenvironment and the development of novel drug delivery systems are also important areas of investigation. Clinical trial results provide valuable insights into the effectiveness of new treatment modalities, including targeted therapies and immunotherapies. Understanding the genetic mutations driving fallopian tube cancer and developing early detection strategies are essential to improving patient outcomes and reducing treatment resistance mechanisms. Patient selection based on biomarkers and quality of life assessment are critical considerations in the management of fallopian tube cancer. Adverse event management and survival benefit analysis are also important aspects of treatment response evaluation methods. Cancer stem cell targeting is an emerging area of research with the potential to improve treatment outcomes and reduce the risk of recurrence. Overall, the market is poised for growth as researchers and pharmaceutical companies continue to explore new treatment options and optimize existing therapies to improve patient outcomes and reduce morbidity.

What are the Key Data Covered in this Fallopian Tube Cancer Therapeutics Market Research and Growth Report?

  • What is the expected growth of the Fallopian Tube Cancer Therapeutics Market between 2025 and 2029?

    • USD 1.2 billion, at a CAGR of 10.7%

  • What segmentation does the market report cover?

    • The report is segmented by End-user (Hospitals, Clinics and ASCs, and Others), Product (Targeted therapy and Chemotherapy), Drug Class (Biologics, Small-molecule drugs, Vaccines, Combination regimens, and Hormonal agents), and Geography (North America, Europe, Asia, and Rest of World (ROW))

  • Which regions are analyzed in the report?

    • North America, Europe, Asia, and Rest of World (ROW)

  • What are the key growth drivers and market challenges?

    • Growing attention toward women health, Difficulty in diagnosis of fallopian tube cancer

  • Who are the major players in the Fallopian Tube Cancer Therapeutics Market?

    • AbbVie Inc., Amgen Inc., APIM Therapeutics AS, Arrien Pharmaceuticals LLC, AstraZeneca Plc, Baxter International Inc., BioVaxys Technology Corp., Boehringer Ingelheim International GmbH, Daiichi Sankyo Co. Ltd., Eli Lilly and Co., F. Hoffmann La Roche Ltd., Genmab AS, GlaxoSmithKline Plc, Novartis AG, Pfizer Inc., Shattuck Labs Inc., Siemens Healthineers AG, and Sun Pharmaceutical Industries Ltd.

We can help! Our analysts can customize this fallopian tube cancer therapeutics market research report to meet your requirements.

Get in touch

1 Executive Summary

  • 1.1 Market overview
    • Executive Summary - Chart on Market Overview
    • Executive Summary - Data Table on Market Overview
    • Executive Summary - Chart on Global Market Characteristics
    • Executive Summary - Chart on Market by Geography
    • Executive Summary - Chart on Market Segmentation by End-user
    • Executive Summary - Chart on Market Segmentation by Product
    • Executive Summary - Chart on Market Segmentation by Drug Class
    • Executive Summary - Chart on Incremental Growth
    • Executive Summary - Data Table on Incremental Growth
    • Executive Summary - Chart on Company Market Positioning

2 Technavio Analysis

  • 2.1 Analysis of price sensitivity, lifecycle, customer purchase basket, adoption rates, and purchase criteria
    • Analysis of price sensitivity, lifecycle, customer purchase basket, adoption rates, and purchase criteria
  • 2.2 Criticality of inputs and Factors of differentiation
    • Overview on criticality of inputs and factors of differentiation
  • 2.3 Factors of disruption
    • Overview on factors of disruption
  • 2.4 Impact of drivers and challenges
    • Impact of drivers and challenges in 2024 and 2029

3 Market Landscape

  • 3.1 Market ecosystem
    • Parent Market
    • Data Table on - Parent Market
  • 3.2 Market characteristics
    • Market characteristics analysis
  • 3.3 Value chain analysis
    • Value chain analysis

4 Market Sizing

  • 4.1 Market definition
    • Offerings of companies included in the market definition
  • 4.2 Market segment analysis
    • Market segments
  • 4.3 Market size 2024
    • 4.4 Market outlook: Forecast for 2024-2029
      • Chart on Global - Market size and forecast 2024-2029 ($ million)
      • Data Table on Global - Market size and forecast 2024-2029 ($ million)
      • Chart on Global Market: Year-over-year growth 2024-2029 (%)
      • Data Table on Global Market: Year-over-year growth 2024-2029 (%)

    5 Historic Market Size

    • 5.1 Global Fallopian Tube Cancer Therapeutics Market 2019 - 2023
      • Historic Market Size - Data Table on Global Fallopian Tube Cancer Therapeutics Market 2019 - 2023 ($ million)
    • 5.2 End-user segment analysis 2019 - 2023
      • Historic Market Size - End-user Segment 2019 - 2023 ($ million)
    • 5.3 Product segment analysis 2019 - 2023
      • Historic Market Size - Product Segment 2019 - 2023 ($ million)
    • 5.4 Drug Class segment analysis 2019 - 2023
      • Historic Market Size - Drug Class Segment 2019 - 2023 ($ million)
    • 5.5 Geography segment analysis 2019 - 2023
      • Historic Market Size - Geography Segment 2019 - 2023 ($ million)
    • 5.6 Country segment analysis 2019 - 2023
      • Historic Market Size - Country Segment 2019 - 2023 ($ million)

    6 Qualitative Analysis

    • 6.1 The AI impact on Global Fallopian Tube Cancer Therapeutics Market

      7 Five Forces Analysis

      • 7.1 Five forces summary
        • Five forces analysis - Comparison between 2024 and 2029
      • 7.2 Bargaining power of buyers
        • Bargaining power of buyers - Impact of key factors 2024 and 2029
      • 7.3 Bargaining power of suppliers
        • Bargaining power of suppliers - Impact of key factors in 2024 and 2029
      • 7.4 Threat of new entrants
        • Threat of new entrants - Impact of key factors in 2024 and 2029
      • 7.5 Threat of substitutes
        • Threat of substitutes - Impact of key factors in 2024 and 2029
      • 7.6 Threat of rivalry
        • Threat of rivalry - Impact of key factors in 2024 and 2029
      • 7.7 Market condition
        • Chart on Market condition - Five forces 2024 and 2029

      8 Market Segmentation by End-user

      • 8.1 Market segments
        • Chart on End-user - Market share 2024-2029 (%)
        • Data Table on End-user - Market share 2024-2029 (%)
      • 8.2 Comparison by End-user
        • Chart on Comparison by End-user
        • Data Table on Comparison by End-user
      • 8.3 Hospitals - Market size and forecast 2024-2029
        • Chart on Hospitals - Market size and forecast 2024-2029 ($ million)
        • Data Table on Hospitals - Market size and forecast 2024-2029 ($ million)
        • Chart on Hospitals - Year-over-year growth 2024-2029 (%)
        • Data Table on Hospitals - Year-over-year growth 2024-2029 (%)
      • 8.4 Clinics and ASCs - Market size and forecast 2024-2029
        • Chart on Clinics and ASCs - Market size and forecast 2024-2029 ($ million)
        • Data Table on Clinics and ASCs - Market size and forecast 2024-2029 ($ million)
        • Chart on Clinics and ASCs - Year-over-year growth 2024-2029 (%)
        • Data Table on Clinics and ASCs - Year-over-year growth 2024-2029 (%)
      • 8.5 Others - Market size and forecast 2024-2029
        • Chart on Others - Market size and forecast 2024-2029 ($ million)
        • Data Table on Others - Market size and forecast 2024-2029 ($ million)
        • Chart on Others - Year-over-year growth 2024-2029 (%)
        • Data Table on Others - Year-over-year growth 2024-2029 (%)
      • 8.6 Market opportunity by End-user
        • Market opportunity by End-user ($ million)
        • Data Table on Market opportunity by End-user ($ million)

      9 Market Segmentation by Product

      • 9.1 Market segments
        • Chart on Product - Market share 2024-2029 (%)
        • Data Table on Product - Market share 2024-2029 (%)
      • 9.2 Comparison by Product
        • Chart on Comparison by Product
        • Data Table on Comparison by Product
      • 9.3 Targeted therapy - Market size and forecast 2024-2029
        • Chart on Targeted therapy - Market size and forecast 2024-2029 ($ million)
        • Data Table on Targeted therapy - Market size and forecast 2024-2029 ($ million)
        • Chart on Targeted therapy - Year-over-year growth 2024-2029 (%)
        • Data Table on Targeted therapy - Year-over-year growth 2024-2029 (%)
      • 9.4 Chemotherapy - Market size and forecast 2024-2029
        • Chart on Chemotherapy - Market size and forecast 2024-2029 ($ million)
        • Data Table on Chemotherapy - Market size and forecast 2024-2029 ($ million)
        • Chart on Chemotherapy - Year-over-year growth 2024-2029 (%)
        • Data Table on Chemotherapy - Year-over-year growth 2024-2029 (%)
      • 9.5 Market opportunity by Product
        • Market opportunity by Product ($ million)
        • Data Table on Market opportunity by Product ($ million)

      10 Market Segmentation by Drug Class

      • 10.1 Market segments
        • Chart on Drug Class - Market share 2024-2029 (%)
        • Data Table on Drug Class - Market share 2024-2029 (%)
      • 10.2 Comparison by Drug Class
        • Chart on Comparison by Drug Class
        • Data Table on Comparison by Drug Class
      • 10.3 Biologics - Market size and forecast 2024-2029
        • Chart on Biologics - Market size and forecast 2024-2029 ($ million)
        • Data Table on Biologics - Market size and forecast 2024-2029 ($ million)
        • Chart on Biologics - Year-over-year growth 2024-2029 (%)
        • Data Table on Biologics - Year-over-year growth 2024-2029 (%)
      • 10.4 Small-molecule drugs - Market size and forecast 2024-2029
        • Chart on Small-molecule drugs - Market size and forecast 2024-2029 ($ million)
        • Data Table on Small-molecule drugs - Market size and forecast 2024-2029 ($ million)
        • Chart on Small-molecule drugs - Year-over-year growth 2024-2029 (%)
        • Data Table on Small-molecule drugs - Year-over-year growth 2024-2029 (%)
      • 10.5 Vaccines - Market size and forecast 2024-2029
        • Chart on Vaccines - Market size and forecast 2024-2029 ($ million)
        • Data Table on Vaccines - Market size and forecast 2024-2029 ($ million)
        • Chart on Vaccines - Year-over-year growth 2024-2029 (%)
        • Data Table on Vaccines - Year-over-year growth 2024-2029 (%)
      • 10.6 Combination regimens - Market size and forecast 2024-2029
        • Chart on Combination regimens - Market size and forecast 2024-2029 ($ million)
        • Data Table on Combination regimens - Market size and forecast 2024-2029 ($ million)
        • Chart on Combination regimens - Year-over-year growth 2024-2029 (%)
        • Data Table on Combination regimens - Year-over-year growth 2024-2029 (%)
      • 10.7 Hormonal agents - Market size and forecast 2024-2029
        • Chart on Hormonal agents - Market size and forecast 2024-2029 ($ million)
        • Data Table on Hormonal agents - Market size and forecast 2024-2029 ($ million)
        • Chart on Hormonal agents - Year-over-year growth 2024-2029 (%)
        • Data Table on Hormonal agents - Year-over-year growth 2024-2029 (%)
      • 10.8 Market opportunity by Drug Class
        • Market opportunity by Drug Class ($ million)
        • Data Table on Market opportunity by Drug Class ($ million)

      11 Customer Landscape

      • 11.1 Customer landscape overview
        • Analysis of price sensitivity, lifecycle, customer purchase basket, adoption rates, and purchase criteria

      12 Geographic Landscape

      • 12.1 Geographic segmentation
        • Chart on Market share by geography 2024-2029 (%)
        • Data Table on Market share by geography 2024-2029 (%)
      • 12.2 Geographic comparison
        • Chart on Geographic comparison
        • Data Table on Geographic comparison
      • 12.3 North America - Market size and forecast 2024-2029
        • Chart on North America - Market size and forecast 2024-2029 ($ million)
        • Data Table on North America - Market size and forecast 2024-2029 ($ million)
        • Chart on North America - Year-over-year growth 2024-2029 (%)
        • Data Table on North America - Year-over-year growth 2024-2029 (%)
      • 12.4 Europe - Market size and forecast 2024-2029
        • Chart on Europe - Market size and forecast 2024-2029 ($ million)
        • Data Table on Europe - Market size and forecast 2024-2029 ($ million)
        • Chart on Europe - Year-over-year growth 2024-2029 (%)
        • Data Table on Europe - Year-over-year growth 2024-2029 (%)
      • 12.5 Asia - Market size and forecast 2024-2029
        • Chart on Asia - Market size and forecast 2024-2029 ($ million)
        • Data Table on Asia - Market size and forecast 2024-2029 ($ million)
        • Chart on Asia - Year-over-year growth 2024-2029 (%)
        • Data Table on Asia - Year-over-year growth 2024-2029 (%)
      • 12.6 Rest of World (ROW) - Market size and forecast 2024-2029
        • Chart on Rest of World (ROW) - Market size and forecast 2024-2029 ($ million)
        • Data Table on Rest of World (ROW) - Market size and forecast 2024-2029 ($ million)
        • Chart on Rest of World (ROW) - Year-over-year growth 2024-2029 (%)
        • Data Table on Rest of World (ROW) - Year-over-year growth 2024-2029 (%)
      • 12.7 US - Market size and forecast 2024-2029
        • Chart on US - Market size and forecast 2024-2029 ($ million)
        • Data Table on US - Market size and forecast 2024-2029 ($ million)
        • Chart on US - Year-over-year growth 2024-2029 (%)
        • Data Table on US - Year-over-year growth 2024-2029 (%)
      • 12.8 China - Market size and forecast 2024-2029
        • Chart on China - Market size and forecast 2024-2029 ($ million)
        • Data Table on China - Market size and forecast 2024-2029 ($ million)
        • Chart on China - Year-over-year growth 2024-2029 (%)
        • Data Table on China - Year-over-year growth 2024-2029 (%)
      • 12.9 Germany - Market size and forecast 2024-2029
        • Chart on Germany - Market size and forecast 2024-2029 ($ million)
        • Data Table on Germany - Market size and forecast 2024-2029 ($ million)
        • Chart on Germany - Year-over-year growth 2024-2029 (%)
        • Data Table on Germany - Year-over-year growth 2024-2029 (%)
      • 12.10 Japan - Market size and forecast 2024-2029
        • Chart on Japan - Market size and forecast 2024-2029 ($ million)
        • Data Table on Japan - Market size and forecast 2024-2029 ($ million)
        • Chart on Japan - Year-over-year growth 2024-2029 (%)
        • Data Table on Japan - Year-over-year growth 2024-2029 (%)
      • 12.11 UK - Market size and forecast 2024-2029
        • Chart on UK - Market size and forecast 2024-2029 ($ million)
        • Data Table on UK - Market size and forecast 2024-2029 ($ million)
        • Chart on UK - Year-over-year growth 2024-2029 (%)
        • Data Table on UK - Year-over-year growth 2024-2029 (%)
      • 12.12 France - Market size and forecast 2024-2029
        • Chart on France - Market size and forecast 2024-2029 ($ million)
        • Data Table on France - Market size and forecast 2024-2029 ($ million)
        • Chart on France - Year-over-year growth 2024-2029 (%)
        • Data Table on France - Year-over-year growth 2024-2029 (%)
      • 12.13 Italy - Market size and forecast 2024-2029
        • Chart on Italy - Market size and forecast 2024-2029 ($ million)
        • Data Table on Italy - Market size and forecast 2024-2029 ($ million)
        • Chart on Italy - Year-over-year growth 2024-2029 (%)
        • Data Table on Italy - Year-over-year growth 2024-2029 (%)
      • 12.14 India - Market size and forecast 2024-2029
        • Chart on India - Market size and forecast 2024-2029 ($ million)
        • Data Table on India - Market size and forecast 2024-2029 ($ million)
        • Chart on India - Year-over-year growth 2024-2029 (%)
        • Data Table on India - Year-over-year growth 2024-2029 (%)
      • 12.15 Canada - Market size and forecast 2024-2029
        • Chart on Canada - Market size and forecast 2024-2029 ($ million)
        • Data Table on Canada - Market size and forecast 2024-2029 ($ million)
        • Chart on Canada - Year-over-year growth 2024-2029 (%)
        • Data Table on Canada - Year-over-year growth 2024-2029 (%)
      • 12.16 Spain - Market size and forecast 2024-2029
        • Chart on Spain - Market size and forecast 2024-2029 ($ million)
        • Data Table on Spain - Market size and forecast 2024-2029 ($ million)
        • Chart on Spain - Year-over-year growth 2024-2029 (%)
        • Data Table on Spain - Year-over-year growth 2024-2029 (%)
      • 12.17 Market opportunity by geography
        • Market opportunity by geography ($ million)
        • Data Tables on Market opportunity by geography ($ million)

      13 Drivers, Challenges, and Opportunity/Restraints

      • 13.1 Market drivers
        • 13.2 Market challenges
          • 13.3 Impact of drivers and challenges
            • Impact of drivers and challenges in 2024 and 2029
          • 13.4 Market opportunities/restraints

            14 Competitive Landscape

            • 14.1 Overview
              • 14.2 Competitive Landscape
                • Overview on criticality of inputs and factors of differentiation
              • 14.3 Landscape disruption
                • Overview on factors of disruption
              • 14.4 Industry risks
                • Impact of key risks on business

              15 Competitive Analysis

              • 15.1 Companies profiled
                • Companies covered
              • 15.2 Company ranking index
                • Company ranking index
              • 15.3 Market positioning of companies
                • Matrix on companies position and classification
              • 15.4 AbbVie Inc.
                • AbbVie Inc. - Overview
                • AbbVie Inc. - Product / Service
                • AbbVie Inc. - Key news
                • AbbVie Inc. - Key offerings
                • SWOT
              • 15.5 Amgen Inc.
                • Amgen Inc. - Overview
                • Amgen Inc. - Product / Service
                • Amgen Inc. - Key news
                • Amgen Inc. - Key offerings
                • SWOT
              • 15.6 APIM Therapeutics AS
                • APIM Therapeutics AS - Overview
                • APIM Therapeutics AS - Product / Service
                • APIM Therapeutics AS - Key offerings
                • SWOT
              • 15.7 AstraZeneca Plc
                • AstraZeneca Plc - Overview
                • AstraZeneca Plc - Product / Service
                • AstraZeneca Plc - Key news
                • AstraZeneca Plc - Key offerings
                • SWOT
              • 15.8 Baxter International Inc.
                • Baxter International Inc. - Overview
                • Baxter International Inc. - Business segments
                • Baxter International Inc. - Key news
                • Baxter International Inc. - Key offerings
                • Baxter International Inc. - Segment focus
                • SWOT
              • 15.9 Boehringer Ingelheim International GmbH
                • Boehringer Ingelheim International GmbH - Overview
                • Boehringer Ingelheim International GmbH - Product / Service
                • Boehringer Ingelheim International GmbH - Key news
                • Boehringer Ingelheim International GmbH - Key offerings
                • SWOT
              • 15.10 Eli Lilly and Co.
                • Eli Lilly and Co. - Overview
                • Eli Lilly and Co. - Product / Service
                • Eli Lilly and Co. - Key offerings
                • SWOT
              • 15.11 F. Hoffmann La Roche Ltd.
                • F. Hoffmann La Roche Ltd. - Overview
                • F. Hoffmann La Roche Ltd. - Business segments
                • F. Hoffmann La Roche Ltd. - Key news
                • F. Hoffmann La Roche Ltd. - Key offerings
                • F. Hoffmann La Roche Ltd. - Segment focus
                • SWOT
              • 15.12 Genmab AS
                • Genmab AS - Overview
                • Genmab AS - Product / Service
                • Genmab AS - Key offerings
                • SWOT
              • 15.13 GlaxoSmithKline Plc
                • GlaxoSmithKline Plc - Overview
                • GlaxoSmithKline Plc - Business segments
                • GlaxoSmithKline Plc - Key news
                • GlaxoSmithKline Plc - Key offerings
                • GlaxoSmithKline Plc - Segment focus
                • SWOT
              • 15.14 Novartis AG
                • Novartis AG - Overview
                • Novartis AG - Business segments
                • Novartis AG - Key news
                • Novartis AG - Key offerings
                • Novartis AG - Segment focus
                • SWOT
              • 15.15 Pfizer Inc.
                • Pfizer Inc. - Overview
                • Pfizer Inc. - Product / Service
                • Pfizer Inc. - Key news
                • Pfizer Inc. - Key offerings
                • SWOT
              • 15.16 Shattuck Labs Inc.
                • Shattuck Labs Inc. - Overview
                • Shattuck Labs Inc. - Product / Service
                • Shattuck Labs Inc. - Key offerings
                • SWOT
              • 15.17 Siemens Healthineers AG
                • Siemens Healthineers AG - Overview
                • Siemens Healthineers AG - Business segments
                • Siemens Healthineers AG - Key news
                • Siemens Healthineers AG - Key offerings
                • Siemens Healthineers AG - Segment focus
                • SWOT
              • 15.18 Sun Pharmaceutical Industries Ltd.
                • Sun Pharmaceutical Industries Ltd. - Overview
                • Sun Pharmaceutical Industries Ltd. - Product / Service
                • Sun Pharmaceutical Industries Ltd. - Key news
                • Sun Pharmaceutical Industries Ltd. - Key offerings
                • SWOT

              16 Appendix

              • 16.1 Scope of the report
                • 16.2 Inclusions and exclusions checklist
                  • Inclusions checklist
                  • Exclusions checklist
                • 16.3 Currency conversion rates for US$
                  • Currency conversion rates for US$
                • 16.4 Research methodology
                  • Research methodology
                • 16.5 Data procurement
                  • Information sources
                • 16.6 Data validation
                  • Data validation
                • 16.7 Validation techniques employed for market sizing
                  • Validation techniques employed for market sizing
                • 16.8 Data synthesis
                  • Data synthesis
                • 16.9 360 degree market analysis
                  • 360 degree market analysis
                • 16.10 List of abbreviations
                  • List of abbreviations

                Research Methodology

                Technavio presents a detailed picture of the market by way of study, synthesis, and summation of data from multiple sources. The analysts have presented the various facets of the market with a particular focus on identifying the key industry influencers. The data thus presented is comprehensive, reliable, and the result of extensive research, both primary and secondary.

                INFORMATION SOURCES

                Primary sources

                • Manufacturers and suppliers
                • Channel partners
                • Industry experts
                • Strategic decision makers

                Secondary sources

                • Industry journals and periodicals
                • Government data
                • Financial reports of key industry players
                • Historical data
                • Press releases

                DATA ANALYSIS

                Data Synthesis

                • Collation of data
                • Estimation of key figures
                • Analysis of derived insights

                Data Validation

                • Triangulation with data models
                • Reference against proprietary databases
                • Corroboration with industry experts

                REPORT WRITING

                Qualitative

                • Market drivers
                • Market challenges
                • Market trends
                • Five forces analysis

                Quantitative

                • Market size and forecast
                • Market segmentation
                • Geographical insights
                • Competitive landscape

                Interested in this report?

                Get your sample now to see our research methodology and insights!

                Download Now

                Frequently Asked Questions

                Fallopian Tube Cancer Therapeutics market growth will increase by $ 1196 mn during 2025-2029.

                The Fallopian Tube Cancer Therapeutics market is expected to grow at a CAGR of 10.7% during 2025-2029.

                Fallopian Tube Cancer Therapeutics market is segmented by End-user( Hospitals, Clinics and ASCs, Others) Product( Targeted therapy, Chemotherapy, Asia, Rest of World (ROW)) Drug Class( Biologics, Small-molecule drugs, Vaccines, Combination regimens, Hormonal agents)

                AbbVie Inc., Amgen Inc., APIM Therapeutics AS, Arrien Pharmaceuticals LLC, AstraZeneca Plc, Baxter International Inc., BioVaxys Technology Corp., Boehringer Ingelheim International GmbH, Daiichi Sankyo Co. Ltd., Eli Lilly and Co., F. Hoffmann La Roche Ltd., Genmab AS, GlaxoSmithKline Plc, Novartis AG, Pfizer Inc., Shattuck Labs Inc., Siemens Healthineers AG, Sun Pharmaceutical Industries Ltd. are a few of the key vendors in the Fallopian Tube Cancer Therapeutics market.

                Asia will register the highest growth rate of 33% among the other regions. Therefore, the Fallopian Tube Cancer Therapeutics market in Asia is expected to garner significant business opportunities for the vendors during the forecast period.

                US, Germany, UK, China, France, Japan, Italy, Canada, Spain, India

                • Growing attention toward women healthThe global fallopian tube cancer therapeutics market is expected to benefit significantly from the growing attention toward women health globally. The market faced a challenge with the lack of awareness about various gynecologic cancer indications is the driving factor this market.
                • such as fallopian tube cancer and ovarian cancer. Hence is the driving factor this market.
                • various organizations and governments across the globe are working on increasing awareness to overcome certain challenges associated with the diagnosis and treatment of fallopian tube cancer. For instance is the driving factor this market.
                • the Office on Women Health is the driving factor this market.
                • a part of the US Department of Health and Human Services is the driving factor this market.
                • is an organization that focuses on critical women health issues. The organization is working on increasing awareness about the indication through various programs that educate people about the severity of the indication. It conducts the National Women Health Week during the third week of May every year is the driving factor this market.
                • which focuses on promoting women health in the US. Similarly is the driving factor this market.
                • the Foundation for Women Cancer is an organization that focuses on educating the general population about the risk factors and available treatment options related to gynecologic cancers. The organization has started a campaign called Gynecologic Cancer Awareness Month is the driving factor this market.
                • which focuses on increasing awareness among people and government organizations regarding these indications and the need for an increased focus on women health.Various governments have also launched multiple schemes to promote attention toward women health. Moreover is the driving factor this market.
                • the market has also witnessed an increase in the number of campaigns that primarily focus on women health. For instance is the driving factor this market.
                • the National Institute of Environmental Health Sciences has started a campaign called Women Health Awareness Day is the driving factor this market.
                • which focuses on encouraging women to understand and take responsibility for their health problems and increase awareness of the indications that are hard to diagnose. These initiatives are resulting in an increased diagnosis of the indication is the driving factor this market.
                • thus resulting in an increased incidence. Hence is the driving factor this market.
                • the growing attention toward women health is expected to drive the growth of the global fallopian tube cancer therapeutics market during the forecast period. is the driving factor this market.

                The Fallopian Tube Cancer Therapeutics market vendors should focus on grabbing business opportunities from the Hospitals segment as it accounted for the largest market share in the base year.