
Female Condoms Market Size 2025-2029
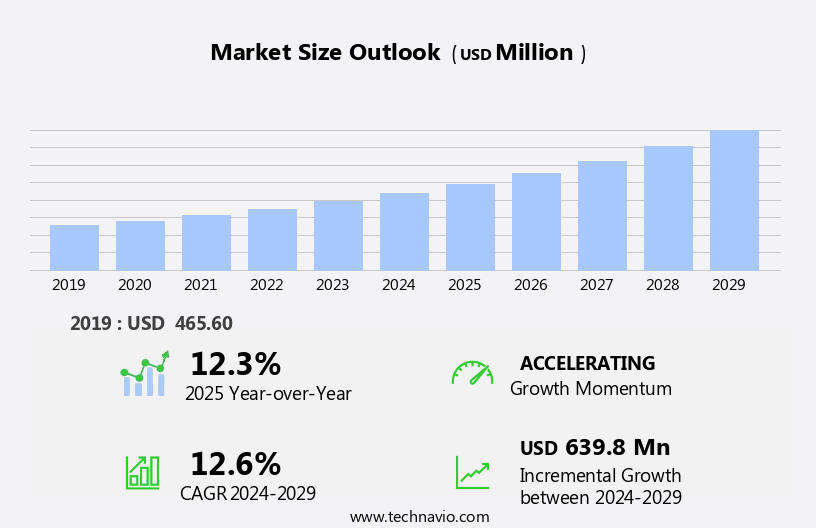
The female condoms market size is forecast to increase by USD 639.8 million, at a CAGR of 12.6% between 2024 and 2029.
- The Female Condom Market is experiencing significant growth, driven by the increasing prevalence of Sexually Transmitted Diseases (STDs) and the rising popularity of female condoms as a form of contraception and protection against STDs. This shift in consumer preference is attributed to the unique advantages of female condoms, including the control and convenience they offer to women. However, the market faces challenges, including the side effects associated with their use, such as discomfort and noise during intercourse, which may deter some users. These challenges underscore the need for continued innovation and improvement in the design and manufacturing of female condoms and sexual wellness products to address these concerns and expand their appeal.
- Companies in the market can capitalize on the growing demand for effective and convenient contraceptive solutions by focusing on addressing these challenges through product development and marketing efforts. By offering female condoms with improved comfort, discretion, and effectiveness, companies can differentiate themselves in the market and attract a larger customer base. Additionally, collaborations with healthcare providers and organizations to promote awareness and education about the benefits and proper usage of female condoms can further drive market growth.
What will be the Size of the Female Condoms Market during the forecast period?
Explore in-depth regional segment analysis with market size data - historical 2019-2023 and forecasts 2025-2029 - in the full report.
Request Free Sample
The female condom market continues to evolve, driven by various dynamics and applications across sectors. Natural rubber latex, a key component in female condom production, undergoes constant quality assurance checks to ensure the highest standards. Sexual health research and consumer preferences shape the market, with education initiatives and product lifecycle management playing crucial roles. Data analytics and manufacturing processes are continually refined to enhance usability and improve user satisfaction. Public perception and brand awareness are influenced by competitive landscape analysis, public health campaigns, and user experience. Product innovation, sustainability initiatives, and responsible sourcing are increasingly prioritized to address health concerns and meet the evolving needs of the target audience.
Product differentiation and certification standards contribute to risk assessment and risk mitigation strategies. Material testing and clinical trials ensure contraceptive efficacy and product safety, while retail sales and wholesale distribution channels expand accessibility. Shelf life and disposal methods are also critical considerations in the dynamic and ongoing market landscape.
How is this Female Condoms Industry segmented?
The female condoms industry research report provides comprehensive data (region-wise segment analysis), with forecasts and estimates in "USD million" for the period 2025-2029, as well as historical data from 2019-2023 for the following segments.
- Distribution Channel
- Retail stores
- Online stores
- Material
- Latex
- Non latex
- End-user
- Individual consumers
- Others
- Geography
- North America
- US
- Canada
- Europe
- Germany
- UK
- Middle East and Africa
- South Africa
- APAC
- Australia
- China
- India
- Japan
- South Korea
- Rest of World (ROW)
- North America
By Distribution Channel Insights
The retail stores segment is estimated to witness significant growth during the forecast period.
The market encompasses various entities, including medical journals, scientific publications, and advocacy groups, which contribute to the advancement of sexual health research and education. Ethical sourcing and sustainable packaging are essential considerations for manufacturers, ensuring product safety and consumer trust. Market share analysis indicates a growing demand for female condoms due to their effectiveness in STI prevention and pregnancy prevention. Risk mitigation strategies, such as clear instructions for use and proper disposal methods, are crucial for minimizing side effects and ensuring user satisfaction. Marketing strategies focus on targeting diverse audiences, with public health campaigns and user experience initiatives driving brand awareness.
Competitive landscape analysis reveals a competitive market, with manufacturers differentiating themselves through improved design, responsible sourcing, and certification standards. Sales forecasting relies on data analytics and product lifecycle management, while compliance management and quality control ensure regulatory adherence. Manufacturing processes prioritize material testing and contraceptive efficacy, with new material development enhancing usability and reducing allergic reactions. Public perception and consumer preferences influence market trends, with sustainability initiatives and environmental impact becoming increasingly important. Distribution channels include wholesale and retail, with retail stores such as Walmart, Walgreens, and CVS Pharmacy playing a significant role in sales. Supply chain management and risk assessment are critical for maintaining product safety and shelf life, with recycling programs and certification standards addressing environmental concerns.
Clinical trials and user experience research contribute to product innovation, ensuring continuous improvement and addressing user needs. Overall, the market exhibits a dynamic and evolving landscape, driven by scientific advancements, consumer preferences, and regulatory requirements.
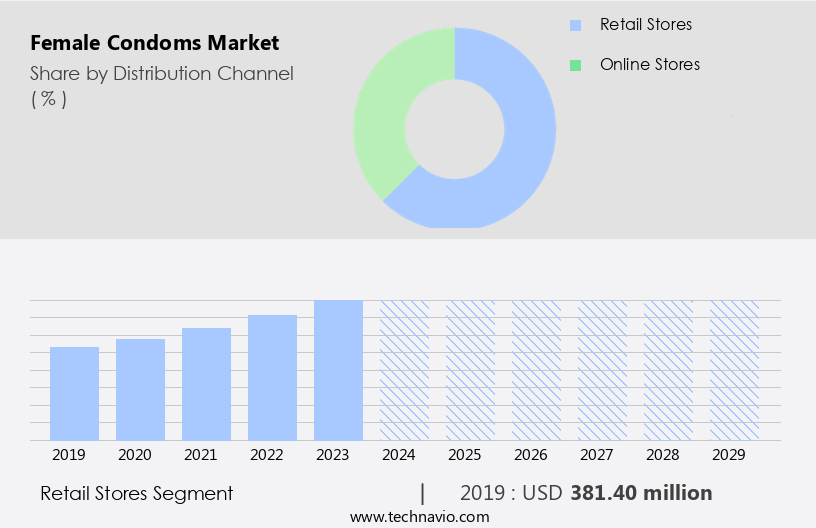
The Retail stores segment was valued at USD 381.40 million in 2019 and showed a gradual increase during the forecast period.
Regional Analysis
APAC is estimated to contribute 41% to the growth of the global market during the forecast period. Technavio's analysts have elaborately explained the regional trends and drivers that shape the market during the forecast period.
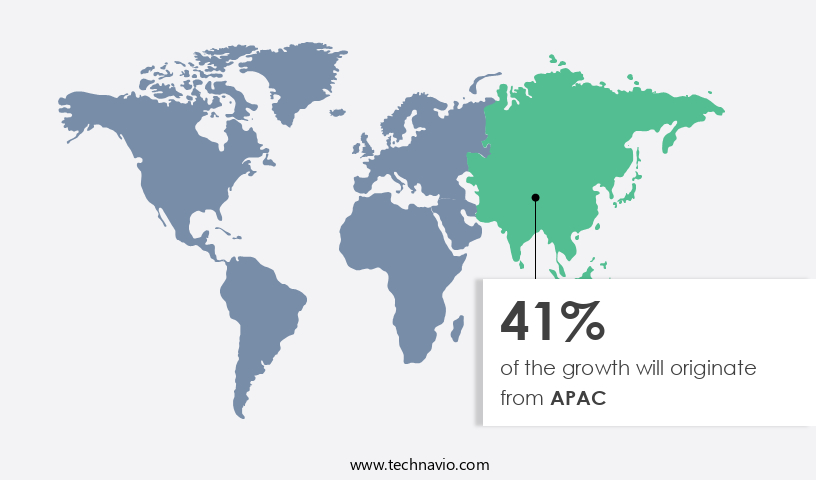
The market in Asia Pacific (APAC) is experiencing significant growth, driven by increasing awareness of sexual health benefits, a diverse product range, and the expanding e-commerce sector. Factors such as rising disposable income and population growth are further fueling demand. Key countries in APAC contributing to market growth include China, Japan, South Korea, Thailand, Malaysia, and India. China stands out as a significant market due to high consumer spending on sexual wellness products. Ethical sourcing and sustainable packaging are essential considerations for manufacturers, aligning with consumer preferences and health concerns. Product innovation, including improved design and enhanced usability, is a critical marketing strategy to attract and retain customers.
Risk mitigation strategies, such as clear instructions for use and product labeling, are crucial for consumer safety and satisfaction. Sales forecasting and distribution channels, including wholesale and retail, require effective supply chain management. Sustainability initiatives, such as recycling programs and responsible sourcing, are essential for reducing environmental impact. Market share analysis and competitive landscape assessment are ongoing efforts to differentiate products and maintain brand awareness. Clinical trials, user experience research, and public health campaigns are essential for ensuring product safety, contraceptive efficacy, and consumer education. Quality control and product safety are paramount for maintaining consumer trust and regulatory compliance. New material development and certification standards are ongoing priorities for manufacturers to stay competitive and meet evolving consumer needs.
Market Dynamics
Our researchers analyzed the data with 2024 as the base year, along with the key drivers, trends, and challenges. A holistic analysis of drivers will help companies refine their marketing strategies to gain a competitive advantage.
The market represents a significant segment of the global contraceptive industry, offering women an alternative to traditional male condoms. These innovative, female-initiated contraceptives provide enhanced control and privacy, making them an attractive option for many. Female condoms are made of thin, flexible polyurethane material, ensuring effective protection against sexually transmitted infections and unwanted pregnancies. They are reusable, easy to use, and available in various sizes for a comfortable fit. The market is driven by factors such as increasing awareness of sexual and reproductive health, growing acceptance of female-initiated contraceptives, and government initiatives to promote family planning. Additionally, advancements in technology have led to the development of new, improved female condoms, further boosting market growth. Consumer education and accessibility are key challenges in this market, as is competition from other forms of contraception. Despite these challenges, the market continues to expand, offering women greater choice and control in family planning and sexual health.
What are the key market drivers leading to the rise in the adoption of Female Condoms Industry?
- The rising incidence of sexually transmitted diseases (STDs) serves as the primary catalyst for market growth in this sector.
- Sexually Transmitted Diseases (STDs) pose significant health concerns for individuals worldwide. With over 30 types of bacteria, viruses, and parasites known to cause STDs, including syphilis, gonorrhea, chlamydia, trichomoniasis, hepatitis B, genital herpes, HIV/AIDS, and HPV-related diseases, prevention methods are essential. One such method is the use of Female Condoms. Female Condoms offer a reliable solution for pregnancy prevention and protection against STDs. Sustainable packaging and disposal methods are crucial considerations for this product. Quality control and product safety are paramount to ensure consumer health and well-being. Advocacy groups and health organizations emphasize the importance of risk assessment, product labeling, and compliance management.
- New material development and wholesale distribution channels are essential for market growth. Recycling programs are gaining popularity to minimize environmental impact. Allergic reactions to Female Condoms are a concern for some users. Thorough risk assessment and product testing are necessary to minimize these occurrences. Compliance with regulatory bodies and industry standards is essential to maintain consumer trust. In conclusion, the Female Condom market is driven by the increasing prevalence of STDs and the need for effective, sustainable, and accessible methods of protection. Market dynamics include product development, distribution, quality control, and consumer education. Sustainability, health concerns, and product safety remain key priorities for manufacturers and distributors.
What are the market trends shaping the Female Condoms Industry?
- The use of female condoms is gaining significant traction in the market, representing an emerging trend in reproductive health solutions. This growing popularity underscores the increasing demand for alternative contraceptive options, catering to diverse preferences and needs.
- The female condom market has experienced significant growth in recent years due to increasing consumer preferences for enhanced usability and improved sexual health. In developed countries, including the US, there is a rising trend towards the adoption of female condoms, driven by public health campaigns and education initiatives. The US government's disease control program distributes a substantial number of female condoms through various channels, such as beauty salons, convenience stores, and clinics, to promote their use and reduce HIV rates. Quality assurance is a crucial factor in the market, with manufacturers implementing rigorous product lifecycle management and data analytics to ensure the production of high-quality condoms.
- Natural rubber latex is a common material used in manufacturing processes due to its durability and effectiveness. Brand awareness and user satisfaction are essential components of market success. Companies are investing in research and development to enhance the usability and appeal of their products. Public perception plays a significant role in market dynamics, with positive brand image and competitive landscape analysis being essential factors. Storage conditions are another critical consideration, with manufacturers ensuring that their products are stored under optimal conditions to maintain their effectiveness. The market is expected to continue growing, driven by ongoing research in sexual health and the increasing importance of sexual health education and awareness.
What challenges does the Female Condoms Industry face during its growth?
- The use of condoms comes with certain side effects, which poses a significant challenge to the growth of the industry. These side effects, including allergic reactions and reduced sensitivity, can deter consumers and hinder market expansion.
- The Female Condom market faces challenges due to health concerns and the need for material testing to ensure contraceptive efficacy and user experience. Clinical trials are essential to assess the safety and effectiveness of these products, as the vaginal tissue is highly sensitive and absorptive. The presence of hormone-disrupting chemicals and toxic substances, often added as flavors and lubricants, can lead to skin infections and other health issues. To address these concerns, companies are focusing on sustainability initiatives, such as using eco-friendly materials and improving design for enhanced user experience.
- Product differentiation through certification standards, responsible sourcing, and longer shelf life also plays a crucial role in market growth. Sexual health education and environmental impact are becoming increasingly important factors influencing consumer preferences. Ensuring the highest standards of quality and safety is essential to build trust and loyalty among the target audience.
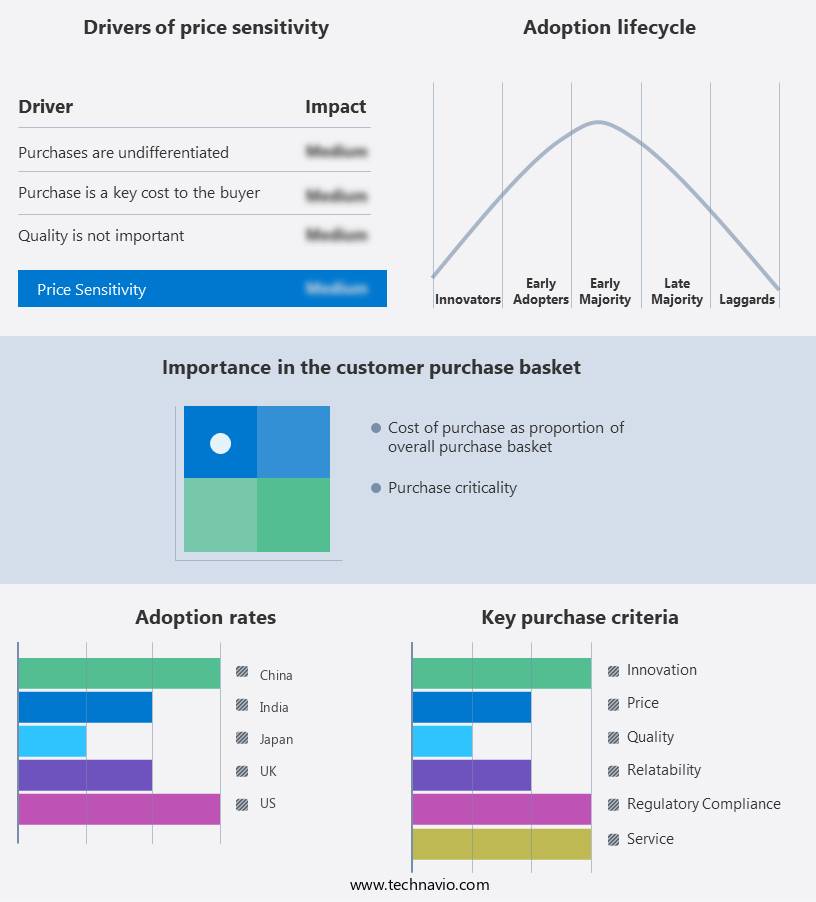
Exclusive Customer Landscape
The female condoms market forecasting report includes the adoption lifecycle of the market, covering from the innovator's stage to the laggard's stage. It focuses on adoption rates in different regions based on penetration. Furthermore, the female condoms market report also includes key purchase criteria and drivers of price sensitivity to help companies evaluate and develop their market growth analysis strategies.
Customer Landscape
Key Companies & Market Insights
Companies are implementing various strategies, such as strategic alliances, female condoms market forecast, partnerships, mergers and acquisitions, geographical expansion, and product/service launches, to enhance their presence in the industry.
Cupid Ltd. - This company specializes in innovative female reproductive health solutions. Brands include Condomize and Ormeve for female condoms, and i-pill for emergency contraception.
The industry research and growth report includes detailed analyses of the competitive landscape of the market and information about key companies, including:
- Cupid Ltd.
- Global Protection Corp.
- HLL Lifecare Ltd.
- Karex Berhad
- MEDZEEL LIFESCIENCE
- Reckitt Benckiser Group Plc
- StaySafe Condoms
- Veru Inc.
Qualitative and quantitative analysis of companies has been conducted to help clients understand the wider business environment as well as the strengths and weaknesses of key industry players. Data is qualitatively analyzed to categorize companies as pure play, category-focused, industry-focused, and diversified; it is quantitatively analyzed to categorize companies as dominant, leading, strong, tentative, and weak.
Recent Development and News in Female Condoms Market
- In January 2024, the World Health Organization (WHO) endorsed the use of the FC2 Female Condom as part of its comprehensive sexual and reproductive health programs, marking a significant regulatory approval for the product (WHO, 2024). This endorsement is expected to boost the market penetration of female condoms, particularly in low- and middle-income countries.
- In March 2024, the Female Health Company, a leading manufacturer of female condoms, announced a strategic partnership with BD (Becton, Dickinson and Company), a global medical technology company, to expand its production capacity and distribution network (BD, 2024). This collaboration aims to increase the accessibility and affordability of female condoms in various markets.
- In May 2024, the Bill & Melinda Gates Foundation made a USD 10 million investment in the Female Health Company to support the expansion of its manufacturing capabilities and research and development initiatives (Gates Foundation, 2024). This funding round underscores the growing interest and commitment from major philanthropic organizations to advance the female condom market.
- In February 2025, the European Commission granted marketing authorization to the FC2 Female Condom for sale and distribution across all European Union member states (European Medicines Agency, 2025). This approval marks a key geographic expansion for the product, potentially increasing its market share in Europe.
Research Analyst Overview
- In the dynamic female condom market, user-centered design plays a pivotal role in catering to the sexual health needs of diverse target audiences. Non-latex options, addressing latex sensitivity, are increasingly popular, aligning with renewable resources and patent protection. Marketing communications emphasize ethical business practices, corporate social responsibility, and carbon footprint reduction. Waste management and community health are key concerns, driving the adoption of biodegradable materials and sustainable packaging design. Hormonal effects, product stewardship, and consumer protection are integral to product development, ensuring quality assurance and accessibility design.
- Online marketing, sales and distribution channels, and supply chain transparency are essential for reaching consumers. The barrier method's environmental responsibility and inclusive design contribute to brand loyalty, while intellectual property and health policy shape product positioning. Product recall and reproductive health are critical considerations for manufacturers, ensuring consumer trust and safety.
Dive into Technavio's robust research methodology, blending expert interviews, extensive data synthesis, and validated models for unparalleled Female Condoms Market insights. See full methodology.
|
Market Scope |
|
|
Report Coverage |
Details |
|
Page number |
185 |
|
Base year |
2024 |
|
Historic period |
2019-2023 |
|
Forecast period |
2025-2029 |
|
Growth momentum & CAGR |
Accelerate at a CAGR of 12.6% |
|
Market growth 2025-2029 |
USD 639.8 million |
|
Market structure |
Concentrated |
|
YoY growth 2024-2025(%) |
12.3 |
|
Key countries |
US, China, India, Japan, UK, Canada, South Korea, Germany, Australia, and South Africa |
|
Competitive landscape |
Leading Companies, Market Positioning of Companies, Competitive Strategies, and Industry Risks |
What are the Key Data Covered in this Female Condoms Market Research and Growth Report?
- CAGR of the Female Condoms industry during the forecast period
- Detailed information on factors that will drive the growth and forecasting between 2025 and 2029
- Precise estimation of the size of the market and its contribution of the industry in focus to the parent market
- Accurate predictions about upcoming growth and trends and changes in consumer behaviour
- Growth of the market across APAC, North America, Europe, Middle East and Africa, and South America
- Thorough analysis of the market's competitive landscape and detailed information about companies
- Comprehensive analysis of factors that will challenge the female condoms market growth of industry companies
We can help! Our analysts can customize this female condoms market research report to meet your requirements.
 RIA -
RIA - 
