Sexual Wellness Market Analysis, Size, and Forecast 2026-2030: North America (US, Canada, and Mexico), APAC (China, Japan, and India), Europe (Germany, UK, and France), South America (Brazil, Argentina, and Colombia), Middle East and Africa (UAE, Saudi Arabia, and South Africa), and Rest of World (ROW)

Sexual Wellness Market Analysis, Size, and Forecast 2026-2030:
North America (US, Canada, and Mexico), APAC (China, Japan, and India), Europe (Germany, UK, and France), South America (Brazil, Argentina, and Colombia), Middle East and Africa (UAE, Saudi Arabia, and South Africa), and Rest of World (ROW)

Published: Mar 2026 305 Pages SKU: IRTNTR71003

Market Overview at a Glance

$43.54 B
Market Opportunity
8.2%
CAGR 2025 - 2030
32.4%
North America Growth
$39.23 B
Sex toys segment 2024

Sexual Wellness Market Size 2026-2030

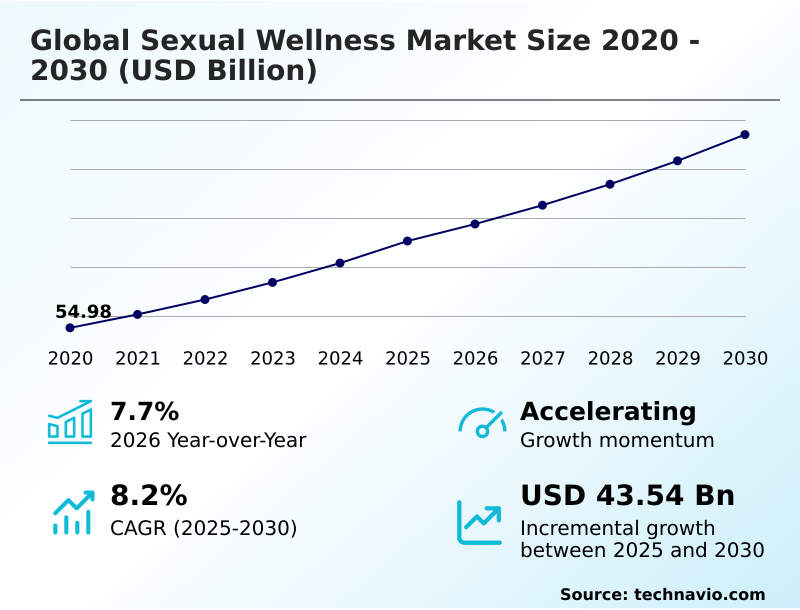
The sexual wellness market size is valued to increase by USD 43.54 billion, at a CAGR of 8.2% from 2025 to 2030. Rising sexual health literacy rates will drive the sexual wellness market.

Major Market Trends & Insights

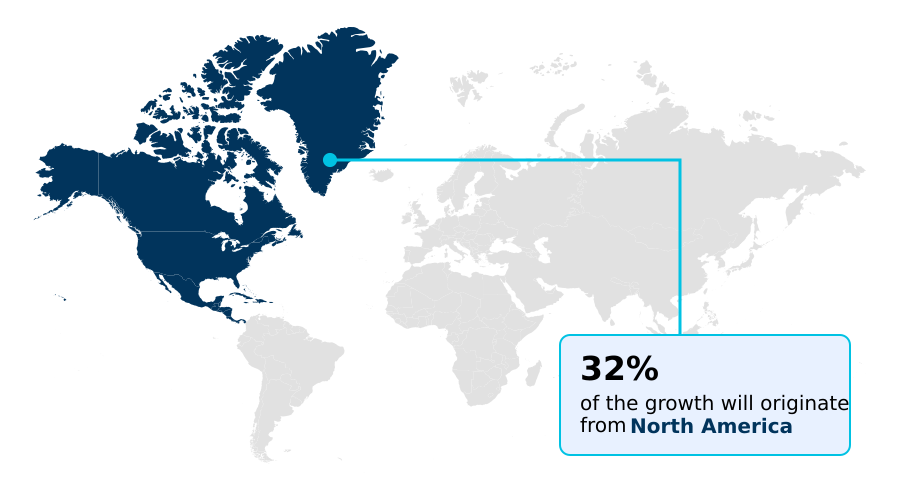
  • North America dominated the market and accounted for a 32.4% growth during the forecast period.
  • By Product - Sex toys segment was valued at USD 39.23 billion in 2024
  • By Distribution Channel - Offline segment accounted for the largest market revenue share in 2024

Market Size & Forecast

  • Market Opportunities: USD 79.06 billion
  • Market Future Opportunities: USD 43.54 billion
  • CAGR from 2025 to 2030 : 8.2%

Market Summary

  • The sexual wellness market is undergoing a significant transformation, moving beyond simple products to a holistic ecosystem focused on overall well-being. This shift is driven by increasing sexual health literacy, destigmatization of pleasure, and the powerful influence of digital retail channels that offer privacy and accessibility.
  • Key trends include the adoption of sustainable wellness products and body-safe materials like medical-grade silicone, reflecting a consumer demand for both quality and ethical manufacturing. Technological integration is pivotal, with teledildonics, smart wellness devices, and app-controlled devices offering personalized experiences.
  • For instance, a direct-to-consumer brand can leverage data analytics to navigate the complex landscape of consumer preferences and regulatory compliance across different regions, tailoring its marketing and product offerings. This allows them to effectively market men's pleasure devices in one area while promoting femen empowerment products in another.
  • Challenges such as social stigma in conservative markets and stringent regulations persist, but the industry's focus on innovation, education, and inclusivity continues to propel its growth, creating a resilient market where demand is based on genuine health and wellness needs.

What will be the Size of the Sexual Wellness Market during the forecast period?

Get Key Insights on Market Forecast (PDF) Request Free Sample

How is the Sexual Wellness Market Segmented?

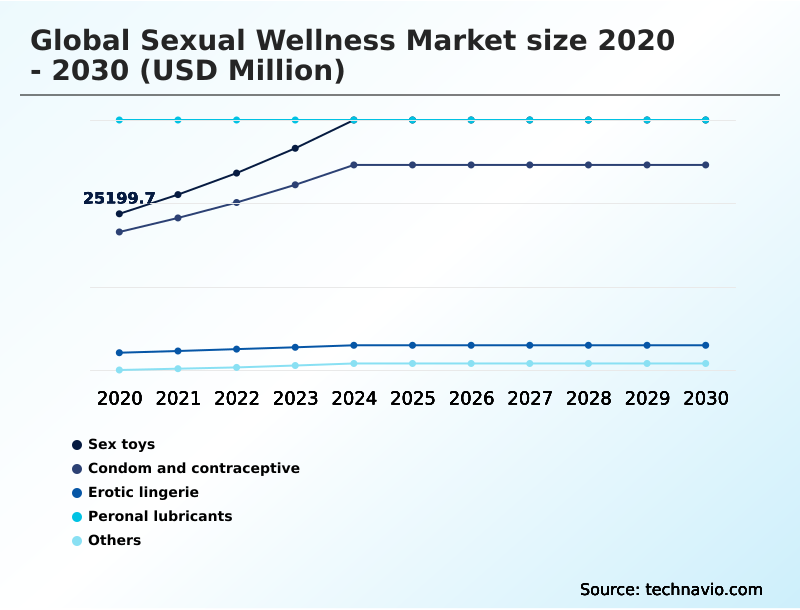
The sexual wellness industry research report provides comprehensive data (region-wise segment analysis), with forecasts and estimates in "USD million" for the period 2026-2030, as well as historical data from 2020-2024 for the following segments.

  • Product
    • Sex toys
    • Condom and contraceptive
    • Erotic lingerie
    • Personal lubricants
    • Others
  • Distribution channel
    • Offline
    • Online
  • End-user
    • Men
    • Women
    • Couples
    • LGBTQ plus community
    • Elderly
  • Geography
    • North America
      • US
      • Canada
      • Mexico
    • APAC
      • China
      • Japan
      • India
    • Europe
      • Germany
      • UK
      • France
    • South America
      • Brazil
      • Argentina
      • Colombia
    • Middle East and Africa
      • UAE
      • Saudi Arabia
      • South Africa
    • Rest of World (ROW)

By Product Insights

The sex toys segment is estimated to witness significant growth during the forecast period.

The global sexual wellness market 2026-2030 is segmented by product, distribution channel, end-user, and geography. The sex toys segment, a core component of the industry, includes a diverse range of pleasure devices designed for physical stimulation.

Increasing acceptance of sexual self-care and the destigmatization of pleasure have made these products mainstream. Manufacturers focus on ergonomic designs with body-safe materials like medical-grade silicone, while technological integration of haptic technology and app-controlled devices is common.

This innovation is driving consumer interest, with AI-driven personal consultation tools on e-commerce platforms increasing average order values by up to 30%.

The focus on holistic wellness and femen empowerment products further fuels this segment, supported by educational marketing that normalizes the use of clitoral stimulators and personal massagers for enhanced intimacy.

Request Free Sample

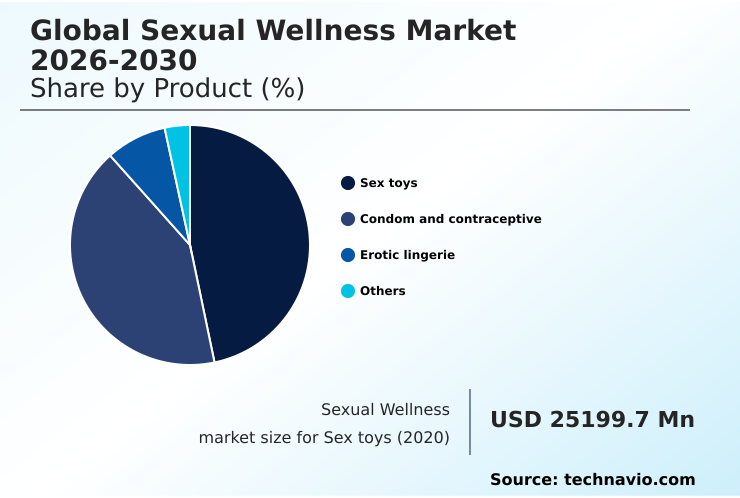
The Sex toys segment was valued at USD 39.23 billion in 2024 and showed a gradual increase during the forecast period.

Request Free Sample

Regional Analysis

North America is estimated to contribute 32.4% to the growth of the global market during the forecast period.Technavio’s analysts have elaborately explained the regional trends and drivers that shape the market during the forecast period.

See How Sexual Wellness Market Demand is Rising in North America Request Free Sample

The global sexual wellness market exhibits distinct regional dynamics, with market maturity and cultural attitudes dictating growth trajectories.

North America, accounting for 32.4% of the incremental growth, is a highly developed market driven by consumer sophistication and a focus on premium, tech-integrated products like smart wellness devices.

Europe is projected to expand at a robust 8.7%, fueled by a strong emphasis on sustainable wellness products and stringent regulatory standards.

In contrast, APAC is a region of rapid expansion, with a projected CAGR of 7.5%, where rising disposable incomes and the proliferation of digital retail channels are dismantling traditional barriers and boosting sexual health literacy.

This geographic variance necessitates tailored strategies, from marketing high-end pleasure devices in Western markets to focusing on accessible condoms and educational marketing in developing regions to foster a holistic wellness approach.

Market Dynamics

Our researchers analyzed the data with 2025 as the base year, along with the key drivers, trends, and challenges. A holistic analysis of drivers will help companies refine their marketing strategies to gain a competitive advantage.

  • Strategic positioning in the sexual wellness market increasingly hinges on leveraging long-tail opportunities that cater to specific consumer values and needs. The focus on eco-friendly materials in sexual wellness is no longer a niche but a significant differentiator, with brands that prioritize sustainable packaging for wellness products and biodegradable condoms building strong loyalty among environmentally conscious consumers.
  • Similarly, the integration of advanced haptic technology in sex toys and biometric sensors in smart wellness devices is creating new premium categories. Companies that master the impact of digital retail on sexual wellness through AI for personalized recommendations and effective marketing in conservative regions are outperforming competitors.
  • This specialization extends to addressing key life stages, with menopause and hormonal wellness solutions becoming a critical growth segment; companies in this space often see customer retention rates up to 15% higher than those in more commoditized categories.
  • Navigating the challenges of social media advertising policies and supply chain volatility for natural latex requires agility, but the rewards for developing innovative non-latex condom technology or products for the LGBTQ+ community and elderly populations are substantial, defining the next wave of market leaders.

What are the key market drivers leading to the rise in the adoption of Sexual Wellness Industry?

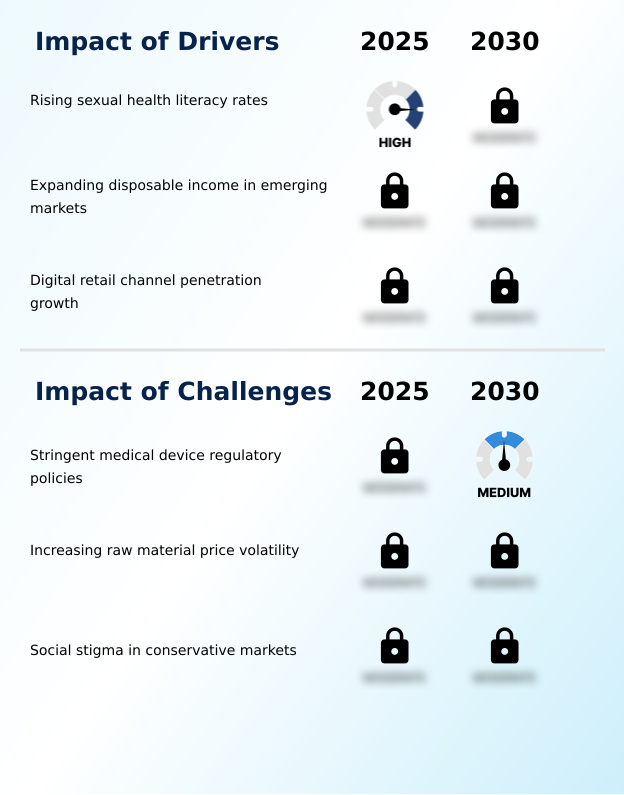
  • The primary market driver is the rise in sexual health literacy rates, which leads to more informed consumer choices and increased demand for wellness products.

  • Market growth is primarily fueled by a confluence of increased consumer knowledge and expanding access.
  • Rising sexual health literacy, amplified by digital platforms and educational marketing, is empowering consumers to make informed decisions, directly correlating with higher adoption rates for products like condoms and personal lubricants.
  • This educational push has helped reach over 500 million people in emerging markets.
  • Economically, the expansion of disposable income, with some developing nations seeing a 15% rise in households earning over a key threshold, allows for spending on premium items, including high-end sex toys.
  • The most significant driver remains the penetration of digital retail channels, which offer unparalleled privacy. The growth of online sales, seeing an approximate 20% year-on-year increase in some markets, underscores the channel's importance for both direct-to-consumer brands and established players.

What are the market trends shaping the Sexual Wellness Industry?

  • A significant market trend is the increasing adoption of sustainable and eco-friendly materials. This shift is driven by growing consumer consciousness regarding the environmental impact of products.

  • The sexual wellness market is being redefined by consumer-driven trends that prioritize health, sustainability, and technological integration. There is a significant shift toward sustainable wellness products, with consumers showing a preference for eco-friendly materials, leading to the development of biodegradable condoms and products with recycled packaging.
  • This trend has pushed manufacturers to innovate, with some achieving a 15% reduction in plastic use. Concurrently, the integration of advanced haptic technology and biometric feedback sensors in smart wellness devices is creating a more personalized and immersive user experience. These app-controlled devices, part of the growing teledildonics field, are particularly popular for enhancing long-distance intimacy.
  • Furthermore, the industry is expanding its focus to include previously underserved demographics, with a notable rise in menopause wellness products and hormonal health solutions designed to improve quality of life.

What challenges does the Sexual Wellness Industry face during its growth?

  • A key challenge affecting industry growth is the complex and stringent regulatory policies for products, particularly those classified as medical devices.

  • The sexual wellness market navigates a landscape of significant operational and regulatory hurdles. Stringent medical device regulations impose substantial burdens, with the cost of compliance having increased by over 25% for many firms, creating long lead times and high financial barriers, especially for smaller innovators.
  • Concurrently, increasing raw material price volatility presents a major challenge; fluctuations in natural latex prices have reached up to 20%, while silicone costs are also rising. These cost pressures are exacerbated by global supply chain disruptions, where maritime freight rates have surged by as much as 50% on key routes.
  • Finally, deep-seated social stigma in conservative markets remains a formidable barrier, limiting advertising opportunities and hindering market penetration, requiring companies to invest in long-term, culturally sensitive engagement strategies.

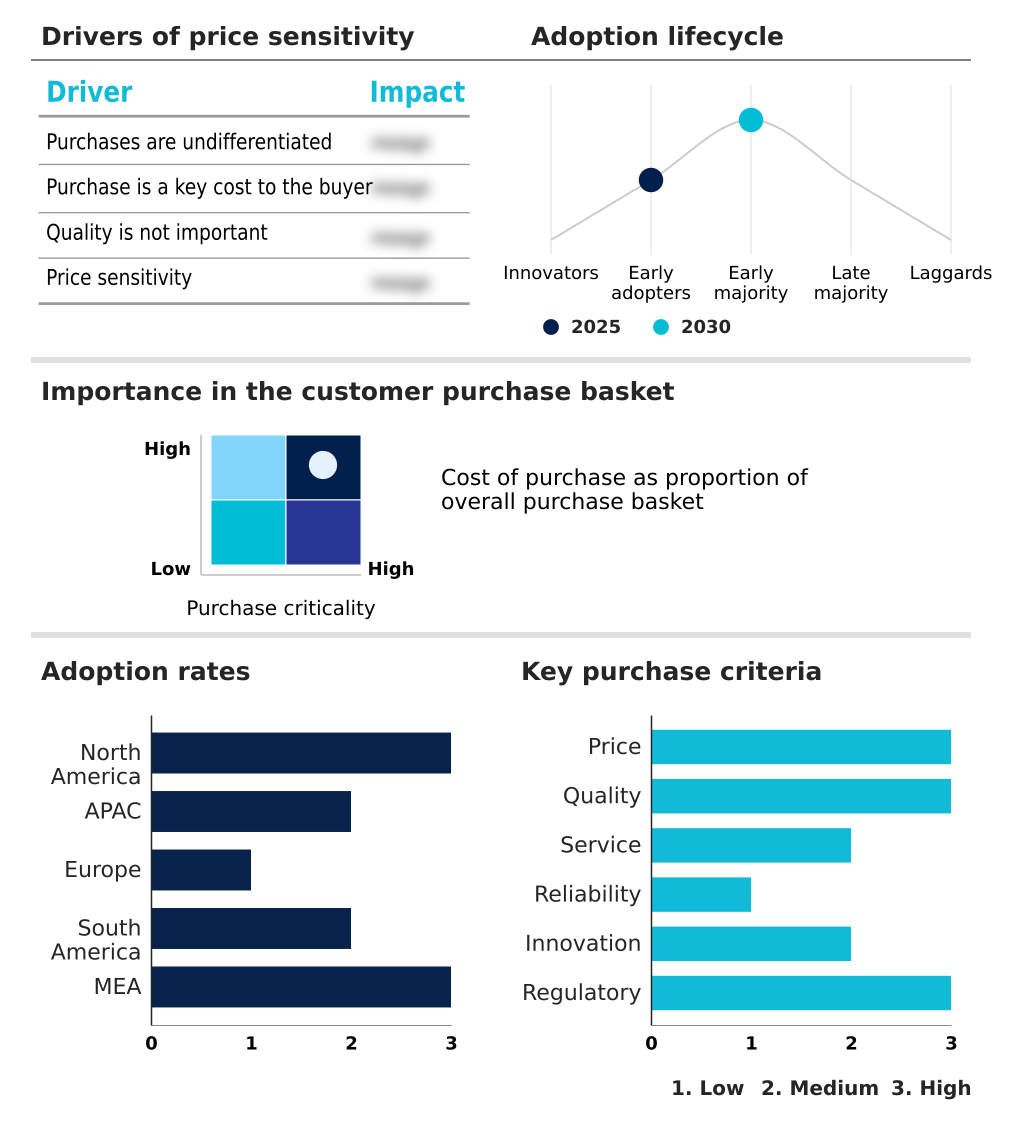
Exclusive Technavio Analysis on Customer Landscape

The sexual wellness market forecasting report includes the adoption lifecycle of the market, covering from the innovator’s stage to the laggard’s stage. It focuses on adoption rates in different regions based on penetration. Furthermore, the sexual wellness market report also includes key purchase criteria and drivers of price sensitivity to help companies evaluate and develop their market growth analysis strategies.

Customer Landscape of Sexual Wellness Industry

Competitive Landscape

Companies are implementing various strategies, such as strategic alliances, sexual wellness market forecast, partnerships, mergers and acquisitions, geographical expansion, and product/service launches, to enhance their presence in the industry.

Bad Dragon Enterprises Inc. - Offerings include a comprehensive portfolio of sexual wellness solutions, encompassing personal massagers and intimacy products designed to enhance user experience and overall well-being.

The industry research and growth report includes detailed analyses of the competitive landscape of the market and information about key companies, including:

  • Bad Dragon Enterprises Inc.
  • Bijoux Indiscrets S.L.
  • BMS Factory
  • Church and Dwight Co. Inc.
  • Doc Johnson Enterprises
  • Fun Factory GmbH
  • Good Clean Love Inc.
  • Hot Octopuss Ltd.
  • KESSEL medintim GmbH
  • LELOi AB
  • LifeStyles Healthcare Pte Ltd.
  • Lovehoney Group Ltd.
  • Mankind Pharma Ltd.
  • Maude Group Inc.
  • Mayer Laboratories Inc.
  • Okamoto Industries Inc.
  • Reckitt Benckiser Group Plc
  • TENGA Co. Ltd.
  • The Aneros Co.
  • The Kama Sutra Co.

Qualitative and quantitative analysis of companies has been conducted to help clients understand the wider business environment as well as the strengths and weaknesses of key industry players. Data is qualitatively analyzed to categorize companies as pure play, category-focused, industry-focused, and diversified; it is quantitatively analyzed to categorize companies as dominant, leading, strong, tentative, and weak.

Recent Development and News in Sexual wellness market

  • In May 2025, Doc Johnson Enterprises released a new line of intimate furniture designed for durability and discreet storage in residential settings, catering to a demographic that values long-term investments in their sexual lifestyle.
  • In March 2025, Mankind Pharma Ltd. expanded its range with ultra-thin variants and textured condoms to improve user experience while maintaining high safety standards, focusing on reaching rural and semi-urban markets.
  • In February 2025, Maude Group Inc. integrated a new AI-driven personal consultation tool into its e-commerce platform, allowing users to receive tailored product suggestions based on a private assessment of their wellness needs.
  • In January 2025, Hot Octopuss Ltd. unveiled a new generation of smart wellness devices featuring ultra-responsive haptic engines and enhanced privacy protocols to ensure secure data transmission between devices.

Dive into Technavio’s robust research methodology, blending expert interviews, extensive data synthesis, and validated models for unparalleled Sexual Wellness Market insights. See full methodology.

Market Scope
Page number 305
Base year 2025
Historic period 2020-2024
Forecast period 2026-2030
Growth momentum & CAGR Accelerate at a CAGR of 8.2%
Market growth 2026-2030 USD 43539.3 million
Market structure Fragmented
YoY growth 2025-2026(%) 7.7%
Key countries US, Canada, Mexico, China, Japan, India, South Korea, Australia, Indonesia, Germany, UK, France, Italy, Spain, The Netherlands, Brazil, Argentina, Colombia, UAE, Saudi Arabia, South Africa, Turkey and Israel
Competitive landscape Leading Companies, Market Positioning of Companies, Competitive Strategies, and Industry Risks

Request Free Sample

Research Analyst Overview

  • The sexual wellness market is evolving from a product-centric industry to a holistic ecosystem where education, technology, and personal well-being converge. This transformation is underpinned by innovations in body-safe materials like medical-grade silicone and advanced polymers, making pleasure devices such as personal massagers and prostate massagers safer and more effective.
  • A key trend compelling boardroom attention is the shift toward sustainability, with the demand for eco-friendly materials and biodegradable condoms influencing supply chain and R&D strategies. Brands that successfully integrate ESG principles into their operations, for instance, report a net promoter score up to 10% higher than their competitors.
  • The proliferation of app-controlled devices, intimate furniture, and wearable tech, often featuring haptic technology and non-toxic materials, demonstrates the market's trajectory toward personalized and tech-driven solutions. The market now encompasses everything from water-based lubricants and female-focused wellness products to sexual health supplements, creating a complex but opportunity-rich landscape for companies that prioritize innovation and consumer trust.

What are the Key Data Covered in this Sexual Wellness Market Research and Growth Report?

  • What is the expected growth of the Sexual Wellness Market between 2026 and 2030?

    • USD 43.54 billion, at a CAGR of 8.2%

  • What segmentation does the market report cover?

    • The report is segmented by Product (Sex toys, Condom and contraceptive, Erotic lingerie, Peronal lubricants, and Others), Distribution Channel (Offline, and Online), End-user (Men, Women, Couples, LGBTQ plus community, and Elderly) and Geography (North America, APAC, Europe, South America, Middle East and Africa)

  • Which regions are analyzed in the report?

    • North America, APAC, Europe, South America and Middle East and Africa

  • What are the key growth drivers and market challenges?

    • Rising sexual health literacy rates, Stringent medical device regulatory policies

  • Who are the major players in the Sexual Wellness Market?

    • Bad Dragon Enterprises Inc., Bijoux Indiscrets S.L., BMS Factory, Church and Dwight Co. Inc., Doc Johnson Enterprises, Fun Factory GmbH, Good Clean Love Inc., Hot Octopuss Ltd., KESSEL medintim GmbH, LELOi AB, LifeStyles Healthcare Pte Ltd., Lovehoney Group Ltd., Mankind Pharma Ltd., Maude Group Inc., Mayer Laboratories Inc., Okamoto Industries Inc., Reckitt Benckiser Group Plc, TENGA Co. Ltd., The Aneros Co. and The Kama Sutra Co.

Market Research Insights

  • The market's momentum is shaped by a dynamic interplay of growth drivers and operational hurdles. The expansion of digital retail channels has been transformative, with online sales in some emerging markets seeing year-on-year growth of approximately 20%, facilitated by discreet packaging solutions and personalized wellness recommendations that can increase average order values by up to 30%.
  • This digital boom provides a fertile ground for direct-to-consumer brands and fosters a holistic wellness approach. However, this growth is tempered by significant regulatory pressures, as the cost of compliance for products classified as medical devices has increased by over 25% for many companies.
  • This complex environment requires businesses to balance innovation and market access with rigorous adherence to clean labeling standards and safety protocols.

We can help! Our analysts can customize this sexual wellness market research report to meet your requirements.

Get in touch

1. Executive Summary

1.1 Market overview

Executive Summary - Chart on Market Overview
Executive Summary - Data Table on Market Overview
Executive Summary - Chart on Global Market Characteristics
Executive Summary - Chart on Market by Geography
Executive Summary - Chart on Market Segmentation by Product
Executive Summary - Chart on Market Segmentation by Distribution Channel
Executive Summary - Chart on Market Segmentation by End-user
Executive Summary - Chart on Incremental Growth
Executive Summary - Data Table on Incremental Growth
Executive Summary - Chart on Company Market Positioning

2. Technavio Analysis

2.1 Analysis of price sensitivity, lifecycle, customer purchase basket, adoption rates, and purchase criteria

2.2 Criticality of inputs and Factors of differentiation

Chart on Overview on criticality of inputs and factors of differentiation

2.3 Factors of disruption

Chart on Overview on factors of disruption

2.4 Impact of drivers and challenges

Chart on Impact of drivers and challenges in 2025 and 2030

3. Market Landscape

3.1 Market ecosystem

Chart on Parent Market
Data Table on - Parent Market

3.2 Market characteristics

Chart on Market characteristics analysis

3.3 Value chain analysis

Chart on Value chain analysis

4. Market Sizing

4.1 Market definition

Data Table on Offerings of companies included in the market definition

4.2 Market segment analysis

Market segments

4.3 Market size 2025

4.4 Market outlook: Forecast for 2025-2030

Chart on Global - Market size and forecast 2025-2030 ($ million)
Data Table on Global - Market size and forecast 2025-2030 ($ million)
Chart on Global Market: Year-over-year growth 2025-2030 (%)
Data Table on Global Market: Year-over-year growth 2025-2030 (%)

5. Historic Market Size

5.1 Global Sexual Wellness Market 2020 - 2024

Historic Market Size - Data Table on Global Sexual Wellness Market 2020 - 2024 ($ million)

5.2 Product segment analysis 2020 - 2024

Historic Market Size - Product Segment 2020 - 2024 ($ million)

5.3 Distribution Channel segment analysis 2020 - 2024

Historic Market Size - Distribution Channel Segment 2020 - 2024 ($ million)

5.4 End-user segment analysis 2020 - 2024

Historic Market Size - End-user Segment 2020 - 2024 ($ million)

5.5 Geography segment analysis 2020 - 2024

Historic Market Size - Geography Segment 2020 - 2024 ($ million)

5.6 Country segment analysis 2020 - 2024

Historic Market Size - Country Segment 2020 - 2024 ($ million)

6. Qualitative Analysis

6.1 Impact of AI on Global Sexual Wellness Market

6.2 Impact of Geopolitical Conflicts on Global Sexual Wellness Market

7. Five Forces Analysis

7.1 Five forces summary

Five forces analysis - Comparison between 2025 and 2030

7.2 Bargaining power of buyers

Bargaining power of buyers - Impact of key factors 2025 and 2030

7.3 Bargaining power of suppliers

Bargaining power of suppliers - Impact of key factors in 2025 and 2030

7.4 Threat of new entrants

Threat of new entrants - Impact of key factors in 2025 and 2030

7.5 Threat of substitutes

Threat of substitutes - Impact of key factors in 2025 and 2030

7.6 Threat of rivalry

Threat of rivalry - Impact of key factors in 2025 and 2030

7.7 Market condition

Chart on Market condition - Five forces 2025 and 2030

8. Market Segmentation by Product

8.1 Market segments

Chart on Product - Market share 2025-2030 (%)
Data Table on Product - Market share 2025-2030 (%)

8.2 Comparison by Product

Chart on Comparison by Product
Data Table on Comparison by Product

8.3 Sex toys - Market size and forecast 2025-2030

Chart on Sex toys - Market size and forecast 2025-2030 ($ million)
Data Table on Sex toys - Market size and forecast 2025-2030 ($ million)
Chart on Sex toys - Year-over-year growth 2025-2030 (%)
Data Table on Sex toys - Year-over-year growth 2025-2030 (%)

8.4 Condom and contraceptive - Market size and forecast 2025-2030

Chart on Condom and contraceptive - Market size and forecast 2025-2030 ($ million)
Data Table on Condom and contraceptive - Market size and forecast 2025-2030 ($ million)
Chart on Condom and contraceptive - Year-over-year growth 2025-2030 (%)
Data Table on Condom and contraceptive - Year-over-year growth 2025-2030 (%)

8.5 Erotic lingerie - Market size and forecast 2025-2030

Chart on Erotic lingerie - Market size and forecast 2025-2030 ($ million)
Data Table on Erotic lingerie - Market size and forecast 2025-2030 ($ million)
Chart on Erotic lingerie - Year-over-year growth 2025-2030 (%)
Data Table on Erotic lingerie - Year-over-year growth 2025-2030 (%)

8.6 Personal lubricants - Market size and forecast 2025-2030

Chart on Personal lubricants - Market size and forecast 2025-2030 ($ million)
Data Table on Personal lubricants - Market size and forecast 2025-2030 ($ million)
Chart on Personal lubricants - Year-over-year growth 2025-2030 (%)
Data Table on Personal lubricants - Year-over-year growth 2025-2030 (%)

8.7 Others - Market size and forecast 2025-2030

Chart on Others - Market size and forecast 2025-2030 ($ million)
Data Table on Others - Market size and forecast 2025-2030 ($ million)
Chart on Others - Year-over-year growth 2025-2030 (%)
Data Table on Others - Year-over-year growth 2025-2030 (%)

8.8 Market opportunity by Product

Market opportunity by Product ($ million)
Data Table on Market opportunity by Product ($ million)

9. Market Segmentation by Distribution Channel

9.1 Market segments

Chart on Distribution Channel - Market share 2025-2030 (%)
Data Table on Distribution Channel - Market share 2025-2030 (%)

9.2 Comparison by Distribution Channel

Chart on Comparison by Distribution Channel
Data Table on Comparison by Distribution Channel

9.3 Offline - Market size and forecast 2025-2030

Chart on Offline - Market size and forecast 2025-2030 ($ million)
Data Table on Offline - Market size and forecast 2025-2030 ($ million)
Chart on Offline - Year-over-year growth 2025-2030 (%)
Data Table on Offline - Year-over-year growth 2025-2030 (%)

9.4 Online - Market size and forecast 2025-2030

Chart on Online - Market size and forecast 2025-2030 ($ million)
Data Table on Online - Market size and forecast 2025-2030 ($ million)
Chart on Online - Year-over-year growth 2025-2030 (%)
Data Table on Online - Year-over-year growth 2025-2030 (%)

9.5 Market opportunity by Distribution Channel

Market opportunity by Distribution Channel ($ million)
Data Table on Market opportunity by Distribution Channel ($ million)

10. Market Segmentation by End-user

10.1 Market segments

Chart on End-user - Market share 2025-2030 (%)
Data Table on End-user - Market share 2025-2030 (%)

10.2 Comparison by End-user

Chart on Comparison by End-user
Data Table on Comparison by End-user

10.3 Men - Market size and forecast 2025-2030

Chart on Men - Market size and forecast 2025-2030 ($ million)
Data Table on Men - Market size and forecast 2025-2030 ($ million)
Chart on Men - Year-over-year growth 2025-2030 (%)
Data Table on Men - Year-over-year growth 2025-2030 (%)

10.4 Women - Market size and forecast 2025-2030

Chart on Women - Market size and forecast 2025-2030 ($ million)
Data Table on Women - Market size and forecast 2025-2030 ($ million)
Chart on Women - Year-over-year growth 2025-2030 (%)
Data Table on Women - Year-over-year growth 2025-2030 (%)

10.5 Couples - Market size and forecast 2025-2030

Chart on Couples - Market size and forecast 2025-2030 ($ million)
Data Table on Couples - Market size and forecast 2025-2030 ($ million)
Chart on Couples - Year-over-year growth 2025-2030 (%)
Data Table on Couples - Year-over-year growth 2025-2030 (%)

10.6 LGBTQ plus community - Market size and forecast 2025-2030

Chart on LGBTQ plus community - Market size and forecast 2025-2030 ($ million)
Data Table on LGBTQ plus community - Market size and forecast 2025-2030 ($ million)
Chart on LGBTQ plus community - Year-over-year growth 2025-2030 (%)
Data Table on LGBTQ plus community - Year-over-year growth 2025-2030 (%)

10.7 Elderly - Market size and forecast 2025-2030

Chart on Elderly - Market size and forecast 2025-2030 ($ million)
Data Table on Elderly - Market size and forecast 2025-2030 ($ million)
Chart on Elderly - Year-over-year growth 2025-2030 (%)
Data Table on Elderly - Year-over-year growth 2025-2030 (%)

10.8 Market opportunity by End-user

Market opportunity by End-user ($ million)
Data Table on Market opportunity by End-user ($ million)

11. Customer Landscape

11.1 Customer landscape overview

Analysis of price sensitivity, lifecycle, customer purchase basket, adoption rates, and purchase criteria

12. Geographic Landscape

12.1 Geographic segmentation

Chart on Market share by geography 2025-2030 (%)
Data Table on Market share by geography 2025-2030 (%)

12.2 Geographic comparison

Chart on Geographic comparison
Data Table on Geographic comparison

12.3 North America - Market size and forecast 2025-2030

Chart on North America - Market size and forecast 2025-2030 ($ million)
Data Table on North America - Market size and forecast 2025-2030 ($ million)
Chart on North America - Year-over-year growth 2025-2030 (%)
Data Table on North America - Year-over-year growth 2025-2030 (%)
Chart on Regional Comparison - North America
Data Table on Regional Comparison - North America

12.3.1 US - Market size and forecast 2025-2030

Chart on US - Market size and forecast 2025-2030 ($ million)
Data Table on US - Market size and forecast 2025-2030 ($ million)
Chart on US - Year-over-year growth 2025-2030 (%)
Data Table on US - Year-over-year growth 2025-2030 (%)

12.3.2 Canada - Market size and forecast 2025-2030

Chart on Canada - Market size and forecast 2025-2030 ($ million)
Data Table on Canada - Market size and forecast 2025-2030 ($ million)
Chart on Canada - Year-over-year growth 2025-2030 (%)
Data Table on Canada - Year-over-year growth 2025-2030 (%)

12.3.3 Mexico - Market size and forecast 2025-2030

Chart on Mexico - Market size and forecast 2025-2030 ($ million)
Data Table on Mexico - Market size and forecast 2025-2030 ($ million)
Chart on Mexico - Year-over-year growth 2025-2030 (%)
Data Table on Mexico - Year-over-year growth 2025-2030 (%)

12.4 APAC - Market size and forecast 2025-2030

Chart on APAC - Market size and forecast 2025-2030 ($ million)
Data Table on APAC - Market size and forecast 2025-2030 ($ million)
Chart on APAC - Year-over-year growth 2025-2030 (%)
Data Table on APAC - Year-over-year growth 2025-2030 (%)
Chart on Regional Comparison - APAC
Data Table on Regional Comparison - APAC

12.4.1 China - Market size and forecast 2025-2030

Chart on China - Market size and forecast 2025-2030 ($ million)
Data Table on China - Market size and forecast 2025-2030 ($ million)
Chart on China - Year-over-year growth 2025-2030 (%)
Data Table on China - Year-over-year growth 2025-2030 (%)

12.4.2 Japan - Market size and forecast 2025-2030

Chart on Japan - Market size and forecast 2025-2030 ($ million)
Data Table on Japan - Market size and forecast 2025-2030 ($ million)
Chart on Japan - Year-over-year growth 2025-2030 (%)
Data Table on Japan - Year-over-year growth 2025-2030 (%)

12.4.3 India - Market size and forecast 2025-2030

Chart on India - Market size and forecast 2025-2030 ($ million)
Data Table on India - Market size and forecast 2025-2030 ($ million)
Chart on India - Year-over-year growth 2025-2030 (%)
Data Table on India - Year-over-year growth 2025-2030 (%)

12.4.4 South Korea - Market size and forecast 2025-2030

Chart on South Korea - Market size and forecast 2025-2030 ($ million)
Data Table on South Korea - Market size and forecast 2025-2030 ($ million)
Chart on South Korea - Year-over-year growth 2025-2030 (%)
Data Table on South Korea - Year-over-year growth 2025-2030 (%)

12.4.5 Australia - Market size and forecast 2025-2030

Chart on Australia - Market size and forecast 2025-2030 ($ million)
Data Table on Australia - Market size and forecast 2025-2030 ($ million)
Chart on Australia - Year-over-year growth 2025-2030 (%)
Data Table on Australia - Year-over-year growth 2025-2030 (%)

12.4.6 Indonesia - Market size and forecast 2025-2030

Chart on Indonesia - Market size and forecast 2025-2030 ($ million)
Data Table on Indonesia - Market size and forecast 2025-2030 ($ million)
Chart on Indonesia - Year-over-year growth 2025-2030 (%)
Data Table on Indonesia - Year-over-year growth 2025-2030 (%)

12.5 Europe - Market size and forecast 2025-2030

Chart on Europe - Market size and forecast 2025-2030 ($ million)
Data Table on Europe - Market size and forecast 2025-2030 ($ million)
Chart on Europe - Year-over-year growth 2025-2030 (%)
Data Table on Europe - Year-over-year growth 2025-2030 (%)
Chart on Regional Comparison - Europe
Data Table on Regional Comparison - Europe

12.5.1 Germany - Market size and forecast 2025-2030

Chart on Germany - Market size and forecast 2025-2030 ($ million)
Data Table on Germany - Market size and forecast 2025-2030 ($ million)
Chart on Germany - Year-over-year growth 2025-2030 (%)
Data Table on Germany - Year-over-year growth 2025-2030 (%)

12.5.2 UK - Market size and forecast 2025-2030

Chart on UK - Market size and forecast 2025-2030 ($ million)
Data Table on UK - Market size and forecast 2025-2030 ($ million)
Chart on UK - Year-over-year growth 2025-2030 (%)
Data Table on UK - Year-over-year growth 2025-2030 (%)

12.5.3 France - Market size and forecast 2025-2030

Chart on France - Market size and forecast 2025-2030 ($ million)
Data Table on France - Market size and forecast 2025-2030 ($ million)
Chart on France - Year-over-year growth 2025-2030 (%)
Data Table on France - Year-over-year growth 2025-2030 (%)

12.5.4 Italy - Market size and forecast 2025-2030

Chart on Italy - Market size and forecast 2025-2030 ($ million)
Data Table on Italy - Market size and forecast 2025-2030 ($ million)
Chart on Italy - Year-over-year growth 2025-2030 (%)
Data Table on Italy - Year-over-year growth 2025-2030 (%)

12.5.5 Spain - Market size and forecast 2025-2030

Chart on Spain - Market size and forecast 2025-2030 ($ million)
Data Table on Spain - Market size and forecast 2025-2030 ($ million)
Chart on Spain - Year-over-year growth 2025-2030 (%)
Data Table on Spain - Year-over-year growth 2025-2030 (%)

12.5.6 The Netherlands - Market size and forecast 2025-2030

Chart on The Netherlands - Market size and forecast 2025-2030 ($ million)
Data Table on The Netherlands - Market size and forecast 2025-2030 ($ million)
Chart on The Netherlands - Year-over-year growth 2025-2030 (%)
Data Table on The Netherlands - Year-over-year growth 2025-2030 (%)

12.6 South America - Market size and forecast 2025-2030

Chart on South America - Market size and forecast 2025-2030 ($ million)
Data Table on South America - Market size and forecast 2025-2030 ($ million)
Chart on South America - Year-over-year growth 2025-2030 (%)
Data Table on South America - Year-over-year growth 2025-2030 (%)
Chart on Regional Comparison - South America
Data Table on Regional Comparison - South America

12.6.1 Brazil - Market size and forecast 2025-2030

Chart on Brazil - Market size and forecast 2025-2030 ($ million)
Data Table on Brazil - Market size and forecast 2025-2030 ($ million)
Chart on Brazil - Year-over-year growth 2025-2030 (%)
Data Table on Brazil - Year-over-year growth 2025-2030 (%)

12.6.2 Argentina - Market size and forecast 2025-2030

Chart on Argentina - Market size and forecast 2025-2030 ($ million)
Data Table on Argentina - Market size and forecast 2025-2030 ($ million)
Chart on Argentina - Year-over-year growth 2025-2030 (%)
Data Table on Argentina - Year-over-year growth 2025-2030 (%)

12.6.3 Colombia - Market size and forecast 2025-2030

Chart on Colombia - Market size and forecast 2025-2030 ($ million)
Data Table on Colombia - Market size and forecast 2025-2030 ($ million)
Chart on Colombia - Year-over-year growth 2025-2030 (%)
Data Table on Colombia - Year-over-year growth 2025-2030 (%)

12.7 Middle East and Africa - Market size and forecast 2025-2030

Chart on Middle East and Africa - Market size and forecast 2025-2030 ($ million)
Data Table on Middle East and Africa - Market size and forecast 2025-2030 ($ million)
Chart on Middle East and Africa - Year-over-year growth 2025-2030 (%)
Data Table on Middle East and Africa - Year-over-year growth 2025-2030 (%)
Chart on Regional Comparison - Middle East and Africa
Data Table on Regional Comparison - Middle East and Africa

12.7.1 UAE - Market size and forecast 2025-2030

Chart on UAE - Market size and forecast 2025-2030 ($ million)
Data Table on UAE - Market size and forecast 2025-2030 ($ million)
Chart on UAE - Year-over-year growth 2025-2030 (%)
Data Table on UAE - Year-over-year growth 2025-2030 (%)

12.7.2 Saudi Arabia - Market size and forecast 2025-2030

Chart on Saudi Arabia - Market size and forecast 2025-2030 ($ million)
Data Table on Saudi Arabia - Market size and forecast 2025-2030 ($ million)
Chart on Saudi Arabia - Year-over-year growth 2025-2030 (%)
Data Table on Saudi Arabia - Year-over-year growth 2025-2030 (%)

12.7.3 South Africa - Market size and forecast 2025-2030

Chart on South Africa - Market size and forecast 2025-2030 ($ million)
Data Table on South Africa - Market size and forecast 2025-2030 ($ million)
Chart on South Africa - Year-over-year growth 2025-2030 (%)
Data Table on South Africa - Year-over-year growth 2025-2030 (%)

12.7.4 Turkey - Market size and forecast 2025-2030

Chart on Turkey - Market size and forecast 2025-2030 ($ million)
Data Table on Turkey - Market size and forecast 2025-2030 ($ million)
Chart on Turkey - Year-over-year growth 2025-2030 (%)
Data Table on Turkey - Year-over-year growth 2025-2030 (%)

12.7.5 Israel - Market size and forecast 2025-2030

Chart on Israel - Market size and forecast 2025-2030 ($ million)
Data Table on Israel - Market size and forecast 2025-2030 ($ million)
Chart on Israel - Year-over-year growth 2025-2030 (%)
Data Table on Israel - Year-over-year growth 2025-2030 (%)

12.8 Market opportunity by geography

Market opportunity by geography ($ million)
Data Tables on Market opportunity by geography ($ million)

13. Drivers, Challenges, and Opportunity

13.1 Market drivers

Rising sexual health literacy rates
Expanding disposable income in emerging markets
Digital retail channel penetration growth

13.2 Market challenges

Stringent medical device regulatory policies
Increasing raw material price volatility
Social stigma in conservative markets

13.3 Impact of drivers and challenges

Impact of drivers and challenges in 2025 and 2030

13.4 Market opportunities

Sustainable eco-friendly material adoption
Advanced haptic and connectivity integration
Menopause and hormonal wellness focus

14. Competitive Landscape

14.1 Overview

14.2

Overview on criticality of inputs and factors of differentiation

14.3 Landscape disruption

Overview on factors of disruption

14.4 Industry risks

Impact of key risks on business

15. Competitive Analysis

15.1 Companies profiled

Companies covered

15.2 Company ranking index

15.3 Market positioning of companies

Matrix on companies position and classification

15.4 Bad Dragon Enterprises Inc.

Bad Dragon Enterprises Inc. - Overview
Bad Dragon Enterprises Inc. - Product / Service
Bad Dragon Enterprises Inc. - Key offerings
SWOT

15.5 Bijoux Indiscrets S.L.

Bijoux Indiscrets S.L. - Overview
Bijoux Indiscrets S.L. - Product / Service
Bijoux Indiscrets S.L. - Key offerings
SWOT

15.6 BMS Factory

BMS Factory - Overview
BMS Factory - Product / Service
BMS Factory - Key offerings
SWOT

15.7 Church and Dwight Co. Inc.

Church and Dwight Co. Inc. - Overview
Church and Dwight Co. Inc. - Business segments
Church and Dwight Co. Inc. - Key offerings
Church and Dwight Co. Inc. - Segment focus
SWOT

15.8 Doc Johnson Enterprises

Doc Johnson Enterprises - Overview
Doc Johnson Enterprises - Product / Service
Doc Johnson Enterprises - Key offerings
SWOT

15.9 Good Clean Love Inc.

Good Clean Love Inc. - Overview
Good Clean Love Inc. - Product / Service
Good Clean Love Inc. - Key offerings
SWOT

15.10 Hot Octopuss Ltd.

Hot Octopuss Ltd. - Overview
Hot Octopuss Ltd. - Product / Service
Hot Octopuss Ltd. - Key offerings
SWOT

15.11 KESSEL medintim GmbH

KESSEL medintim GmbH - Overview
KESSEL medintim GmbH - Product / Service
KESSEL medintim GmbH - Key offerings
SWOT

15.12 LELOi AB

LELOi AB - Overview
LELOi AB - Product / Service
LELOi AB - Key offerings
SWOT

15.13 LifeStyles Healthcare Pte Ltd.

LifeStyles Healthcare Pte Ltd. - Overview
LifeStyles Healthcare Pte Ltd. - Product / Service
LifeStyles Healthcare Pte Ltd. - Key offerings
SWOT

15.14 Lovehoney Group Ltd.

Lovehoney Group Ltd. - Overview
Lovehoney Group Ltd. - Product / Service
Lovehoney Group Ltd. - Key offerings
SWOT

15.15 Mankind Pharma Ltd.

Mankind Pharma Ltd. - Overview
Mankind Pharma Ltd. - Business segments
Mankind Pharma Ltd. - Key offerings
Mankind Pharma Ltd. - Segment focus
SWOT

15.16 Okamoto Industries Inc.

Okamoto Industries Inc. - Overview
Okamoto Industries Inc. - Business segments
Okamoto Industries Inc. - Key offerings
Okamoto Industries Inc. - Segment focus
SWOT

15.17 Reckitt Benckiser Group Plc

Reckitt Benckiser Group Plc - Overview
Reckitt Benckiser Group Plc - Business segments
Reckitt Benckiser Group Plc - Key news
Reckitt Benckiser Group Plc - Key offerings
Reckitt Benckiser Group Plc - Segment focus
SWOT

15.18 TENGA Co. Ltd.

TENGA Co. Ltd. - Overview
TENGA Co. Ltd. - Product / Service
TENGA Co. Ltd. - Key offerings
SWOT

16. Appendix

16.1 Scope of the report

Market definition
Objectives
Notes and caveats

16.2 Inclusions and exclusions checklist

Inclusions checklist
Exclusions checklist

16.3 Currency conversion rates for US$

16.4 Research methodology

16.5 Data procurement

Information sources

16.6 Data validation

16.7 Validation techniques employed for market sizing

16.8 Data synthesis

16.9 360 degree market analysis

16.10 List of abbreviations

Research Methodology

Technavio presents a detailed picture of the market by way of study, synthesis, and summation of data from multiple sources. The analysts have presented the various facets of the market with a particular focus on identifying the key industry influencers. The data thus presented is comprehensive, reliable, and the result of extensive research, both primary and secondary.

INFORMATION SOURCES

Primary sources

  • Manufacturers and suppliers
  • Channel partners
  • Industry experts
  • Strategic decision makers

Secondary sources

  • Industry journals and periodicals
  • Government data
  • Financial reports of key industry players
  • Historical data
  • Press releases

DATA ANALYSIS

Data Synthesis

  • Collation of data
  • Estimation of key figures
  • Analysis of derived insights

Data Validation

  • Triangulation with data models
  • Reference against proprietary databases
  • Corroboration with industry experts

REPORT WRITING

Qualitative

  • Market drivers
  • Market challenges
  • Market trends
  • Five forces analysis

Quantitative

  • Market size and forecast
  • Market segmentation
  • Geographical insights
  • Competitive landscape

Interested in this report?

Get your sample now to see our research methodology and insights!

Download Now

Frequently Asked Questions

Sexual Wellness market growth will increase by USD 43539.3 million during 2026-2030.

The Sexual Wellness market is expected to grow at a CAGR of 8.2% during 2026-2030.

Sexual Wellness market is segmented by Product (Sex toys, Condom and contraceptive, Erotic lingerie, Personal lubricants, Others) Distribution channel (Offline, Online) End-user (Men, Women, Couples, LGBTQ plus community, Elderly)

Bad Dragon Enterprises Inc., Bijoux Indiscrets S.L., BMS Factory, Church and Dwight Co. Inc., Doc Johnson Enterprises, Fun Factory GmbH, Good Clean Love Inc., Hot Octopuss Ltd., KESSEL medintim GmbH, LELOi AB, LifeStyles Healthcare Pte Ltd., Lovehoney Group Ltd., Mankind Pharma Ltd., Maude Group Inc., Mayer Laboratories Inc., Okamoto Industries Inc., Reckitt Benckiser Group Plc, TENGA Co. Ltd., The Aneros Co., The Kama Sutra Co. are a few of the key vendors in the Sexual Wellness market.

North America will register the highest growth rate of 32.4% among the other regions. Therefore, the Sexual Wellness market in North America is expected to garner significant business opportunities for the vendors during the forecast period.

US, Canada, Mexico, China, Japan, India, South Korea, Australia, Indonesia, Germany, UK, France, Italy, Spain, The Netherlands, Brazil, Argentina, Colombia, UAE, Saudi Arabia, South Africa, Turkey, Israel

  • Rising sexual health literacy rates is the driving factor this market.

The Sexual Wellness market vendors should focus on grabbing business opportunities from the Product segment as it accounted for the largest market share in the base year.
RIA - Research AI Assistant
Ask RIA