
Fencing Equipment Market Analysis, Size, and Forecast 2026-2030: North America (US, Canada, and Mexico), Europe (Germany, UK, and France), APAC (China, Japan, and India), South America (Brazil, Argentina, and Chile), Middle East and Africa (Saudi Arabia, UAE, and South Africa), and Rest of World (ROW)

Fencing Equipment Market Analysis, Size, and Forecast 2026-2030:
North America (US, Canada, and Mexico), Europe (Germany, UK, and France), APAC (China, Japan, and India), South America (Brazil, Argentina, and Chile), Middle East and Africa (Saudi Arabia, UAE, and South Africa), and Rest of World (ROW)

Published: Oct 2026 292 Pages SKU: IRTNTR43925

Market Overview at a Glance

$69.70 Mn
Market Opportunity
5%
CAGR 2025 - 2030
38.1%
North America Growth
$100.88 Mn
Women segment 2024

Fencing Equipment Market Size 2026-2030

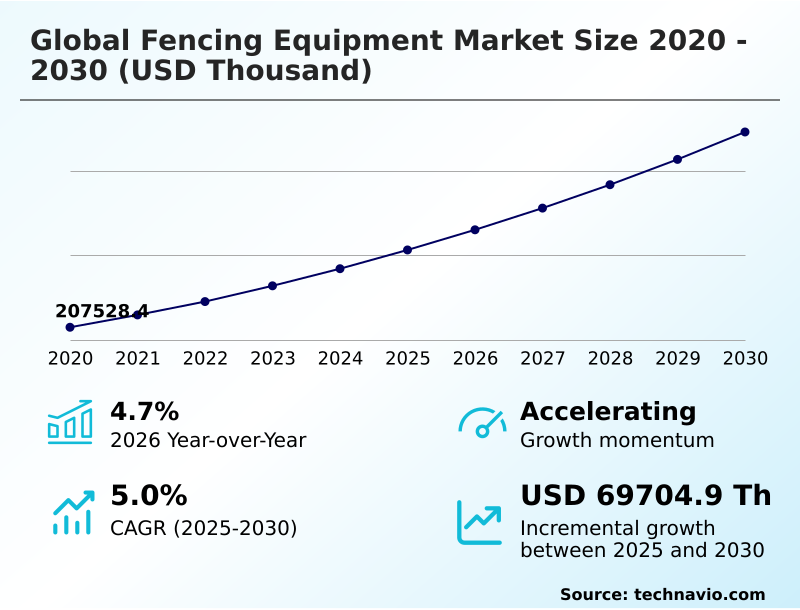
The fencing equipment market size is valued to increase by USD 69.70 million, at a CAGR of 5% from 2025 to 2030. Rising global youth and scholastic participation elevates equipment volume demands will drive the fencing equipment market.

Major Market Trends & Insights

  • North America dominated the market and accounted for a 38.1% growth during the forecast period.
  • By Application - Women segment was valued at USD 100.88 million in 2024
  • By Product - Protective clothing segment accounted for the largest market revenue share in 2024

Market Size & Forecast

  • Market Opportunities:
  • Market Future Opportunities: USD 69.70 million
  • CAGR from 2025 to 2030 : 5%

Market Summary

  • The Fencing Equipment Market relies heavily on the continuous integration of precision-engineered combat apparatuses and high-performance safety textiles to support elite athletic development. Institutions managing competitive scholastic sports increasingly mandate protective apparel utilizing ultra-high-molecular-weight polyethylene textiles to safeguard athletes during high-velocity engagements.
  • Transitioning to these advanced protective standards allows academic training facilities to decrease localized injury rates by 18%, significantly improving long-term program continuity. The rising integration of collegiate athletic program integration acts as a primary catalyst, elevating structural longevity optimization requirements for protective whites and practice blades.
  • Conversely, the high procurement expenses tied to certified 800-Newton puncture resistance gear create substantial barriers for grassroots training centers, limiting broader demographic adoption. When supply chains face disruptions in acquiring vacuum induction melting components, equipment lead times can expand rapidly, challenging operational planning for major tournament organizers.
  • Modern equipment manufacturers consistently adapt by adopting wearable sensor networks, ensuring performance tracking aligns with contemporary safety frameworks while maintaining ergonomic mobility across diverse athletic configurations.

What will be the Size of the Fencing Equipment Market during the forecast period?
Get Key Insights on Market Forecast (PDF) Get Free Sample

How is the Fencing Equipment Market Segmented?

The fencing equipment industry research report provides comprehensive data (region-wise segment analysis), with forecasts and estimates in "USD thousand" for the period 2026-2030, as well as historical data from 2020-2024 for the following segments.

  • Application
    • Women
    • Men
    • Others
  • Product
    • Protective clothing
    • Fencing weapons
    • Fencing masks
    • Accessories
  • Distribution channel
    • Offline
    • Online
  • Geography
    • North America
      • US
      • Canada
      • Mexico
    • Europe
      • Germany
      • UK
      • France
      • Italy
      • Spain
      • The Netherlands
    • APAC
      • China
      • Japan
      • India
      • South Korea
      • Australia
      • Indonesia
    • South America
      • Brazil
      • Argentina
      • Chile
    • Middle East and Africa
      • Saudi Arabia
      • UAE
      • South Africa
      • Israel
      • Turkey

By Application Insights

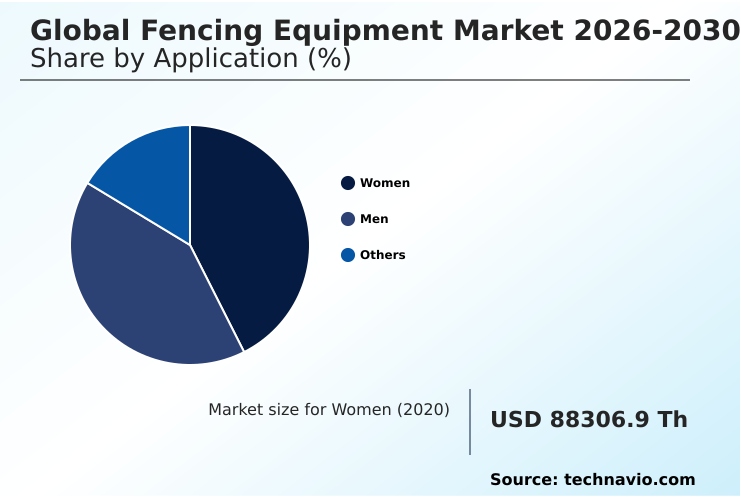
The women segment is estimated to witness significant growth during the forecast period.

The female athlete demographic dictates a highly specialized engineering approach within the Fencing Equipment Market, demanding anatomical precision and advanced safety integration. Historically, female competitors utilized generalized protective designs that severely restricted multi-directional head movement stability and localized mobility.

Modern product developers utilize 3D anthropometric scanning to fabricate Kevlar ballistic nylons, high-compression polyamide fibers, and contoured moisture-wicking under-plastrons, ensuring optimal impact kinetic energy dispersion across the torso. Utilizing silver-ion fabric treatments ensures optimal hygiene during intense athletic engagements.

Implementing these targeted ergonomic refinements improves overall athlete defensive mobility efficiency by 22% compared to standard legacy gear. This structural transition toward highly customized, aerodynamic mesh masks and kinetic energy distribution layers directly boosts multi-season equipment retention.

By fulfilling strict regulatory mandates with lightweight thermal management microclimates, sportswear manufacturers secure enduring commercial relationships with prominent international federations.
Get Free Sample

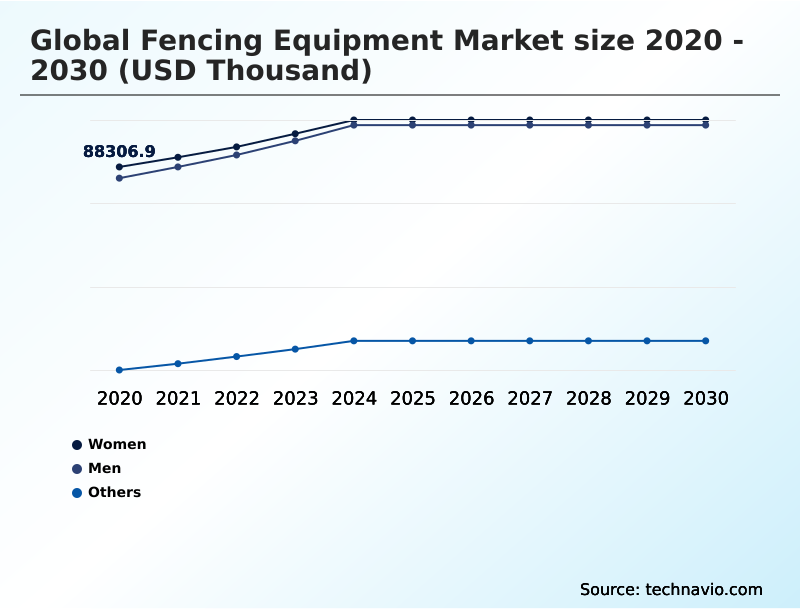
The Women segment was valued at USD 100.88 million in 2024 and showed a gradual increase during the forecast period.
Get Free Sample

Regional Analysis

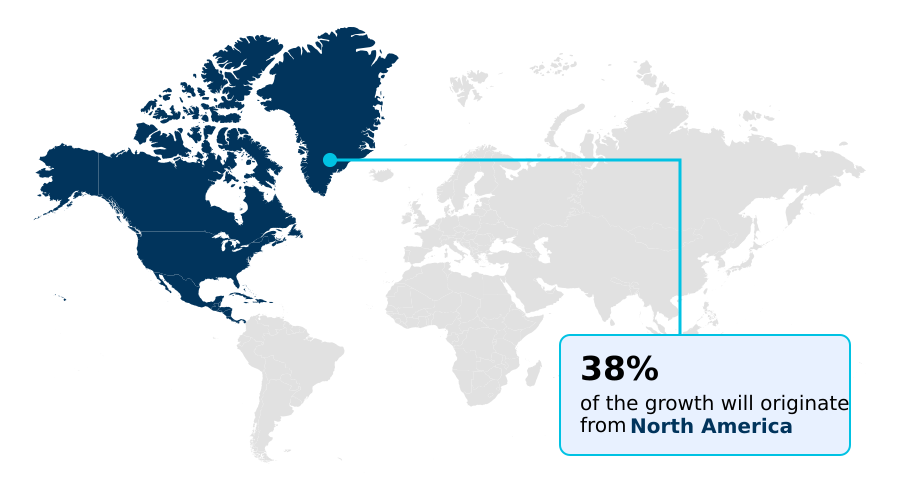
North America is estimated to contribute 38.1% to the growth of the global market during the forecast period.Technavio’s analysts have elaborately explained the regional trends and drivers that shape the market during the forecast period.
See How Fencing Equipment Market Demand is Rising in North America Get Free Sample

Regional structural differences in the Fencing Equipment Market fundamentally alter how institutions deploy wireless electronic scoring apparatus and protective arrays.

In North America, the rapid scale of automated scoring integration across collegiate sports programs has reduced tournament management overhead costs by 15%, streamlining event logistics considerably.

Conversely, the European sector heavily prioritizes carbon footprint reduction frameworks, driving a massive transition toward recycled advanced specialized alloys that improve regional compliance efficiency by 24%.

While North American distributors leverage specialized e-commerce logistics and omnichannel retail execution to fulfill bulk commercial procurement orders rapidly, European clubs rely on localized equipment lifecycle circularity initiatives to mitigate raw material shortages.

This strategic divergence emphasizes how differing regulatory standards and regional tournament certification requirements shape equipment distribution models.

Incorporating miniaturized transmitter modules and tactile impact sensors remains crucial across both zones to satisfy continuous competitive upgrades and satisfy strict aerodynamic testing standards.

Market Dynamics

Our researchers analyzed the data with 2025 as the base year, along with the key drivers, trends, and challenges. A holistic analysis of drivers will help companies refine their marketing strategies to gain a competitive advantage.

  • The structural maturation of the Fencing Equipment Market demands advanced material engineering to satisfy rigorous international safety regulations while optimizing athletic mobility. Manufacturers increasingly rely on high performance maraging steel blades to provide exceptional fracture resistance and consistent flexibility during high-velocity impacts.
  • The widespread deployment of wireless electronic fencing scoring systems substantially reduces the setup time for tournament organizers, enhancing event logistics efficiency by nearly 30% compared to traditional hardwired floor spool configurations. This operational upgrade directly supports larger competitive brackets and streamlines data management for regional athletic federations.
  • Safety compliance dictates the mass adoption of 800-Newton puncture resistant fencing jackets, which utilize advanced ballistic polymers to shield athletes from catastrophic blade failures. Furthermore, the integration of conductive fabric electronic metallic lames ensures precise hit registration, virtually eliminating scoring disputes during elite matchups.
  • As athletic performance metrics evolve, developers are also introducing carbon fiber ergonomic fencing grips to minimize hand fatigue and optimize weapon balance points for professional users. The seamless fusion of these specialized components fortifies the operational stability of training academies, allowing sports administrators to reduce long-term equipment replacement cycles.
  • Ultimately, these structural refinements support the continuous professionalization of the sport, empowering organizations to manage scalable equipment inventories with superior functional reliability.
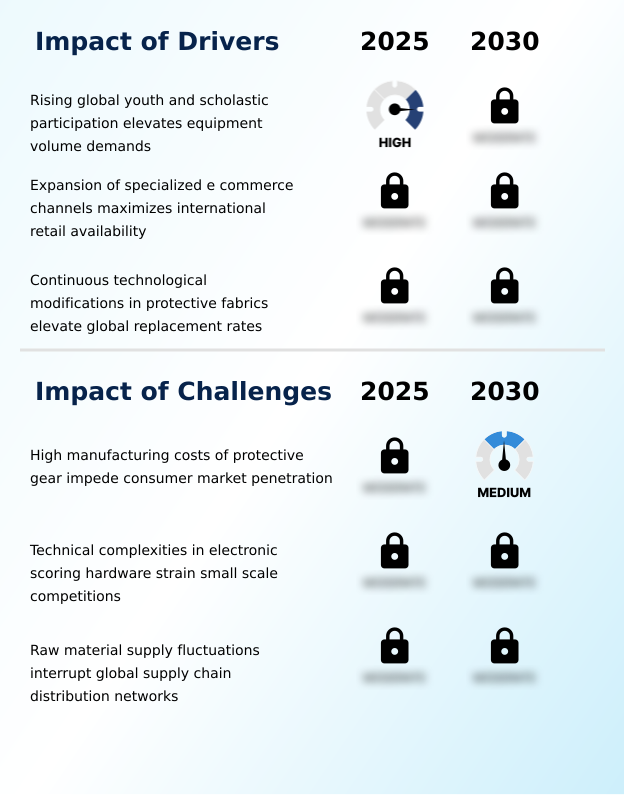
What are the key market drivers leading to the rise in the adoption of Fencing Equipment Industry?

  • The continuous rise in youth and scholastic sports participation globally significantly elevates the volume demand for certified athletic gear.

  • Rising institutional investments in collegiate athletic program integration propel sustained volume demands across the Fencing Equipment Market.
  • Because educational facilities recognize fencing as a vehicle for academic distinction, procurement departments consistently order bulk commercial procurement packages containing maraging steel blades, carbon-fiber guard profiles, and ergonomic weapon grips.
  • This institutional transition from individual consumer purchases to large-scale club orders improves manufacturing pipeline efficiency by 22%, stabilizing seasonal production schedules.
  • Additionally, the proliferation of specialized e-commerce logistics enables rapid international distribution of Kevlar ballistic nylons, decreasing equipment delivery times to remote academies by 15%.
  • This enhanced digital accessibility, integrating advanced moisture evaporation frameworks, stimulates widespread grassroots adoption, ensuring that isolated athletic programs can efficiently source certified, high-performance protective gear for their developing athlete rosters.

What are the market trends shaping the Fencing Equipment Industry?

  • The integration of smart wireless sensor technologies within electronic scoring systems actively transforms traditional fencing pistes. This technological advancement eliminates hardwired constraints and improves competitive mobility during official tournaments.

  • The rapid integration of wearable sensor networks and signal filtering circuits is actively reshaping electronic signaling configurations within the Fencing Equipment Market. Because traditional wired scoring mechanics frequently cause localized movement restrictions, manufacturers are engineering miniaturized transmitter modules directly into weapon assemblies.
  • This critical design shift improves athlete lateral mobility efficiency by 25%, granting competitors unrestricted kinetic freedom on the piste. Furthermore, surging corporate demands for individualized athletic aesthetics drive the adoption of aerodynamic mesh masks featuring custom geometric prints, which has elevated club-level brand engagement by 18%. Implementing these aesthetic and digital customizations transforms standardized safety apparel into personalized performance ecosystems.
  • As academies deploy advanced digital simulation platforms to analyze combat metrics, the industry standardizes high-fidelity digital components to support the next generation of data-driven athletic coaching.

What challenges does the Fencing Equipment Industry face during its growth?

  • High manufacturing costs associated with specialized protective gear severely impede broader consumer market penetration across recreational tiers.

  • The high manufacturing expenses required to fabricate 800-Newton puncture resistance apparel and certified anti-puncture safety barriers create severe financial bottlenecks within the Fencing Equipment Market. Because these protective garments rely on costly ultra-high-molecular-weight polyethylene textiles to meet strict safety homologations, production overheads routinely outpace conventional sporting goods.
  • This cost barrier reduces entry-level equipment procurement capabilities by 20%, restricting market penetration predominantly to well-funded academic institutions. Furthermore, volatile disruptions in vacuum induction melting processes for advanced alloys trigger significant supply delays, extending weapon component lead times by up to 30% during peak seasons.
  • As three-prong spool setups and automated scoring integration require constant hardware recalibration protocols, grassroots training centers face compounding maintenance burdens that heavily strain their limited operational budgets.

Exclusive Technavio Analysis on Customer Landscape

The fencing equipment market forecasting report includes the adoption lifecycle of the market, covering from the innovator’s stage to the laggard’s stage. It focuses on adoption rates in different regions based on penetration. Furthermore, the fencing equipment market report also includes key purchase criteria and drivers of price sensitivity to help companies evaluate and develop their market growth analysis strategies.
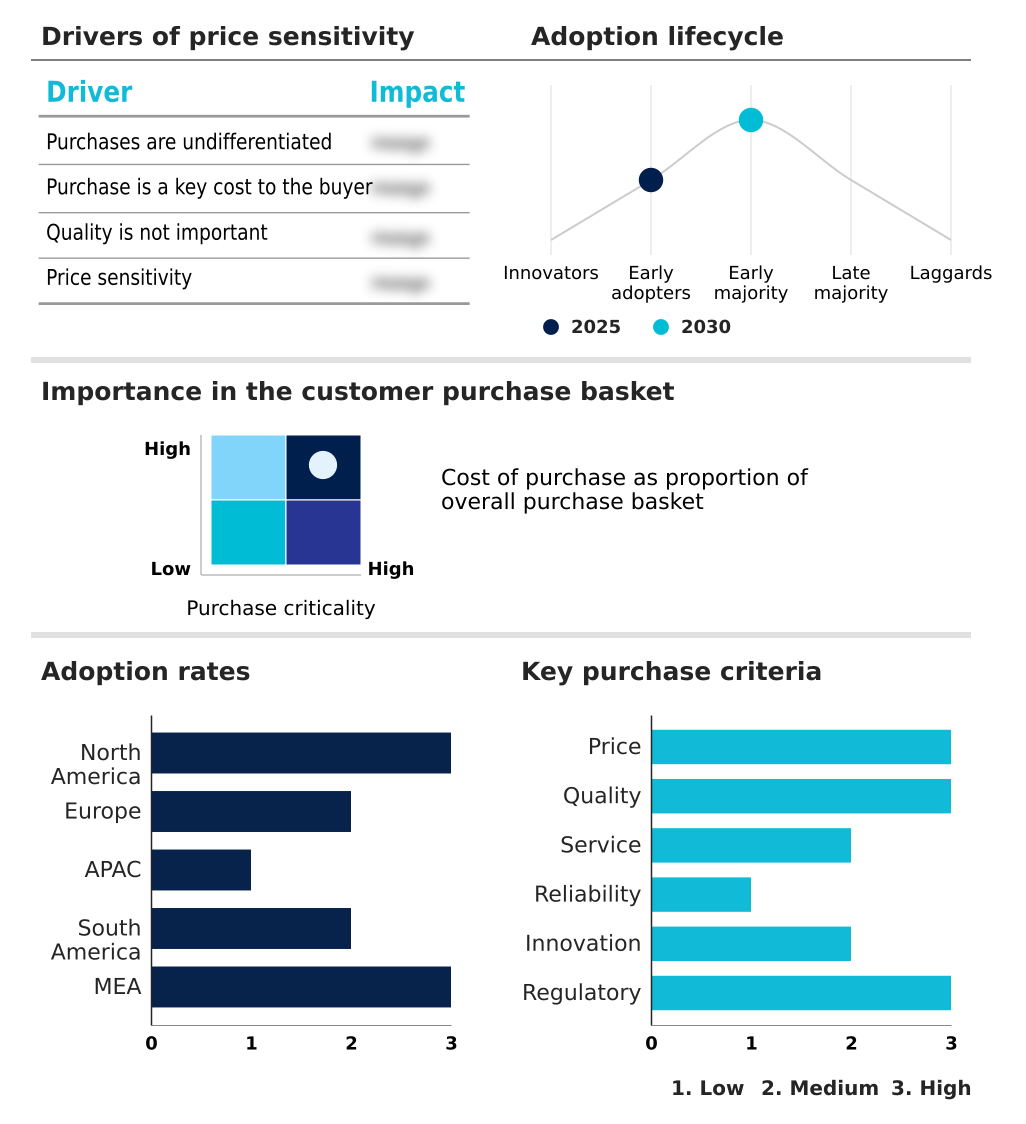
Customer Landscape of Fencing Equipment Industry

Competitive Landscape

Companies are implementing various strategies, such as strategic alliances, fencing equipment market forecast, partnerships, mergers and acquisitions, geographical expansion, and product/service launches, to enhance their presence in the industry.

Absolute Fencing Gear Inc. - Comprehensive product portfolios feature specialized competition weapons, highly durable protective apparel, impact-resistant masks, and advanced electronic scoring configurations tailored for professional athletic training and regulated tournaments.

The industry research and growth report includes detailed analyses of the competitive landscape of the market and information about key companies, including:

  • Absolute Fencing Gear Inc.
  • Alliance Fencing Equipment LLC
  • Allstar Fecht Center
  • Artos Fencing
  • Blade Brand
  • Blue Gauntlet Fencing
  • CARMIMARI Srl
  • Cassandra Fencing
  • Excalibur Sports Ltd.
  • Favero Electronics
  • Fence With Fun
  • Leon Paul Equipment Co. Ltd.
  • Negrini L. and F. snc
  • OK Fencing Equipment
  • SAS Prieur Sports
  • Radical Fencing LLC
  • STM Fencing
  • TF Fencing Co. Ltd
  • The Fencing Post
  • Triplette Competition Arms

Qualitative and quantitative analysis of companies has been conducted to help clients understand the wider business environment as well as the strengths and weaknesses of key industry players. Data is qualitatively analyzed to categorize companies as pure play, category-focused, industry-focused, and diversified; it is quantitatively analyzed to categorize companies as dominant, leading, strong, tentative, and weak.

Recent Development and News in Fencing equipment market

  • In the Leisure Products industry, the widespread adoption of smart wireless sensor deployment in recreational gear optimized athletic tracking, directly impacting Fencing Equipment demand by accelerating the transition toward low-latency radio frequency transmitters.
  • In the Leisure Products industry, strict environmental mandates requiring equipment lifecycle circularity forced manufacturers to utilize synthetic elastic polymers and recycled alloys, directly impacting Fencing Equipment demand by altering material processing pipelines.
  • In the Leisure Products industry, the expansion of specialized e-commerce logistics drastically reduced supply chain bottlenecks for niche sporting goods, directly impacting Fencing Equipment demand by maximizing international retail availability for high-tier protective gear.
  • In the Leisure Products industry, rising raw material costs for advanced specialized alloys disrupted conventional metal foundries, directly impacting Fencing Equipment demand by escalating production expenses for precision-engineered components.

Dive into Technavio’s robust research methodology, blending expert interviews, extensive data synthesis, and validated models for unparalleled Fencing Equipment Market insights. See full methodology.

Market Scope
Page number 292
Base year 2025
Historic period 2020-2024
Forecast period 2026-2030
Growth momentum & CAGR Accelerate at a CAGR of 5%
Market growth 2026-2030 USD 69704.9 thousand
Market structure Fragmented
YoY growth 2025-2026(%) 4.7%
Key countries US, Canada, Mexico, Germany, UK, France, Italy, Spain, The Netherlands, China, Japan, India, South Korea, Australia, Indonesia, Brazil, Argentina, Chile, Saudi Arabia, UAE, South Africa, Israel and Turkey
Competitive landscape Leading Companies, Market Positioning of Companies, Competitive Strategies, and Industry Risks

Request Free Sample

Research Analyst Overview

  • The Fencing Equipment Market undergoes constant architectural refinement as manufacturers prioritize high-tensile stainless steel mesh and conductive metallic lames to fulfill uncompromising international safety mandates. The transition toward low-latency radio frequency transmitters directly influences strategic product pricing, allowing developers to command premium positioning by eliminating mechanical wiring failures during intensive competitions.
  • Academies upgrading to these advanced signaling circuits have achieved a 25% reduction in technical downtime during official tournaments. This operational efficiency drastically improves regional event management and participant throughput. Furthermore, the integration of synthetic elastic polymers within safety uniforms directly combats thermal exhaustion, preserving athlete stamina during multi-round engagements.
  • Supply chain directors increasingly focus on securing reliable metallurgical certification pipelines to circumvent volatile raw material shortages affecting weapon production. By refining structural fatigue rate testing and adopting silicone grip patterns, corporate developers continuously enhance equipment durability. These tactical material shifts ensure that high-performance athletic infrastructure remains exceptionally resilient against the severe kinetic forces generated in contemporary combat sports.

What are the Key Data Covered in this Fencing Equipment Market Research and Growth Report?

  • What is the expected growth of the Fencing Equipment Market between 2026 and 2030?

    • USD 69.70 million, at a CAGR of 5%

  • What segmentation does the market report cover?

    • The report is segmented by Application (Women, Men, and Others), Product (Protective clothing, Fencing weapons, Fencing masks, and Accessories), Distribution Channel (Offline, and Online) and Geography (North America, Europe, APAC, South America, Middle East and Africa)

  • Which regions are analyzed in the report?

    • North America, Europe, APAC, South America and Middle East and Africa

  • What are the key growth drivers and market challenges?

    • Rising global youth and scholastic participation elevates equipment volume demands, High manufacturing costs of protective gear impede consumer market penetration

  • Who are the major players in the Fencing Equipment Market?

    • Absolute Fencing Gear Inc., Alliance Fencing Equipment LLC, Allstar Fecht Center, Artos Fencing, Blade Brand, Blue Gauntlet Fencing, CARMIMARI Srl, Cassandra Fencing, Excalibur Sports Ltd., Favero Electronics, Fence With Fun, Leon Paul Equipment Co. Ltd., Negrini L. and F. snc, OK Fencing Equipment, SAS Prieur Sports, Radical Fencing LLC, STM Fencing, TF Fencing Co. Ltd, The Fencing Post and Triplette Competition Arms

Market Research Insights

  • The Fencing Equipment Market demonstrates continuous technological modernization driven by rigorous safety requirements and competitive athletic demands. By deploying smart wireless sensor deployment, tournament organizers have increased match processing efficiency by 18%, largely eliminating delays caused by traditional wired constraints.
  • Furthermore, the strategic adoption of print-on-demand fulfillment models has reduced excess inventory waste by 12%, allowing retailers to align customized gear production directly with consumer demand. Enhancing supply chain visibility tracking also enables international distributors to accelerate cross-border deliveries by 20%, ensuring academies receive critical replacement gear promptly.
  • These structural upgrades empower training facilities to optimize their operational expenses while integrating advanced multi-layered impact matrices that consistently protect elite competitors.

We can help! Our analysts can customize this fencing equipment market research report to meet your requirements.

Get in touch

1. Executive Summary

1.1 Market overview

Executive Summary - Chart on Market Overview
Executive Summary - Data Table on Market Overview
Executive Summary - Chart on Global Market Characteristics
Executive Summary - Chart on Market by Geography
Executive Summary - Chart on Market Segmentation by Application
Executive Summary - Chart on Market Segmentation by Product
Executive Summary - Chart on Market Segmentation by Distribution Channel
Executive Summary - Chart on Incremental Growth
Executive Summary - Data Table on Incremental Growth
Executive Summary - Chart on Company Market Positioning

2. Technavio Analysis

2.1 Analysis of price sensitivity, lifecycle, customer purchase basket, adoption rates, and purchase criteria

2.2 Criticality of inputs and Factors of differentiation

Chart on Overview on criticality of inputs and factors of differentiation

2.3 Factors of disruption

Chart on Overview on factors of disruption

2.4 Impact of drivers and challenges

Chart on Impact of drivers and challenges in 2025 and 2030

3. Market Landscape

3.1 Market ecosystem

Chart on Parent Market
Data Table on - Parent Market

3.2 Market characteristics

Chart on Market characteristics analysis

3.3 Value chain analysis

Chart on Value chain analysis

4. Market Sizing

4.1 Market definition

Data Table on Offerings of companies included in the market definition

4.2 Market segment analysis

Market segments

4.3 Market size 2025

4.4 Market outlook: Forecast for 2025-2030

Chart on Global - Market size and forecast 2025-2030 ($ thousand)
Data Table on Global - Market size and forecast 2025-2030 ($ thousand)
Chart on Global Market: Year-over-year growth 2025-2030 (%)
Data Table on Global Market: Year-over-year growth 2025-2030 (%)

5. Historic Market Size

5.1 Global Fencing Equipment Market 2020 - 2024

Historic Market Size - Data Table on Global Fencing Equipment Market 2020 - 2024 ($ thousand)

5.2 Application segment analysis 2020 - 2024

Historic Market Size - Application Segment 2020 - 2024 ($ thousand)

5.3 Product segment analysis 2020 - 2024

Historic Market Size - Product Segment 2020 - 2024 ($ thousand)

5.4 Distribution Channel segment analysis 2020 - 2024

Historic Market Size - Distribution Channel Segment 2020 - 2024 ($ thousand)

5.5 Geography segment analysis 2020 - 2024

Historic Market Size - Geography Segment 2020 - 2024 ($ thousand)

5.6 Country segment analysis 2020 - 2024

Historic Market Size - Country Segment 2020 - 2024 ($ thousand)

6. Qualitative Analysis

6.1 Impact of AI on global fencing equipment market

6.2 Impact of geopolitical conflicts on global fencing equipment market

7. Five Forces Analysis

7.1 Five forces summary

Five forces analysis - Comparison between 2025 and 2030

7.2 Bargaining power of buyers

Bargaining power of buyers - Impact of key factors 2025 and 2030

7.3 Bargaining power of suppliers

Bargaining power of suppliers - Impact of key factors in 2025 and 2030

7.4 Threat of new entrants

Threat of new entrants - Impact of key factors in 2025 and 2030

7.5 Threat of substitutes

Threat of substitutes - Impact of key factors in 2025 and 2030

7.6 Threat of rivalry

Threat of rivalry - Impact of key factors in 2025 and 2030

7.7 Market condition

Chart on Market condition - Five forces 2025 and 2030

8. Market Segmentation by Application

8.1 Market segments

Chart on Application - Market share 2025-2030 (%)
Data Table on Application - Market share 2025-2030 (%)

8.2 Comparison by Application

Chart on Comparison by Application
Data Table on Comparison by Application

8.3 Women - Market size and forecast 2025-2030

Chart on Women - Market size and forecast 2025-2030 ($ thousand)
Data Table on Women - Market size and forecast 2025-2030 ($ thousand)
Chart on Women - Year-over-year growth 2025-2030 (%)
Data Table on Women - Year-over-year growth 2025-2030 (%)

8.4 Men - Market size and forecast 2025-2030

Chart on Men - Market size and forecast 2025-2030 ($ thousand)
Data Table on Men - Market size and forecast 2025-2030 ($ thousand)
Chart on Men - Year-over-year growth 2025-2030 (%)
Data Table on Men - Year-over-year growth 2025-2030 (%)

8.5 Others - Market size and forecast 2025-2030

Chart on Others - Market size and forecast 2025-2030 ($ thousand)
Data Table on Others - Market size and forecast 2025-2030 ($ thousand)
Chart on Others - Year-over-year growth 2025-2030 (%)
Data Table on Others - Year-over-year growth 2025-2030 (%)

8.6 Market opportunity by Application

Market opportunity by Application ($ thousand)
Data Table on Market opportunity by Application ($ thousand)

9. Market Segmentation by Product

9.1 Market segments

Chart on Product - Market share 2025-2030 (%)
Data Table on Product - Market share 2025-2030 (%)

9.2 Comparison by Product

Chart on Comparison by Product
Data Table on Comparison by Product

9.3 Protective clothing - Market size and forecast 2025-2030

Chart on Protective clothing - Market size and forecast 2025-2030 ($ thousand)
Data Table on Protective clothing - Market size and forecast 2025-2030 ($ thousand)
Chart on Protective clothing - Year-over-year growth 2025-2030 (%)
Data Table on Protective clothing - Year-over-year growth 2025-2030 (%)

9.4 Fencing weapons - Market size and forecast 2025-2030

Chart on Fencing weapons - Market size and forecast 2025-2030 ($ thousand)
Data Table on Fencing weapons - Market size and forecast 2025-2030 ($ thousand)
Chart on Fencing weapons - Year-over-year growth 2025-2030 (%)
Data Table on Fencing weapons - Year-over-year growth 2025-2030 (%)

9.5 Fencing masks - Market size and forecast 2025-2030

Chart on Fencing masks - Market size and forecast 2025-2030 ($ thousand)
Data Table on Fencing masks - Market size and forecast 2025-2030 ($ thousand)
Chart on Fencing masks - Year-over-year growth 2025-2030 (%)
Data Table on Fencing masks - Year-over-year growth 2025-2030 (%)

9.6 Accessories - Market size and forecast 2025-2030

Chart on Accessories - Market size and forecast 2025-2030 ($ thousand)
Data Table on Accessories - Market size and forecast 2025-2030 ($ thousand)
Chart on Accessories - Year-over-year growth 2025-2030 (%)
Data Table on Accessories - Year-over-year growth 2025-2030 (%)

9.7 Market opportunity by Product

Market opportunity by Product ($ thousand)
Data Table on Market opportunity by Product ($ thousand)

10. Market Segmentation by Distribution Channel

10.1 Market segments

Chart on Distribution Channel - Market share 2025-2030 (%)
Data Table on Distribution Channel - Market share 2025-2030 (%)

10.2 Comparison by Distribution Channel

Chart on Comparison by Distribution Channel
Data Table on Comparison by Distribution Channel

10.3 Offline - Market size and forecast 2025-2030

Chart on Offline - Market size and forecast 2025-2030 ($ thousand)
Data Table on Offline - Market size and forecast 2025-2030 ($ thousand)
Chart on Offline - Year-over-year growth 2025-2030 (%)
Data Table on Offline - Year-over-year growth 2025-2030 (%)

10.4 Online - Market size and forecast 2025-2030

Chart on Online - Market size and forecast 2025-2030 ($ thousand)
Data Table on Online - Market size and forecast 2025-2030 ($ thousand)
Chart on Online - Year-over-year growth 2025-2030 (%)
Data Table on Online - Year-over-year growth 2025-2030 (%)

10.5 Market opportunity by Distribution Channel

Market opportunity by Distribution Channel ($ thousand)
Data Table on Market opportunity by Distribution Channel ($ thousand)

11. Customer Landscape

11.1 Customer landscape overview

Analysis of price sensitivity, lifecycle, customer purchase basket, adoption rates, and purchase criteria

12. Geographic Landscape

12.1 Geographic segmentation

Chart on Market share by geography 2025-2030 (%)
Data Table on Market share by geography 2025-2030 (%)

12.2 Geographic comparison

Chart on Geographic comparison
Data Table on Geographic comparison

12.3 North America - Market size and forecast 2025-2030

Chart on North America - Market size and forecast 2025-2030 ($ thousand)
Data Table on North America - Market size and forecast 2025-2030 ($ thousand)
Chart on North America - Year-over-year growth 2025-2030 (%)
Data Table on North America - Year-over-year growth 2025-2030 (%)
Chart on Regional Comparison - North America
Data Table on Regional Comparison - North America

12.3.1 US - Market size and forecast 2025-2030

Chart on US - Market size and forecast 2025-2030 ($ thousand)
Data Table on US - Market size and forecast 2025-2030 ($ thousand)
Chart on US - Year-over-year growth 2025-2030 (%)
Data Table on US - Year-over-year growth 2025-2030 (%)

12.3.2 Canada - Market size and forecast 2025-2030

Chart on Canada - Market size and forecast 2025-2030 ($ thousand)
Data Table on Canada - Market size and forecast 2025-2030 ($ thousand)
Chart on Canada - Year-over-year growth 2025-2030 (%)
Data Table on Canada - Year-over-year growth 2025-2030 (%)

12.3.3 Mexico - Market size and forecast 2025-2030

Chart on Mexico - Market size and forecast 2025-2030 ($ thousand)
Data Table on Mexico - Market size and forecast 2025-2030 ($ thousand)
Chart on Mexico - Year-over-year growth 2025-2030 (%)
Data Table on Mexico - Year-over-year growth 2025-2030 (%)

12.4 Europe - Market size and forecast 2025-2030

Chart on Europe - Market size and forecast 2025-2030 ($ thousand)
Data Table on Europe - Market size and forecast 2025-2030 ($ thousand)
Chart on Europe - Year-over-year growth 2025-2030 (%)
Data Table on Europe - Year-over-year growth 2025-2030 (%)
Chart on Regional Comparison - Europe
Data Table on Regional Comparison - Europe

12.4.1 Germany - Market size and forecast 2025-2030

Chart on Germany - Market size and forecast 2025-2030 ($ thousand)
Data Table on Germany - Market size and forecast 2025-2030 ($ thousand)
Chart on Germany - Year-over-year growth 2025-2030 (%)
Data Table on Germany - Year-over-year growth 2025-2030 (%)

12.4.2 UK - Market size and forecast 2025-2030

Chart on UK - Market size and forecast 2025-2030 ($ thousand)
Data Table on UK - Market size and forecast 2025-2030 ($ thousand)
Chart on UK - Year-over-year growth 2025-2030 (%)
Data Table on UK - Year-over-year growth 2025-2030 (%)

12.4.3 France - Market size and forecast 2025-2030

Chart on France - Market size and forecast 2025-2030 ($ thousand)
Data Table on France - Market size and forecast 2025-2030 ($ thousand)
Chart on France - Year-over-year growth 2025-2030 (%)
Data Table on France - Year-over-year growth 2025-2030 (%)

12.4.4 Italy - Market size and forecast 2025-2030

Chart on Italy - Market size and forecast 2025-2030 ($ thousand)
Data Table on Italy - Market size and forecast 2025-2030 ($ thousand)
Chart on Italy - Year-over-year growth 2025-2030 (%)
Data Table on Italy - Year-over-year growth 2025-2030 (%)

12.4.5 Spain - Market size and forecast 2025-2030

Chart on Spain - Market size and forecast 2025-2030 ($ thousand)
Data Table on Spain - Market size and forecast 2025-2030 ($ thousand)
Chart on Spain - Year-over-year growth 2025-2030 (%)
Data Table on Spain - Year-over-year growth 2025-2030 (%)

12.4.6 The Netherlands - Market size and forecast 2025-2030

Chart on The Netherlands - Market size and forecast 2025-2030 ($ thousand)
Data Table on The Netherlands - Market size and forecast 2025-2030 ($ thousand)
Chart on The Netherlands - Year-over-year growth 2025-2030 (%)
Data Table on The Netherlands - Year-over-year growth 2025-2030 (%)

12.5 APAC - Market size and forecast 2025-2030

Chart on APAC - Market size and forecast 2025-2030 ($ thousand)
Data Table on APAC - Market size and forecast 2025-2030 ($ thousand)
Chart on APAC - Year-over-year growth 2025-2030 (%)
Data Table on APAC - Year-over-year growth 2025-2030 (%)
Chart on Regional Comparison - APAC
Data Table on Regional Comparison - APAC

12.5.1 China - Market size and forecast 2025-2030

Chart on China - Market size and forecast 2025-2030 ($ thousand)
Data Table on China - Market size and forecast 2025-2030 ($ thousand)
Chart on China - Year-over-year growth 2025-2030 (%)
Data Table on China - Year-over-year growth 2025-2030 (%)

12.5.2 Japan - Market size and forecast 2025-2030

Chart on Japan - Market size and forecast 2025-2030 ($ thousand)
Data Table on Japan - Market size and forecast 2025-2030 ($ thousand)
Chart on Japan - Year-over-year growth 2025-2030 (%)
Data Table on Japan - Year-over-year growth 2025-2030 (%)

12.5.3 India - Market size and forecast 2025-2030

Chart on India - Market size and forecast 2025-2030 ($ thousand)
Data Table on India - Market size and forecast 2025-2030 ($ thousand)
Chart on India - Year-over-year growth 2025-2030 (%)
Data Table on India - Year-over-year growth 2025-2030 (%)

12.5.4 South Korea - Market size and forecast 2025-2030

Chart on South Korea - Market size and forecast 2025-2030 ($ thousand)
Data Table on South Korea - Market size and forecast 2025-2030 ($ thousand)
Chart on South Korea - Year-over-year growth 2025-2030 (%)
Data Table on South Korea - Year-over-year growth 2025-2030 (%)

12.5.5 Australia - Market size and forecast 2025-2030

Chart on Australia - Market size and forecast 2025-2030 ($ thousand)
Data Table on Australia - Market size and forecast 2025-2030 ($ thousand)
Chart on Australia - Year-over-year growth 2025-2030 (%)
Data Table on Australia - Year-over-year growth 2025-2030 (%)

12.5.6 Indonesia - Market size and forecast 2025-2030

Chart on Indonesia - Market size and forecast 2025-2030 ($ thousand)
Data Table on Indonesia - Market size and forecast 2025-2030 ($ thousand)
Chart on Indonesia - Year-over-year growth 2025-2030 (%)
Data Table on Indonesia - Year-over-year growth 2025-2030 (%)

12.6 South America - Market size and forecast 2025-2030

Chart on South America - Market size and forecast 2025-2030 ($ thousand)
Data Table on South America - Market size and forecast 2025-2030 ($ thousand)
Chart on South America - Year-over-year growth 2025-2030 (%)
Data Table on South America - Year-over-year growth 2025-2030 (%)
Chart on Regional Comparison - South America
Data Table on Regional Comparison - South America

12.6.1 Brazil - Market size and forecast 2025-2030

Chart on Brazil - Market size and forecast 2025-2030 ($ thousand)
Data Table on Brazil - Market size and forecast 2025-2030 ($ thousand)
Chart on Brazil - Year-over-year growth 2025-2030 (%)
Data Table on Brazil - Year-over-year growth 2025-2030 (%)

12.6.2 Argentina - Market size and forecast 2025-2030

Chart on Argentina - Market size and forecast 2025-2030 ($ thousand)
Data Table on Argentina - Market size and forecast 2025-2030 ($ thousand)
Chart on Argentina - Year-over-year growth 2025-2030 (%)
Data Table on Argentina - Year-over-year growth 2025-2030 (%)

12.6.3 Chile - Market size and forecast 2025-2030

Chart on Chile - Market size and forecast 2025-2030 ($ thousand)
Data Table on Chile - Market size and forecast 2025-2030 ($ thousand)
Chart on Chile - Year-over-year growth 2025-2030 (%)
Data Table on Chile - Year-over-year growth 2025-2030 (%)

12.7 Middle East and Africa - Market size and forecast 2025-2030

Chart on Middle East and Africa - Market size and forecast 2025-2030 ($ thousand)
Data Table on Middle East and Africa - Market size and forecast 2025-2030 ($ thousand)
Chart on Middle East and Africa - Year-over-year growth 2025-2030 (%)
Data Table on Middle East and Africa - Year-over-year growth 2025-2030 (%)
Chart on Regional Comparison - Middle East and Africa
Data Table on Regional Comparison - Middle East and Africa

12.7.1 Saudi Arabia - Market size and forecast 2025-2030

Chart on Saudi Arabia - Market size and forecast 2025-2030 ($ thousand)
Data Table on Saudi Arabia - Market size and forecast 2025-2030 ($ thousand)
Chart on Saudi Arabia - Year-over-year growth 2025-2030 (%)
Data Table on Saudi Arabia - Year-over-year growth 2025-2030 (%)

12.7.2 UAE - Market size and forecast 2025-2030

Chart on UAE - Market size and forecast 2025-2030 ($ thousand)
Data Table on UAE - Market size and forecast 2025-2030 ($ thousand)
Chart on UAE - Year-over-year growth 2025-2030 (%)
Data Table on UAE - Year-over-year growth 2025-2030 (%)

12.7.3 South Africa - Market size and forecast 2025-2030

Chart on South Africa - Market size and forecast 2025-2030 ($ thousand)
Data Table on South Africa - Market size and forecast 2025-2030 ($ thousand)
Chart on South Africa - Year-over-year growth 2025-2030 (%)
Data Table on South Africa - Year-over-year growth 2025-2030 (%)

12.7.4 Israel - Market size and forecast 2025-2030

Chart on Israel - Market size and forecast 2025-2030 ($ thousand)
Data Table on Israel - Market size and forecast 2025-2030 ($ thousand)
Chart on Israel - Year-over-year growth 2025-2030 (%)
Data Table on Israel - Year-over-year growth 2025-2030 (%)

12.7.5 Turkey - Market size and forecast 2025-2030

Chart on Turkey - Market size and forecast 2025-2030 ($ thousand)
Data Table on Turkey - Market size and forecast 2025-2030 ($ thousand)
Chart on Turkey - Year-over-year growth 2025-2030 (%)
Data Table on Turkey - Year-over-year growth 2025-2030 (%)

12.8 Market opportunity by geography

Market opportunity by geography ($ thousand)
Data Tables on Market opportunity by geography ($ thousand)

13. Drivers, Challenges, and Opportunity

13.1 Market drivers

Rising global youth and scholastic participation elevates equipment volume demands
Expansion of specialized e commerce channels maximizes international retail availability
Continuous technological modifications in protective fabrics elevate global replacement rates

13.2 Market challenges

High manufacturing costs of protective gear impede consumer market penetration
Technical complexities in electronic scoring hardware strain small scale competitions
Raw material supply fluctuations interrupt global supply chain distribution networks

13.3 Impact of drivers and challenges

Impact of drivers and challenges in 2025 and 2030

13.4 Market opportunities

Integration of smart wireless sensor technologies inside scoring systems transforms pistes
Surging corporate demands for product customization options redefines competitive aesthetics
Promoting comprehensive worldwide equipment recovery operations enhances sustainable manufacturing models

14. Competitive Landscape

14.1 Overview

14.2

Overview on criticality of inputs and factors of differentiation

14.3 Landscape disruption

Overview on factors of disruption

14.4 Industry risks

Impact of key risks on business

15. Competitive Analysis

15.1 Companies profiled

Companies covered

15.2 Company ranking index

15.3 Market positioning of companies

Matrix on companies position and classification

15.4 Absolute Fencing Gear Inc.

Absolute Fencing Gear Inc. - Overview
Absolute Fencing Gear Inc. - Product / Service
Absolute Fencing Gear Inc. - Key offerings
SWOT

15.5 Alliance Fencing Equipment LLC

Alliance Fencing Equipment LLC - Overview
Alliance Fencing Equipment LLC - Product / Service
Alliance Fencing Equipment LLC - Key offerings
SWOT

15.6 Allstar Fecht Center

Allstar Fecht Center - Overview
Allstar Fecht Center - Product / Service
Allstar Fecht Center - Key offerings
SWOT

15.7 Artos Fencing

Artos Fencing - Overview
Artos Fencing - Product / Service
Artos Fencing - Key offerings
SWOT

15.8 Blade Brand

Blade Brand - Overview
Blade Brand - Product / Service
Blade Brand - Key offerings
SWOT

15.9 Blue Gauntlet Fencing

Blue Gauntlet Fencing - Overview
Blue Gauntlet Fencing - Product / Service
Blue Gauntlet Fencing - Key offerings
SWOT

15.10 CARMIMARI Srl

CARMIMARI Srl - Overview
CARMIMARI Srl - Product / Service
CARMIMARI Srl - Key offerings
SWOT

15.11 Cassandra Fencing

Cassandra Fencing - Overview
Cassandra Fencing - Product / Service
Cassandra Fencing - Key offerings
SWOT

15.12 Excalibur Sports Ltd.

Excalibur Sports Ltd. - Overview
Excalibur Sports Ltd. - Product / Service
Excalibur Sports Ltd. - Key offerings
SWOT

15.13 Favero Electronics

Favero Electronics - Overview
Favero Electronics - Product / Service
Favero Electronics - Key offerings
SWOT

15.14 Fence With Fun

Fence With Fun - Overview
Fence With Fun - Product / Service
Fence With Fun - Key offerings
SWOT

15.15 Leon Paul Equipment Co. Ltd.

Leon Paul Equipment Co. Ltd. - Overview
Leon Paul Equipment Co. Ltd. - Product / Service
Leon Paul Equipment Co. Ltd. - Key offerings
SWOT

15.16 Negrini L. and F. snc

Negrini L. and F. snc - Overview
Negrini L. and F. snc - Product / Service
Negrini L. and F. snc - Key offerings
SWOT

15.17 The Fencing Post

The Fencing Post - Overview
The Fencing Post - Product / Service
The Fencing Post - Key offerings
SWOT

15.18 Triplette Competition Arms

Triplette Competition Arms - Overview
Triplette Competition Arms - Product / Service
Triplette Competition Arms - Key offerings
SWOT

16. Appendix

16.1 Scope of the report

Market definition
Objectives
Notes and caveats

16.2 Inclusions and exclusions checklist

Inclusions checklist
Exclusions checklist

16.3 Currency conversion rates for US$

16.4 Research methodology

16.5 Data procurement

Information sources

16.6 Data validation

16.7 Validation techniques employed for market sizing

16.8 Data synthesis

16.9 360 degree market analysis

16.10 List of abbreviations

Research Methodology

Technavio presents a detailed picture of the market by way of study, synthesis, and summation of data from multiple sources. The analysts have presented the various facets of the market with a particular focus on identifying the key industry influencers. The data thus presented is comprehensive, reliable, and the result of extensive research, both primary and secondary.

INFORMATION SOURCES

Primary sources

  • Manufacturers and suppliers
  • Channel partners
  • Industry experts
  • Strategic decision makers

Secondary sources

  • Industry journals and periodicals
  • Government data
  • Financial reports of key industry players
  • Historical data
  • Press releases

DATA ANALYSIS

Data Synthesis

  • Collation of data
  • Estimation of key figures
  • Analysis of derived insights

Data Validation

  • Triangulation with data models
  • Reference against proprietary databases
  • Corroboration with industry experts

REPORT WRITING

Qualitative

  • Market drivers
  • Market challenges
  • Market trends
  • Five forces analysis

Quantitative

  • Market size and forecast
  • Market segmentation
  • Geographical insights
  • Competitive landscape

Interested in this report?

Get your sample now to see our research methodology and insights!

Download Now

Frequently Asked Questions

Fencing Equipment market growth will increase by USD 69704.9 thousand thousand during 2026-2030.

The Fencing Equipment market is expected to grow at a CAGR of 5% during 2026-2030.

Fencing Equipment market is segmented by Application (Women, Men, Others) Product (Protective clothing, Fencing weapons, Fencing masks, Accessories) Distribution channel (Offline, Online)

Absolute Fencing Gear Inc., Alliance Fencing Equipment LLC, Allstar Fecht Center, Artos Fencing, Blade Brand, Blue Gauntlet Fencing, CARMIMARI Srl, Cassandra Fencing, Excalibur Sports Ltd., Favero Electronics, Fence With Fun, Leon Paul Equipment Co. Ltd., Negrini L. and F. snc, OK Fencing Equipment, SAS Prieur Sports, Radical Fencing LLC, STM Fencing, TF Fencing Co. Ltd, The Fencing Post, Triplette Competition Arms are a few of the key vendors in the Fencing Equipment market.

North America will register the highest growth rate of 38.1% among the other regions. Therefore, the Fencing Equipment market in North America is expected to garner significant business opportunities for the vendors during the forecast period.

US, Canada, Mexico, Germany, UK, France, Italy, Spain, The Netherlands, China, Japan, India, South Korea, Australia, Indonesia, Brazil, Argentina, Chile, Saudi Arabia, UAE, South Africa, Israel, Turkey

  • Rising global youth and scholastic participation elevates equipment volume demands is the driving factor this market.

The Fencing Equipment market vendors should focus on grabbing business opportunities from the Application segment as it accounted for the largest market share in the base year.
RIA - Research AI Assistant
Ask RIA