Fire And Gas Detection System Market Analysis APAC, North America, Europe, Middle East and Africa, South America - China, US, Germany, Russia, India - Size and Forecast 2024-2028

Fire And Gas Detection System Market Analysis APAC, North America, Europe, Middle East and Africa, South America - China, US, Germany, Russia, India - Size and Forecast 2024-2028

Published: Jul 2024 180 Pages SKU: IRTNTR70882

Market Overview at a Glance

$2.32 B
Market Opportunity
3.2%
CAGR
3.06
YoY growth 2023-2024(%)

Fire and Gas Detection System Market Size 2024-2028

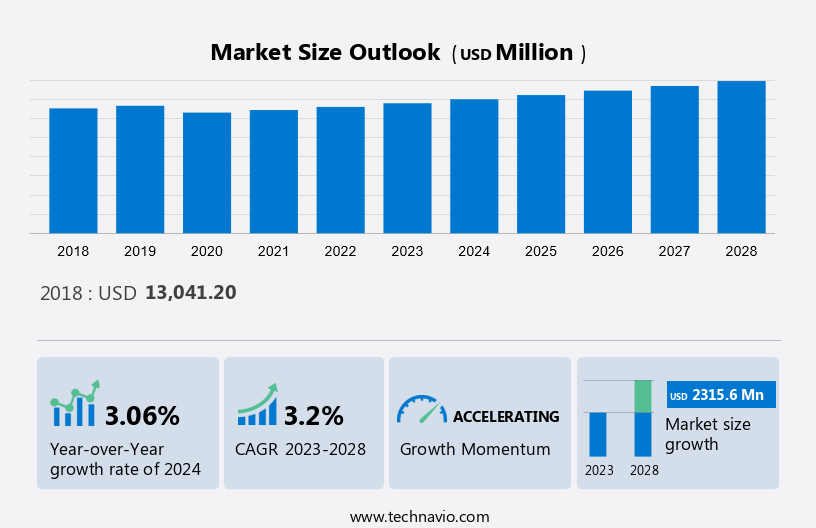
The fire and gas detection system market is estimated to grow by USD 2.32 billion between 2023 and 2028 at a CAGR of 3.2%.  The market is experiencing significant growth, driven by several key factors. The increasing production of shale gas is one such factor, as the extraction process involves potential hazards that necessitate advanced detection systems. Another factor is the growing emphasis on worker safety across various industries, leading to a heightened focus on implementing robust safety measures. Furthermore, the number of industry safety performance standards is on the rise, making it mandatory for organizations to invest in reliable detection systems to ensure regulatory compliance.

What will be the Size of the Market During the Forecast Period?

Fire And Gas Detection System Market Size

To learn more about this report,  Download Report Sample

Technavio’s Exclusive Market Customer Landscape

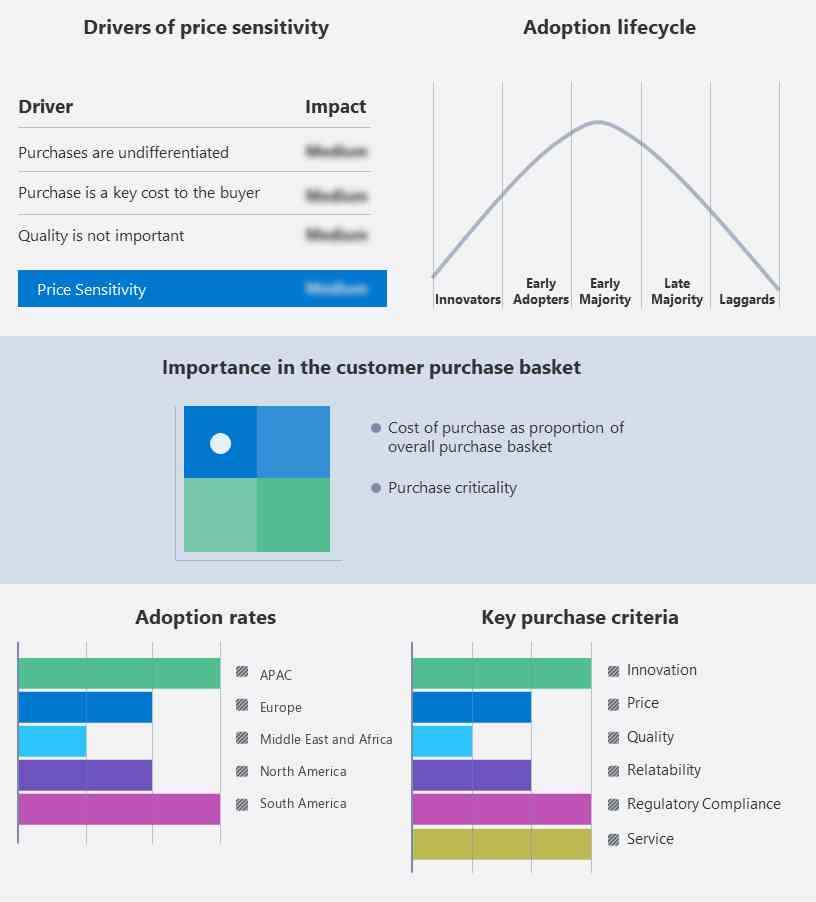
Our analysis of the adoption life cycle of the market indicates its movement between the innovator’s stage and the laggard’s stage. The report illustrates the lifecycle of the market, focusing on the adoption rates of the major countries. Technavio has included key purchase criteria, adoption rates, adoption lifecycles, and drivers of price sensitivity to help companies evaluate and develop growth strategies from 2023 to 2028. 

Fire and Gas Detection System Market Share by Geography

Market Customer Landscape

Market Dynamics

The Market encompasses the sales, production, and installation of fire detection systems, including fire alarms, fire detectors, smoke detectors, and heat detectors. The market caters to various industries, primarily focusing on fireprone environments such as power utilities, mining, petrochemical industry, oil and gas exploration industry, and construction-related projects. Fire safety regulations mandate the use of reliable and efficient fire detection systems to minimize damage and loss of life. The Commercial segment dominates the market due to the large-scale infrastructure and the high risk of fire incidents. Residential applications are also growing due to increasing awareness and the availability of sustainable alarm and detection solutions made from recyclable and biodegradable materials like plant-based bioplastics and biodegradable polymers. Technological developments in integrated fire safety systems are driving market growth. The future of the Market lies in the adoption of advanced technologies and the implementation of stricter fire safety regulations. Our researchers studied the data for years, with 2023 as the base year and 2024 as the estimated year, and presented the key drivers, trends, and challenges for the market.   

Key Market Driver

One of the key factors driving growth in the market is the rising production of shale gas. Due to the glut of supply, it introduced into the market, which eventually resulted in price drops, shale gas has altered the global structure of oil and gas energy. Unlike conventional petroleum gas, shale gas investigation transmits bigger measures of methane and consequently, has a higher ozone-depleting substance impression. CH4 isn't simply destructive to the climate but additionally a wellspring of blast risks.

Moreover, the rise in shale gas production from countries such as the US, Russia, Iran, Qatar, Canada, China, Norway, and Saudi Arabia has raised the scope for the adoption of gas detection products and solutions. Besides, the growing urge to minimize casualties and an increasing number of government mandates have given rise to the adoption of the latest safety tools in the shale gas manufacturing processes, to their functional benefits. Hence, increasing shale gas production will drive the global market during the forecast period.

Significant Market Trends

The advent of 3D fire and gas mapping tools is the primary trend in the global market. One of the most recent technological advancements in the field of safety instrumentation systems is the appearance of the software tool for 3D fire and gas mapping. The oil and gas, chemical, and petrochemical industries, among other end-user industries, are rapidly adopting this tool. The execution of the 3D fire and gas planning device in a modern arrangement helps streamline the number and area of F&G finders. A unit of United Technologies called Detector Electronics offers a 3D fire and gas mapping tool for industries that require a higher level of protection and safety.

Moreover, some key features offered by the 3D fire and gas mapping software are they are fully 3D flame and gas detection assessments, fully configurable and compliant with every oil and gas design methodology, and coverage optimization resulting in a safe and compliant fire and gas detection design. The results can be presented in 2D or 3D formats, whichever provides the most insight. Therefore, the implementation of the 3D fire and gas mapping tool in an industry helps in the optimization of the number of F&G detectors, which will drive the growth of the market in focus during the forecast period.

Major Market Challenge

The high maintenance cost will be a major challenge for the market during the forecast period. The ongoing advances in nanotechnology and the availability of faster Internet have enhanced the functions of F&G detection systems. However, these systems need periodic maintenance and an around-the-clock monitoring system. This system alone costs an average of USD 1,000 for installation, excluding the maintenance contract and other services involved in the building or plant. 

Moreover, in certain cases, these systems may detect ambient gases that are harmless and result in a false alarm owing to an error in the calibration. There have been more where in the actual damage from false alarms also activations have been greater than the initial cost of activating unnecessary fire emergency procedures. Unacceptable false alarm rates result in a loss of credibility in the safety system. This has negatively affected the adoption of these systems by industries. Also, manufacturers of F&G detection systems may take advantage of creating a vendor lock-in situation by offering systems that can only be serviced by them, which will hinder the growth of the market in focus during the forecast period.

Who are the Major Market Companies?

Players are implementing various strategies, such as strategic alliances, partnerships, mergers and acquisitions, geographical expansion, and product/service launches, to enhance their presence in the market.

ABB Ltd.: The company offers CO detectors in its home automation system, Alarm Stick.

Dragerwerk AG and Co. KGaA: The company offers Drager Polytron 7000, Drager Polytron 2000, Drager PIR 7000, Drager Flame 5000.

We also have detailed analyses of the market’s competitive landscape and offer information on 20 market companies, including:

  • Agilent Technologies Inc.j
  • Carrier Global Corp.
  • Emerson Electric Co.
  • Engineering for Science and Industry Malta Ltd.
  • Enmet LLC
  • GIL Automations Ltd.
  • Halma Plc
  • HIMA Paul Hildebrandt GmbH
  • Honeywell International Inc.
  • Johnson Controls International Plc
  • Kongsberg Gruppen ASA
  • MSA Safety Inc.
  • Omega Integration Pte Ltd.
  • Rockwell Automation Inc.
  • Schneider Electric SE
  • Siemens AG
  • Teledyne Technologies Inc.
  • Yokogawa Electric Corp.

Technavio report provides an in-depth analysis of the market and its players through combined qualitative and quantitative data. The analysis classifies vendors based on their business approaches, including pure-play, category-focused, industry-focused, and diversified. Vendors are specially categorized into dominant, leading, strong, tentative, and weak, based on their quantitative data analysis.  

Market Segmentation By End-User

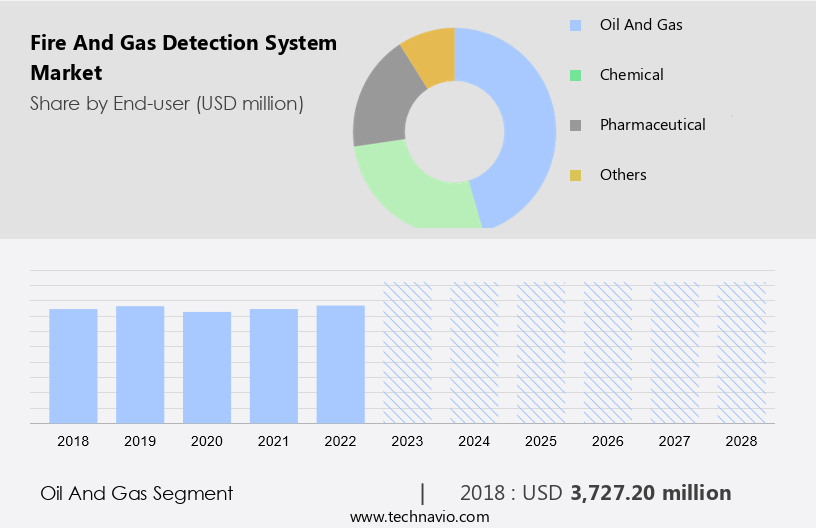
The oil and gas segment will account for a major share of the market's growth during the forecast period.?The oil and gas segment includes oil refineries, processing plants, pipelines, LPG/LNG plants, and offshore and onshore drilling and exploration and production (E&P) platforms which have a wide range of hazardous, combustible, and toxic gases. Besides, the industry involves tank farms, storage areas, and loading/unloading operations of oil and gas which are easily exposed to fire and explosion. Hence, it is mainly necessary for this industry to adopt F&G detection systems to protect employees, plant assets, and the environment. 

Fire And Gas Detection System Market Size

Get a Customised Report as per your requirements for FREE!

The oil and gas segment was valued at USD 3.73 billion in 2018 and continued to grow until 2022. The global market in the oil and gas industry is expected to show significant growth due to factors such as the ongoing exploration of new oil and gas fields and refinery units and growing expansions in onshore and offshore production activities. Moreover, in APAC, the industry is estimated to rise during the forecast period, owing to the increasing demand for automobiles and, subsequently, the rising need for petrol and diesel. Hence, these factors are expected to drive the growth of the global market during the forecast period.

Type Segment Analysis:

Based on type, the market has been segmented into wired and wireless. The wired segment will account for the largest share of this segment.?Wired systems involve physical cables to transmit data between the different components of the system. These systems are mainly used in large industrial facilities, such as oil refineries, chemical plants, and power plants. In addition, where the distances between the different components of the system are too high for wireless communication to be reliable. However, the installation of wired systems is more expensive as compared to wireless systems, which also require more maintenance over time. Altogether, wired systems are often used in large industrial facilities because of their ability to transmit data over long distances which will help to drive the growth of the segment during the forecast period. 

Regional Analysis

Fire And Gas Detection System Market Share by Geography

For more insights on the market share of various regions View PDF Sample now!

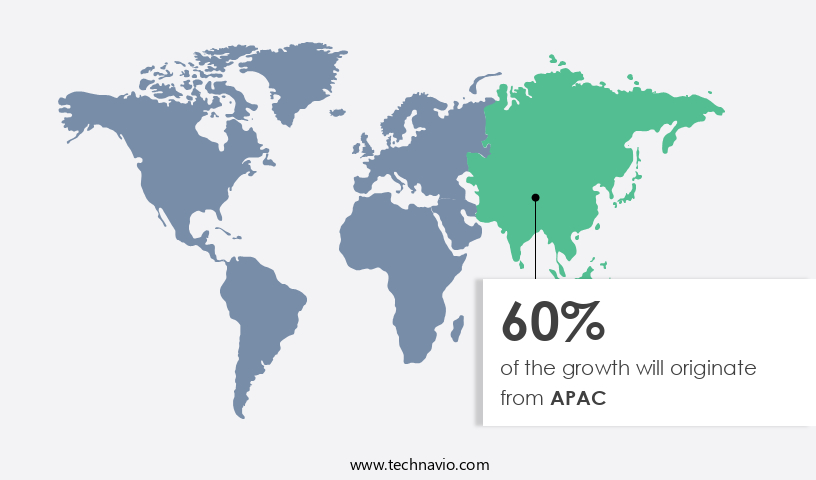
APAC is estimated to contribute 60% to the growth by 2028. Technavio’s analysts have elaborately explained the regional trends, drivers, and challenges that are expected to shape the market during the forecast period. In APAC, industries like oil and gas, chemical and petrochemical, and power generation are adopting wireless fire and gas detection products and solutions. The key factors for the market in APAC are the development of IoT and remote monitoring devices. Manufacturing from Asian manufacturers is expected to show a rapid growth rate during the forecast period due to the increase in the installation of gas pipelines. The original equipment manufacturers and manufacturers from the US and Western European countries are making partnerships with local or regional players, due to the industrial need for providing better safety and cost-effective wireless gas detection in APAC. Hence, such factors are driving the market in APAC during the forecast period.

Segment Overview

The market research report provides comprehensive data (region wise segment analysis), with forecasts and estimates in "USD Billion" for the period 2024 to 2028, as well as historical data from 2018 to 2022 for the following segments.

  • End-user Outlook
    • Oil and gas
    • Chemical
    • Pharmaceutical
    • Hotels and others
  • Type Outlook
    • Wired
    • Wireless
  • Region Outlook
    • North America
      • The U.S.
      • Canada
    • Europe
      • U.K.
      • Germany
      • France
      • Rest of Europe
    • APAC
      • China
      • India
    • South America
      • Chile 
      • Argentina
      • Brazil
    • Middle East & Africa
      • Saudi Arabia
      • South Africa
      • Rest of the Middle East & Africa

You may also interested in below market reports:

Market Analyst Overview

 The market encompasses a range of technologies designed to detect and alert occupants or operators of potential fires in various industries. Fire detectors, including smoke and heat detectors, play a crucial role in this market. Fire alarms, once triggered, provide audible alerts to evacuate or take necessary safety measures. Fireprone industrial environments such as power utilities, mining, petrochemical industry, oil and gas exploration industry, and construction-related projects, heavily rely on these systems for safety. Sustainability is a growing trend in the Fire Detection market, with a shift towards using recyclable and biodegradable materials like plant-based bioplastics and biodegradable polymers for manufacturing sustainable alarm and detection systems.

Moreover, integration of Fire safety regulations and technological developments are key drivers for market growth. The market landscape depends on Fire alarm, Audible alarms, Manual callpoint fire alarms, utility, Smart and connected technologies, Supply chain interruptions, Rapid urbanization, Fire protection systems, Cerberus Portal, NCHA, and Mega textile parks. Urbanization and industrialization have created a paradigm shift, with building managers and facility owners increasingly prioritizing fire safety. Cutting-edge technologies like smart home automation systems, energy-efficient products, and renewable energy sources are transforming the market. Installation, maintenance, and monitoring services are essential components of the Fire Safety Systems market, ensuring uninterrupted supply chain and project execution in fireprone industries.

Market Scope

Report Coverage

Details

Page number

180

Base year

2023

Historic period

2018 - 2022

Forecast period

2024-2028

Growth momentum & CAGR

Accelerate at a CAGR of 3.2%

Market growth 2024-2028

USD 2.32 billion

Market structure

Fragmented

YoY growth 2023-2024(%)

3.06

Regional analysis

APAC, North America, Europe, Middle East and Africa, and South America

Performing market contribution

APAC at 60%

Key countries

China, US, Germany, Russia, and India

Competitive landscape

Leading Companies, Market Positioning of Companies, Competitive Strategies, and Industry Risks

Key companies profiled

ABB Ltd., Agilent Technologies Inc., Carrier Global Corp., Dragerwerk AG and Co. KGaA, Emerson Electric Co., Engineering for Science and Industry Malta Ltd., Enmet LLC, GIL Automations Ltd., Halma Plc, HIMA GmbH, Honeywell International Inc., Johnson Controls International Plc., Kongsberg Gruppen ASA, MSA Safety Inc., Omega Integration Pte Ltd., Rockwell Automation Inc., Schneider Electric SE, Siemens AG, Teledyne Technologies Inc., and Yokogawa Electric Corp.

Market dynamics

Parent market analysis, Market forecasting , market forecast , Market growth inducers and obstacles, Fast-growing and slow-growing segment analysis, Market growth and Forecasting, COVID 19 impact and recovery analysis and future consumer dynamics, Market condition analysis for forecast period

Customization purview

If our report has not included the data that you are looking for, you can reach out to our analysts and get segments customized.

Request PDF sample

What are the Key Data Covered in this Market Research Report?

  • CAGR of the market during the forecast period
  • Detailed information on factors that will drive the market growth and forecasting of the market between 2023 and 2028
  • Precise estimation of the size of the market size and its contribution to the parent market
  • Accurate predictions about upcoming market trends and analysis and changes in consumer behavior
  • Growth of the market industry across Europe, North America, APAC, South America, and Middle East and Africa
  • Thorough market growth analysis of the market’s competitive landscape and detailed information about vendors
  • Comprehensive market analysis and report on the factors that will challenge the market research and growth of market vendors

We can help! Our analysts can customize this market research report to meet your requirements. Get in touch

1 Executive Summary

  • 1.1 Market overview
    • Executive Summary - Chart on Market Overview
    • Executive Summary - Data Table on Market Overview
    • Executive Summary - Chart on Global Market Characteristics
    • Executive Summary - Chart on Market by Geography
    • Executive Summary - Chart on Market Segmentation by End-user
    • Executive Summary - Chart on Market Segmentation by Type
    • Executive Summary - Chart on Incremental Growth
    • Executive Summary - Data Table on Incremental Growth
    • Executive Summary - Chart on Company Market Positioning

2 Market Landscape

  • 2.1 Market ecosystem
    • Parent Market
    • Data Table on - Parent Market
  • 2.2 Market characteristics
    • Market characteristics analysis
  • 2.3 Value chain analysis
    • Value Chain Analysis

3 Market Sizing

  • 3.1 Market definition
    • Offerings of companies included in the market definition
  • 3.2 Market segment analysis
    • Market segments
  • 3.3 Market size 2023
    • 3.4 Market outlook: Forecast for 2023-2028
      • Chart on Global - Market size and forecast 2023-2028 ($ million)
      • Data Table on Global - Market size and forecast 2023-2028 ($ million)
      • Chart on Global Market: Year-over-year growth 2023-2028 (%)
      • Data Table on Global Market: Year-over-year growth 2023-2028 (%)

    4 Historic Market Size

    • 4.1 Global Fire And Gas Detection System Market 2018 - 2022
      • Historic Market Size - Data Table on Global Fire And Gas Detection System Market 2018 - 2022 ($ million)
    • 4.2 End-user segment analysis 2018 - 2022
      • Historic Market Size - End-user Segment 2018 - 2022 ($ million)
    • 4.3 Type segment analysis 2018 - 2022
      • Historic Market Size - Type Segment 2018 - 2022 ($ million)
    • 4.4 Geography segment analysis 2018 - 2022
      • Historic Market Size - Geography Segment 2018 - 2022 ($ million)
    • 4.5 Country segment analysis 2018 - 2022
      • Historic Market Size - Country Segment 2018 - 2022 ($ million)

    5 Five Forces Analysis

    • 5.1 Five forces summary
      • Five forces analysis - Comparison between 2023 and 2028
    • 5.2 Bargaining power of buyers
      • Bargaining power of buyers - Impact of key factors 2023 and 2028
    • 5.3 Bargaining power of suppliers
      • Bargaining power of suppliers - Impact of key factors in 2023 and 2028
    • 5.4 Threat of new entrants
      • Threat of new entrants - Impact of key factors in 2023 and 2028
    • 5.5 Threat of substitutes
      • Threat of substitutes - Impact of key factors in 2023 and 2028
    • 5.6 Threat of rivalry
      • Threat of rivalry - Impact of key factors in 2023 and 2028
    • 5.7 Market condition
      • Chart on Market condition - Five forces 2023 and 2028

    6 Market Segmentation by End-user

    • 6.1 Market segments
      • Chart on End-user - Market share 2023-2028 (%)
      • Data Table on End-user - Market share 2023-2028 (%)
    • 6.2 Comparison by End-user
      • Chart on Comparison by End-user
      • Data Table on Comparison by End-user
    • 6.3 Oil and gas - Market size and forecast 2023-2028
      • Chart on Oil and gas - Market size and forecast 2023-2028 ($ million)
      • Data Table on Oil and gas - Market size and forecast 2023-2028 ($ million)
      • Chart on Oil and gas - Year-over-year growth 2023-2028 (%)
      • Data Table on Oil and gas - Year-over-year growth 2023-2028 (%)
    • 6.4 Chemical - Market size and forecast 2023-2028
      • Chart on Chemical - Market size and forecast 2023-2028 ($ million)
      • Data Table on Chemical - Market size and forecast 2023-2028 ($ million)
      • Chart on Chemical - Year-over-year growth 2023-2028 (%)
      • Data Table on Chemical - Year-over-year growth 2023-2028 (%)
    • 6.5 Pharmaceutical - Market size and forecast 2023-2028
      • Chart on Pharmaceutical - Market size and forecast 2023-2028 ($ million)
      • Data Table on Pharmaceutical - Market size and forecast 2023-2028 ($ million)
      • Chart on Pharmaceutical - Year-over-year growth 2023-2028 (%)
      • Data Table on Pharmaceutical - Year-over-year growth 2023-2028 (%)
    • 6.6 Others - Market size and forecast 2023-2028
      • Chart on Others - Market size and forecast 2023-2028 ($ million)
      • Data Table on Others - Market size and forecast 2023-2028 ($ million)
      • Chart on Others - Year-over-year growth 2023-2028 (%)
      • Data Table on Others - Year-over-year growth 2023-2028 (%)
    • 6.7 Market opportunity by End-user
      • Market opportunity by End-user ($ million)
      • Data Table on Market opportunity by End-user ($ million)

    7 Market Segmentation by Type

    • 7.1 Market segments
      • Chart on Type - Market share 2023-2028 (%)
      • Data Table on Type - Market share 2023-2028 (%)
    • 7.2 Comparison by Type
      • Chart on Comparison by Type
      • Data Table on Comparison by Type
    • 7.3 Wired - Market size and forecast 2023-2028
      • Chart on Wired - Market size and forecast 2023-2028 ($ million)
      • Data Table on Wired - Market size and forecast 2023-2028 ($ million)
      • Chart on Wired - Year-over-year growth 2023-2028 (%)
      • Data Table on Wired - Year-over-year growth 2023-2028 (%)
    • 7.4 Wireless - Market size and forecast 2023-2028
      • Chart on Wireless - Market size and forecast 2023-2028 ($ million)
      • Data Table on Wireless - Market size and forecast 2023-2028 ($ million)
      • Chart on Wireless - Year-over-year growth 2023-2028 (%)
      • Data Table on Wireless - Year-over-year growth 2023-2028 (%)
    • 7.5 Market opportunity by Type
      • Market opportunity by Type ($ million)
      • Data Table on Market opportunity by Type ($ million)

    8 Customer Landscape

    • 8.1 Customer landscape overview
      • Analysis of price sensitivity, lifecycle, customer purchase basket, adoption rates, and purchase criteria

    9 Geographic Landscape

    • 9.1 Geographic segmentation
      • Chart on Market share by geography 2023-2028 (%)
      • Data Table on Market share by geography 2023-2028 (%)
    • 9.2 Geographic comparison
      • Chart on Geographic comparison
      • Data Table on Geographic comparison
    • 9.3 APAC - Market size and forecast 2023-2028
      • Chart on APAC - Market size and forecast 2023-2028 ($ million)
      • Data Table on APAC - Market size and forecast 2023-2028 ($ million)
      • Chart on APAC - Year-over-year growth 2023-2028 (%)
      • Data Table on APAC - Year-over-year growth 2023-2028 (%)
    • 9.4 North America - Market size and forecast 2023-2028
      • Chart on North America - Market size and forecast 2023-2028 ($ million)
      • Data Table on North America - Market size and forecast 2023-2028 ($ million)
      • Chart on North America - Year-over-year growth 2023-2028 (%)
      • Data Table on North America - Year-over-year growth 2023-2028 (%)
    • 9.5 Europe - Market size and forecast 2023-2028
      • Chart on Europe - Market size and forecast 2023-2028 ($ million)
      • Data Table on Europe - Market size and forecast 2023-2028 ($ million)
      • Chart on Europe - Year-over-year growth 2023-2028 (%)
      • Data Table on Europe - Year-over-year growth 2023-2028 (%)
    • 9.6 Middle East and Africa - Market size and forecast 2023-2028
      • Chart on Middle East and Africa - Market size and forecast 2023-2028 ($ million)
      • Data Table on Middle East and Africa - Market size and forecast 2023-2028 ($ million)
      • Chart on Middle East and Africa - Year-over-year growth 2023-2028 (%)
      • Data Table on Middle East and Africa - Year-over-year growth 2023-2028 (%)
    • 9.7 South America - Market size and forecast 2023-2028
      • Chart on South America - Market size and forecast 2023-2028 ($ million)
      • Data Table on South America - Market size and forecast 2023-2028 ($ million)
      • Chart on South America - Year-over-year growth 2023-2028 (%)
      • Data Table on South America - Year-over-year growth 2023-2028 (%)
    • 9.8 China - Market size and forecast 2023-2028
      • Chart on China - Market size and forecast 2023-2028 ($ million)
      • Data Table on China - Market size and forecast 2023-2028 ($ million)
      • Chart on China - Year-over-year growth 2023-2028 (%)
      • Data Table on China - Year-over-year growth 2023-2028 (%)
    • 9.9 US - Market size and forecast 2023-2028
      • Chart on US - Market size and forecast 2023-2028 ($ million)
      • Data Table on US - Market size and forecast 2023-2028 ($ million)
      • Chart on US - Year-over-year growth 2023-2028 (%)
      • Data Table on US - Year-over-year growth 2023-2028 (%)
    • 9.10 Germany - Market size and forecast 2023-2028
      • Chart on Germany - Market size and forecast 2023-2028 ($ million)
      • Data Table on Germany - Market size and forecast 2023-2028 ($ million)
      • Chart on Germany - Year-over-year growth 2023-2028 (%)
      • Data Table on Germany - Year-over-year growth 2023-2028 (%)
    • 9.11 India - Market size and forecast 2023-2028
      • Chart on India - Market size and forecast 2023-2028 ($ million)
      • Data Table on India - Market size and forecast 2023-2028 ($ million)
      • Chart on India - Year-over-year growth 2023-2028 (%)
      • Data Table on India - Year-over-year growth 2023-2028 (%)
    • 9.12 Russia - Market size and forecast 2023-2028
      • Chart on Russia - Market size and forecast 2023-2028 ($ million)
      • Data Table on Russia - Market size and forecast 2023-2028 ($ million)
      • Chart on Russia - Year-over-year growth 2023-2028 (%)
      • Data Table on Russia - Year-over-year growth 2023-2028 (%)
    • 9.13 Market opportunity by geography
      • Market opportunity by geography ($ million)
      • Data Tables on Market opportunity by geography ($ million)

    10 Drivers, Challenges, and Opportunity/Restraints

    • 10.1 Market drivers
      • 10.2 Market challenges
        • 10.3 Impact of drivers and challenges
          • Impact of drivers and challenges in 2023 and 2028
        • 10.4 Market opportunities/restraints

          11 Competitive Landscape

          • 11.1 Overview
            • 11.2 Competitive Landscape
              • Overview on criticality of inputs and factors of differentiation
            • 11.3 Landscape disruption
              • Overview on factors of disruption
            • 11.4 Industry risks
              • Impact of key risks on business

            12 Competitive Analysis

            • 12.1 Companies profiled
              • Companies covered
            • 12.2 Market positioning of companies
              • Matrix on companies position and classification
            • 12.3 ABB Ltd.
              • ABB Ltd. - Overview
              • ABB Ltd. - Business segments
              • ABB Ltd. - Key news
              • ABB Ltd. - Key offerings
              • ABB Ltd. - Segment focus
            • 12.4 Dragerwerk AG and Co. KGaA
              • Dragerwerk AG and Co. KGaA - Overview
              • Dragerwerk AG and Co. KGaA - Business segments
              • Dragerwerk AG and Co. KGaA - Key news
              • Dragerwerk AG and Co. KGaA - Key offerings
              • Dragerwerk AG and Co. KGaA - Segment focus
            • 12.5 Emerson Electric Co.
              • Emerson Electric Co. - Overview
              • Emerson Electric Co. - Business segments
              • Emerson Electric Co. - Key news
              • Emerson Electric Co. - Key offerings
              • Emerson Electric Co. - Segment focus
            • 12.6 Engineering for Science and Industry Malta Ltd.
              • Engineering for Science and Industry Malta Ltd. - Overview
              • Engineering for Science and Industry Malta Ltd. - Product / Service
              • Engineering for Science and Industry Malta Ltd. - Key offerings
            • 12.7 GIL Automations Ltd.
              • GIL Automations Ltd. - Overview
              • GIL Automations Ltd. - Product / Service
              • GIL Automations Ltd. - Key offerings
            • 12.8 Halma Plc
              • Halma Plc - Overview
              • Halma Plc - Business segments
              • Halma Plc - Key news
              • Halma Plc - Key offerings
              • Halma Plc - Segment focus
            • 12.9 HIMA GmbH
              • HIMA GmbH - Overview
              • HIMA GmbH - Product / Service
              • HIMA GmbH - Key offerings
            • 12.10 Honeywell International Inc.
              • Honeywell International Inc. - Overview
              • Honeywell International Inc. - Business segments
              • Honeywell International Inc. - Key news
              • Honeywell International Inc. - Key offerings
              • Honeywell International Inc. - Segment focus
            • 12.11 Johnson Controls International Plc.
              • Johnson Controls International Plc. - Overview
              • Johnson Controls International Plc. - Business segments
              • Johnson Controls International Plc. - Key news
              • Johnson Controls International Plc. - Key offerings
              • Johnson Controls International Plc. - Segment focus
            • 12.12 Kongsberg Gruppen ASA
              • Kongsberg Gruppen ASA - Overview
              • Kongsberg Gruppen ASA - Business segments
              • Kongsberg Gruppen ASA - Key news
              • Kongsberg Gruppen ASA - Key offerings
              • Kongsberg Gruppen ASA - Segment focus
            • 12.13 MSA Safety Inc.
              • MSA Safety Inc. - Overview
              • MSA Safety Inc. - Business segments
              • MSA Safety Inc. - Key news
              • MSA Safety Inc. - Key offerings
              • MSA Safety Inc. - Segment focus
            • 12.14 Omega Integration Pte Ltd.
              • Omega Integration Pte Ltd. - Overview
              • Omega Integration Pte Ltd. - Product / Service
              • Omega Integration Pte Ltd. - Key offerings
            • 12.15 Rockwell Automation Inc.
              • Rockwell Automation Inc. - Overview
              • Rockwell Automation Inc. - Business segments
              • Rockwell Automation Inc. - Key news
              • Rockwell Automation Inc. - Key offerings
              • Rockwell Automation Inc. - Segment focus
            • 12.16 Schneider Electric SE
              • Schneider Electric SE - Overview
              • Schneider Electric SE - Business segments
              • Schneider Electric SE - Key news
              • Schneider Electric SE - Key offerings
              • Schneider Electric SE - Segment focus
            • 12.17 Siemens AG
              • Siemens AG - Overview
              • Siemens AG - Business segments
              • Siemens AG - Key news
              • Siemens AG - Key offerings
              • Siemens AG - Segment focus

            13 Appendix

            • 13.1 Scope of the report
              • 13.2 Inclusions and exclusions checklist
                • Inclusions checklist
                • Exclusions checklist
              • 13.3 Currency conversion rates for US$
                • Currency conversion rates for US$
              • 13.4 Research methodology
                • Research methodology
              • 13.5 Data procurement
                • Information sources
              • 13.6 Data validation
                • Data validation
              • 13.7 Validation techniques employed for market sizing
                • Validation techniques employed for market sizing
              • 13.8 Data synthesis
                • Data synthesis
              • 13.9 360 degree market analysis
                • 360 degree market analysis
              • 13.10 List of abbreviations
                • List of abbreviations

              Research Methodology

              Technavio presents a detailed picture of the market by way of study, synthesis, and summation of data from multiple sources. The analysts have presented the various facets of the market with a particular focus on identifying the key industry influencers. The data thus presented is comprehensive, reliable, and the result of extensive research, both primary and secondary.

              INFORMATION SOURCES

              Primary sources

              • Manufacturers and suppliers
              • Channel partners
              • Industry experts
              • Strategic decision makers

              Secondary sources

              • Industry journals and periodicals
              • Government data
              • Financial reports of key industry players
              • Historical data
              • Press releases

              DATA ANALYSIS

              Data Synthesis

              • Collation of data
              • Estimation of key figures
              • Analysis of derived insights

              Data Validation

              • Triangulation with data models
              • Reference against proprietary databases
              • Corroboration with industry experts

              REPORT WRITING

              Qualitative

              • Market drivers
              • Market challenges
              • Market trends
              • Five forces analysis

              Quantitative

              • Market size and forecast
              • Market segmentation
              • Geographical insights
              • Competitive landscape

              Interested in this report?

              Get your sample now to see our research methodology and insights!

              Download Now

              Frequently Asked Questions

              Fire And Gas Detection System market growth will increase by $ 2315.6 mn during 2024-2028.

              The Fire And Gas Detection System market is expected to grow at a CAGR of 3.2% during 2024-2028.

              Fire And Gas Detection System market is segmented by End-user( Oil and gas, Chemical, Pharmaceutical, Others) Type( Wired, Wireless, Europe, MEA, South America)

              ABB Ltd., Agilent Technologies Inc., Carrier Global Corp., Dragerwerk AG and Co. KGaA, Emerson Electric Co., Engineering for Science and Industry Malta Ltd., Enmet LLC, GIL Automations Ltd., Halma Plc, HIMA GmbH, Honeywell International Inc., Johnson Controls International Plc., Kongsberg Gruppen ASA, MSA Safety Inc., Omega Integration Pte Ltd., Rockwell Automation Inc., Schneider Electric SE, Siemens AG, Teledyne Technologies Inc., Yokogawa Electric Corp. are a few of the key vendors in the Fire And Gas Detection System market.

              APAC will register the highest growth rate of 60% among the other regions. Therefore, the Fire And Gas Detection System market in APAC is expected to garner significant business opportunities for the vendors during the forecast period.

              China, US, Germany, Russia, India

              • Rising production of shale gasShale has changed the structure of the oil and gas energy sector globally owing to the supply glut it brought into the market is the driving factor this market.
              • which eventually led to price drops. Unlike traditional natural gas is the driving factor this market.
              • shale gas exploration emits larger amounts of methane (CH4) and is the driving factor this market.
              • hence is the driving factor this market.
              • has a higher greenhouse gas footprint. CH4 is not only harmful to the environment but also a part of explosion hazards. In the US is the driving factor this market.
              • shale was a major game changer is the driving factor this market.
              • as it helped the country in becoming a net exporter of oil and gas. With advances in shale extraction and production technologies is the driving factor this market.
              • the production of shale gas in the US has been increasing rapidly. Similarly is the driving factor this market.
              • China is the driving factor this market.
              • another major player in shale gas and estimated to have large shale deposits is the driving factor this market.
              • witnessed a more than 50% rise in shale gas output. The increase in shale gas production from countries such as the US is the driving factor this market.
              • Russia is the driving factor this market.
              • Iran is the driving factor this market.
              • Qatar is the driving factor this market.
              • Canada is the driving factor this market.
              • China is the driving factor this market.
              • Norway is the driving factor this market.
              • and Saudi Arabia has increased the scope for the adoption of gas detection products and solutions. In addition is the driving factor this market.
              • the increased urge to minimize casualties and the rise in the number of government mandates have given rise to the adoption of the latest safety tools is the driving factor this market.
              • such as wireless gas detection products in the shale gas production processes is the driving factor this market.
              • owing to their functional benefits. For instance is the driving factor this market.
              • real-time monitoring using wireless gas detection solutions has reduced gas emission problems is the driving factor this market.
              • thereby efficiently safeguarding industrial plants and assets. Hence is the driving factor this market.
              • an increase in shale gas production will drive the global fire and gas detection system market during the forecast period. is the driving factor this market.

              The Fire And Gas Detection System market vendors should focus on grabbing business opportunities from the Oil and gas segment as it accounted for the largest market share in the base year.