Fire Hose Market Analysis, Size, and Forecast 2025-2029: North America (US and Canada), Europe (France, Germany, Italy, UK), APAC (China, India, Japan), Middle East and Africa (South Africa), and South America

Fire Hose Market Analysis, Size, and Forecast 2025-2029:
North America (US and Canada), Europe (France, Germany, Italy, UK), APAC (China, India, Japan), Middle East and Africa (South Africa), and South America

Published: Mar 2025 212 Pages SKU: IRTNTR70881

Market Overview at a Glance

$209.6 Mn
Market Opportunity
5.4%
CAGR
5.0
YoY growth 2024-2025(%)

Fire Hose Market Size 2025-2029

The fire hose market size is forecast to increase by USD 209.6 million, at a CAGR of 5.4% between 2024 and 2029.

  • The market is witnessing significant growth due to the increasing number of fire incidents worldwide. This trend is driven by various factors, including the rising investment in firefighting infrastructure to ensure public safety and prevent property damage. However, the high initial cost associated with fire hoses poses a significant challenge for market growth. Despite this obstacle, opportunities exist for companies to capitalize on the market's dynamics. By focusing on cost-effective solutions and collaborating with fire departments and emergency services, manufacturers can meet the growing demand for fire hoses while addressing budget constraints.
  • Additionally, innovation in materials and manufacturing processes could lead to more affordable yet durable hoses, making them accessible to a broader customer base. Companies that can navigate these challenges and offer competitive pricing and superior quality will thrive in this market.

What will be the Size of the Fire Hose Market during the forecast period?

Fire Hose Market Size

Explore in-depth regional segment analysis with market size data - historical 2019-2023 and forecasts 2025-2029 - in the full report.  
Request Free Sample

The market exhibits a continuous and evolving nature, with ongoing activities and patterns shaping its dynamics. Fire hose coupling plays a crucial role in ensuring seamless connection and efficient water flow during firefighting operations. Similarly, fire hose maintenance is essential for maintaining the durability and functionality of these vital safety systems. Single-jacket fire hoses are commonly used due to their flexibility and lightweight design, making them suitable for various applications. However, high-pressure scenarios necessitate the use of double-jacket fire hoses for enhanced protection and safety. Fire hose diameter is another critical factor, as larger diameters enable greater water flow and improved firefighting capabilities.

Fire prevention is a primary concern, with fire hoses being an integral component of fire safety regulations and water supply systems. Fire hose weight, flexibility, and material are essential factors in ensuring effective fire protection. Cotton fire hoses, for instance, offer excellent resistance to heat and abrasion, while synthetic materials provide flexibility and lightweight design. Fire hose nozzles and fittings are essential components, enabling precise water flow and direction during firefighting operations. Water pressure management and hydrant connections are also crucial, ensuring adequate water supply and pressure for effective fire suppression. Fire hose accessories, such as flow control valves and reels, facilitate efficient and safe storage and deployment of fire hoses.

Fire hose inspection, testing, and replacement are ongoing processes to ensure their continued functionality and safety. The market for fire hoses spans various sectors, including commercial, industrial, marine, and aircraft applications. Fire hose manufacturing and distribution are integral components of this dynamic market, with ongoing advancements in materials, design, and technology shaping its future.

How is this Fire Hose Industry segmented?

The fire hose industry research report provides comprehensive data (region-wise segment analysis), with forecasts and estimates in "USD million" for the period 2025-2029, as well as historical data from 2019-2023 for the following segments.

  • Product
    • Type 3
    • Type 2
    • Type 1
  • End-user
    • Municipal fire service
    • Commercial
    • Others
  • Distribution Channel
    • Direct sales
    • Indirect sales
  • Geography
    • North America
      • US
      • Canada
    • Europe
      • France
      • Germany
      • Italy
      • UK
    • Middle East and Africa
      • South Africa
    • APAC
      • China
      • India
      • Japan
    • Rest of World (ROW)

By Product Insights

The type 3 segment is estimated to witness significant growth during the forecast period.

The market encompasses various segments, with the high-pressure fire hose segment, specifically type 3 hoses, gaining prominence due to their robust construction and high capabilities. These hoses are essential for firefighting operations in industrial settings, municipal fire departments, and high-risk environments. Constructed with a double jacket of polyester or nylon, type 3 fire hoses offer enhanced resistance to abrasion, chemicals, and UV radiation. The increasing industrialization and urbanization necessitate advanced fire safety measures, leading to the segment's significant growth. Key players in this segment include Angus Fire, Mercedes Textiles, and All-American Hose, providing a range of type 3 fire hoses that adhere to stringent safety standards.

Water supply systems, fire hose cabinets, and fire suppression systems are integral components of the market. Fire hose training, emergency response, and fire hose replacement are essential aspects of fire safety regulations. Various fire hose materials, such as rubber, cotton, synthetic, and marine hoses, cater to diverse applications. Fire hose diameters, lengths, and pressure management are crucial factors in ensuring effective water delivery during emergencies. Fire hose reels, clamps, and fittings facilitate easy storage and maintenance. Fire hose testing, inspection, and certification are mandatory to ensure safety and compliance with industry standards, such as NFPA and UL.

Fire hose nozzles and valves enable precise flow control during firefighting operations. Fire hose accessories, such as hose whips, couplings, and braid, enhance hose performance and durability. Fire prevention, fire protection, and fire safety regulations are driving the demand for fire hoses in commercial, industrial, and residential applications. Low-pressure fire hoses are suitable for applications that require lower pressure, such as residential fire sprinkler systems. Foam fire hoses are used for extinguishing Class A, B, and C fires, while marine fire hoses are designed for use on boats and ships. Industrial fire hoses, aircraft fire hoses, and fire hose distribution networks cater to specialized applications.

Fire hose manufacturing companies adhere to strict quality control measures to ensure the production of high-performance and reliable fire hoses. Fire hose retailers and distributors play a crucial role in ensuring the availability of fire hoses to meet the demands of various industries and applications.

Fire Hose Market Size

Request Free Sample

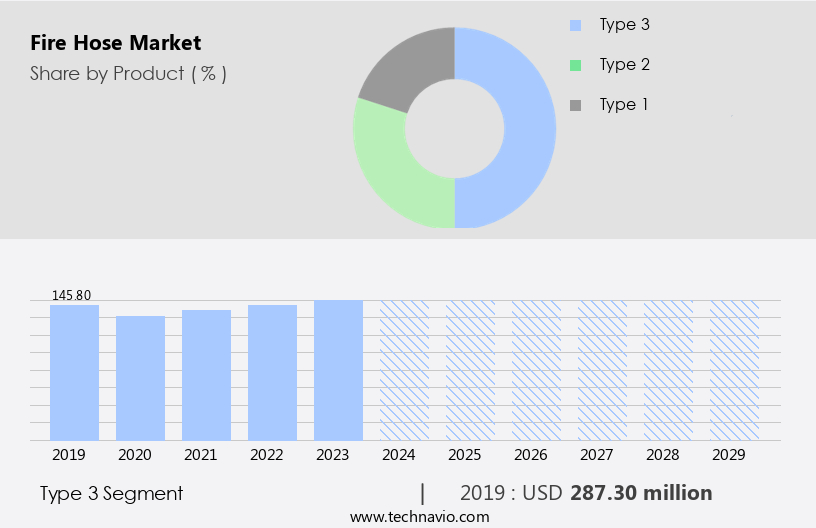
The Type 3 segment was valued at USD 287.30 million in 2019 and showed a gradual increase during the forecast period.
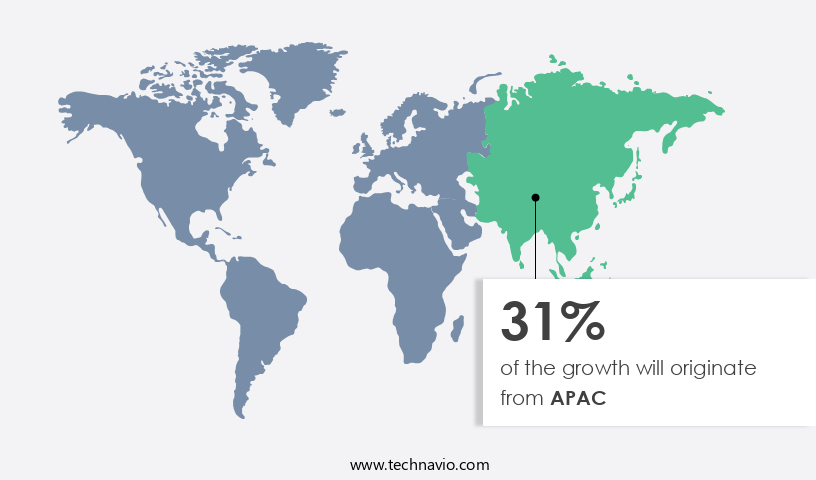
Regional Analysis

APAC is estimated to contribute 31% to the growth of the global market during the forecast period. Technavio's analysts have elaborately explained the regional trends and drivers that shape the market during the forecast period.

Fire Hose Market Share by Geography

 Request Free Sample

The market in North America is experiencing significant growth due to the increasing number of residential and commercial construction projects. In the US and Canada, manufacturing facility expansions and healthcare, hotel, and commercial building projects are driving market demand. The US has been a major recipient of foreign direct investment (FDI), particularly in the chemicals industry, which is contributing to the expansion of industries and subsequently increasing the demand for robust and reliable fire hose systems. These systems are essential for water supply systems, fire suppression systems, and emergency response situations. Fire hose materials, such as rubber and synthetic, are subjected to rigorous testing and manufacturing standards, including NFPA and UL, to ensure safety and durability.

Fire hose products, including high-pressure, low-pressure, foam, and industrial hoses, are utilized in various applications, from residential use to aircraft and marine applications. Fire hose accessories, such as clamps, reels, and nozzles, are also in high demand to ensure optimal fire hose performance and maintenance. The market trends include the development of fire hose systems with advanced features, such as improved flexibility, weight reduction, and enhanced fire protection. Fire hose manufacturers prioritize safety regulations and provide training to ensure proper usage and maintenance of their products. Overall, the market in North America is poised for continued growth due to the increasing demand for reliable and durable fire protection solutions.

Market Dynamics

Our researchers analyzed the data with 2024 as the base year, along with the key drivers, trends, and challenges. A holistic analysis of drivers will help companies refine their marketing strategies to gain a competitive advantage.

The market caters to the demand for specialized hoses used in firefighting applications. These hoses are engineered to deliver large volumes of water at high pressures, ensuring effective fire suppression. Fire hose manufacturers prioritize materials like rubber and thermoplastic for their durability and resistance to heat and fire. The market encompasses various types, including layflat hoses, firefighting hoses, and fire department hoses. Each type offers distinct advantages, such as flexibility, strength, and ease of use. Fire hose assemblies, couplings, and nozzles are essential components, ensuring a reliable connection and optimal water flow. Fire hose testing and certification play a crucial role in maintaining safety and quality standards. Innovations in fire hose technology include lightweight materials, improved flexibility, and enhanced durability, driving market growth. The market serves a vital role in protecting lives and property from the destructive effects of fire.

What are the key market drivers leading to the rise in the adoption of Fire Hose Industry?

  • The increasing prevalence of fire incidents serves as the primary catalyst for market growth. 
  • The market has experienced significant growth due to the increasing number of fire incidents, particularly wildfires, around the world. In 2023, wildfires in Canada and Greece resulted in unprecedented damage, with around 18 million hectares of land burned in Canada and the largest wildfire in the European Union recorded in Greece. The Copernicus Atmosphere Monitoring Service reported that these wildfires contributed to approximately 2,170 megatons of carbon emissions globally. The trend continued into 2024, with data indicating a rise in the prevalence and severity of forest fires. Fire safety regulations mandate the use of high-quality fire hoses for firefighting activities.
  • Fire hose manufacturing companies prioritize fire hose safety by adhering to fire hose standards such as UL standards. Fire hoses come in various types, including low-pressure fire hoses, foam fire hoses, and rubber fire hoses. Fire hose reels, pressure regulators, and fire hose clamps are essential accessories for effective fire hose usage. Regular fire hose testing is crucial for ensuring their functionality and safety during emergencies. Fire hose replacement is necessary when the hoses show signs of wear or damage.

What are the market trends shaping the Fire Hose Industry?

  • The increasing investment in firefighting infrastructure represents a significant market trend. This trend reflects a growing recognition of the importance of advanced firefighting systems to ensure public safety and protect assets from potential fires.
  • The market is experiencing substantial growth due to the increasing prioritization of fire prevention and fire protection measures. This growth can be attributed to the rising frequency and intensity of fires, necessitating advanced firefighting capabilities. Governments worldwide are recognizing the importance of investing in robust firefighting systems, leading to significant funding for equipment upgrades and training programs. For instance, in a recent development, the Canadian government allocated USD 280 million for firefighting infrastructure, comprising a USD 256 million equipment fund and a USD 24 million training fund. These investments are part of a larger initiative called Fighting and Managing Wildfires in a Changing Climate, aimed at enhancing wildfire management capabilities.
  • Fire hose maintenance, such as regular inspections and timely replacement of fire hose couplings, fire hose fittings, and fire hose nozzles, is crucial for optimal performance and safety. Single-jacket fire hoses, available in various diameters and weights, offer flexibility and are essential for effective water pressure management during firefighting operations. Fire hose accessories, including flow control valves and hydrant connections, play a vital role in managing water flow and ensuring efficient use of resources.

What challenges does the Fire Hose Industry face during its growth?

  • The high initial cost of fire hoses poses a significant challenge and significantly impacts the growth of the industry. 
  • The market is experiencing notable expansion due to the escalating demand for fire safety equipment in diverse industries. Fire hoses, particularly those utilized in municipal fire departments and industrial applications, are engineered to endure harsh conditions and deliver superior performance. However, the market is confronted with a significant challenge - the high initial cost of fire hoses. For instance, a double jacket fire hose, which is frequently employed for fire attacks and supply lines, can cost between USD 100 and USD 300 based on diameter and length. Companies like FireHoseDirect and TheFireStore cater to the market with a range of fire hose options, with prices influenced by the materials used and specific application requirements.
  • Fire hoses undergo rigorous inspections to ensure their functionality and longevity. Fire hose distribution networks ensure the timely delivery and availability of these essential safety products. Fire hose valves are a crucial component, enabling effective control of water flow during firefighting operations. Fire hose storage solutions are designed to maintain the integrity of the hoses, ensuring they are ready for immediate use when required. Both synthetic and industrial fire hoses are available in the market, with synthetic hoses offering lighter weight and greater flexibility, while industrial hoses provide enhanced durability and resistance to extreme temperatures and pressures. Marine fire hoses are specifically designed for use on watercraft, while aircraft fire hoses cater to the unique requirements of aviation safety.
  • Fire hose linings and braids contribute to the hoses' strength and resistance to wear and tear.

Exclusive Customer Landscape

The fire hose market forecasting report includes the adoption lifecycle of the market, covering from the innovator's stage to the laggard's stage. It focuses on adoption rates in different regions based on penetration. Furthermore, the fire hose market report also includes key purchase criteria and drivers of price sensitivity to help companies evaluate and develop their market growth analysis strategies.

Fire Hose Market Share by Geography

 Customer Landscape

Key Companies & Market Insights

Companies are implementing various strategies, such as strategic alliances, fire hose market forecast, partnerships, mergers and acquisitions, geographical expansion, and product/service launches, to enhance their presence in the industry.

Albert Ziegler GmbH - The company specializes in providing top-tier fire hose solutions, including the Euro-Star and Silberfuchs K2L and K2 models. 

The industry research and growth report includes detailed analyses of the competitive landscape of the market and information about key companies, including:

  • Albert Ziegler GmbH
  • Angus Fire Ltd.
  • Chhatariya Firetech Industries
  • Dixon Valve and Coupling Co. LLC
  • Dragerwerk AG and Co. KGaA
  • Exflame Fire Protection Pvt. Ltd.
  • Guardian Fire Equipment Inc.
  • Jakob Eschbach GmbH
  • KFH Industries Co.
  • Kuriyama of America Inc.
  • Mercedes Textiles Ltd.
  • National Fire Equipment Ltd.
  • NORTH AMERICAN FIRE HOSE CORP.
  • Parker Hannifin Corp.
  • Puck Enterprises
  • SINCO FIRE AND SECURITY CO. LTD.
  • Superior Fire Hose Corp.
  • Terraflex Industries Ltd.

Qualitative and quantitative analysis of companies has been conducted to help clients understand the wider business environment as well as the strengths and weaknesses of key industry players. Data is qualitatively analyzed to categorize companies as pure play, category-focused, industry-focused, and diversified; it is quantitatively analyzed to categorize companies as dominant, leading, strong, tentative, and weak.

Recent Development and News in Fire Hose Market

  • In January 2024, in a strategic move to expand its product offerings, FireSafe Technologies, a leading fire hose manufacturer, announced the launch of its new line of high-pressure fire hoses, designed for industrial applications. These hoses are lighter and more flexible than their predecessors, offering improved maneuverability and durability (FireSafe Technologies Press Release, 2024).
  • In March 2024, a major collaboration between FireFlex Corporation and HoseMaster, two key players in the market, was announced. The partnership aimed to develop advanced fire hose technologies, including the integration of AI and IoT in fire hose systems for enhanced safety and efficiency (Business Wire, 2024).
  • In May 2024, FireSafe Technologies secured a significant investment of USD25 million in a Series C funding round led by Sequoia Capital. The funds will be used to expand production capacity, accelerate research and development, and strengthen the company's global presence (FireSafe Technologies Press Release, 2024).
  • In April 2025, the European Union passed a new regulation mandating the use of fire hoses made from recycled materials in all new construction projects. This initiative is expected to significantly increase demand for eco-friendly fire hose solutions and create new opportunities for manufacturers (European Parliament Press Release, 2025).

Research Analyst Overview

  • The market encompasses a diverse range of products, each requiring rigorous inventory management and regulatory compliance. Fire hose longevity is a critical concern, with material science and polymer chemistry playing essential roles in enhancing hose durability and resistance to abrasion, UV radiation, and high temperatures. Product development in this sector focuses on improving hose performance and compliance with stringent safety standards. Effective supply chain management and hose line management are crucial for ensuring timely water delivery during emergencies. Hose certification and quality control processes are integral to maintaining hose performance and degradation levels within acceptable limits. Regulatory affairs and compliance standards are continually evolving, necessitating ongoing efforts in research and development.
  • Fire hose design and industrial safety are inextricably linked, with customer service and sales and marketing teams playing vital roles in ensuring the right hoses reach the right customers. Water delivery systems must meet specific technical specifications, including chemical resistance and hose performance evaluation. Hose performance degradation and deterioration are ongoing challenges, necessitating continuous testing and innovation. Fire departments and emergency services rely on reliable, high-performing fire hoses for their critical work. Distribution networks must be efficient and responsive to meet the unique demands of this sector. Hose performance data and testing results are essential for maintaining confidence in the reliability and safety of fire hoses.

Dive into Technavio's robust research methodology, blending expert interviews, extensive data synthesis, and validated models for unparalleled Fire Hose Market insights. See full methodology.

Market Scope

Report Coverage

Details

Page number

212

Base year

2024

Historic period

2019-2023

Forecast period

2025-2029

Growth momentum & CAGR

Accelerate at a CAGR of 5.4%

Market growth 2025-2029

USD 209.6 million

Market structure

Fragmented

YoY growth 2024-2025(%)

5.0

Key countries

US, China, UK, Germany, France, Japan, Canada, India, South Africa, and Italy

Competitive landscape

Leading Companies, Market Positioning of Companies, Competitive Strategies, and Industry Risks

Request Free Sample

What are the Key Data Covered in this Fire Hose Market Research and Growth Report?

  • CAGR of the Fire Hose industry during the forecast period
  • Detailed information on factors that will drive the growth and forecasting between 2025 and 2029
  • Precise estimation of the size of the market and its contribution of the industry in focus to the parent market
  • Accurate predictions about upcoming growth and trends and changes in consumer behaviour
  • Growth of the market across North America, Europe, APAC, Middle East and Africa, and South America
  • Thorough analysis of the market's competitive landscape and detailed information about companies
  • Comprehensive analysis of factors that will challenge the fire hose market growth of industry companies

We can help! Our analysts can customize this fire hose market research report to meet your requirements.

Get in touch

1 Executive Summary

  • 1.1 Market overview
    • Executive Summary - Chart on Market Overview
    • Executive Summary - Data Table on Market Overview
    • Executive Summary - Chart on Global Market Characteristics
    • Executive Summary - Chart on Market by Geography
    • Executive Summary - Chart on Market Segmentation by Product
    • Executive Summary - Chart on Market Segmentation by End-user
    • Executive Summary - Chart on Market Segmentation by Distribution Channel
    • Executive Summary - Chart on Incremental Growth
    • Executive Summary - Data Table on Incremental Growth
    • Executive Summary - Chart on Company Market Positioning

2 Technavio Analysis

  • 2.1 Analysis of price sensitivity, lifecycle, customer purchase basket, adoption rates, and purchase criteria
    • Analysis of price sensitivity, lifecycle, customer purchase basket, adoption rates, and purchase criteria
  • 2.2 Criticality of inputs and Factors of differentiation
    • Overview on criticality of inputs and factors of differentiation
  • 2.3 Factors of disruption
    • Overview on factors of disruption
  • 2.4 Impact of drivers and challenges
    • Impact of drivers and challenges in 2024 and 2029

3 Market Landscape

  • 3.1 Market ecosystem
    • Parent Market
    • Data Table on - Parent Market
  • 3.2 Market characteristics
    • Market characteristics analysis
  • 3.3 Value chain analysis
    • Value chain analysis

4 Market Sizing

  • 4.1 Market definition
    • Offerings of companies included in the market definition
  • 4.2 Market segment analysis
    • Market segments
  • 4.3 Market size 2024
    • 4.4 Market outlook: Forecast for 2024-2029
      • Chart on Global - Market size and forecast 2024-2029 ($ million)
      • Data Table on Global - Market size and forecast 2024-2029 ($ million)
      • Chart on Global Market: Year-over-year growth 2024-2029 (%)
      • Data Table on Global Market: Year-over-year growth 2024-2029 (%)

    5 Historic Market Size

    • 5.1 Global Fire Hose Market 2019 - 2023
      • Historic Market Size - Data Table on Global Fire Hose Market 2019 - 2023 ($ million)
    • 5.2 Product segment analysis 2019 - 2023
      • Historic Market Size - Product Segment 2019 - 2023 ($ million)
    • 5.3 End-user segment analysis 2019 - 2023
      • Historic Market Size - End-user Segment 2019 - 2023 ($ million)
    • 5.4 Distribution Channel segment analysis 2019 - 2023
      • Historic Market Size - Distribution Channel Segment 2019 - 2023 ($ million)
    • 5.5 Geography segment analysis 2019 - 2023
      • Historic Market Size - Geography Segment 2019 - 2023 ($ million)
    • 5.6 Country segment analysis 2019 - 2023
      • Historic Market Size - Country Segment 2019 - 2023 ($ million)

    6 Qualitative Analysis

    • 6.1 Impact of AI on Global Fire Hose Market

      7 Five Forces Analysis

      • 7.1 Five forces summary
        • Five forces analysis - Comparison between 2024 and 2029
      • 7.2 Bargaining power of buyers
        • Bargaining power of buyers - Impact of key factors 2024 and 2029
      • 7.3 Bargaining power of suppliers
        • Bargaining power of suppliers - Impact of key factors in 2024 and 2029
      • 7.4 Threat of new entrants
        • Threat of new entrants - Impact of key factors in 2024 and 2029
      • 7.5 Threat of substitutes
        • Threat of substitutes - Impact of key factors in 2024 and 2029
      • 7.6 Threat of rivalry
        • Threat of rivalry - Impact of key factors in 2024 and 2029
      • 7.7 Market condition
        • Chart on Market condition - Five forces 2024 and 2029

      8 Market Segmentation by Product

      • 8.1 Market segments
        • Chart on Product - Market share 2024-2029 (%)
        • Data Table on Product - Market share 2024-2029 (%)
      • 8.2 Comparison by Product
        • Chart on Comparison by Product
        • Data Table on Comparison by Product
      • 8.3 Type 3 - Market size and forecast 2024-2029
        • Chart on Type 3 - Market size and forecast 2024-2029 ($ million)
        • Data Table on Type 3 - Market size and forecast 2024-2029 ($ million)
        • Chart on Type 3 - Year-over-year growth 2024-2029 (%)
        • Data Table on Type 3 - Year-over-year growth 2024-2029 (%)
      • 8.4 Type 2 - Market size and forecast 2024-2029
        • Chart on Type 2 - Market size and forecast 2024-2029 ($ million)
        • Data Table on Type 2 - Market size and forecast 2024-2029 ($ million)
        • Chart on Type 2 - Year-over-year growth 2024-2029 (%)
        • Data Table on Type 2 - Year-over-year growth 2024-2029 (%)
      • 8.5 Type 1 - Market size and forecast 2024-2029
        • Chart on Type 1 - Market size and forecast 2024-2029 ($ million)
        • Data Table on Type 1 - Market size and forecast 2024-2029 ($ million)
        • Chart on Type 1 - Year-over-year growth 2024-2029 (%)
        • Data Table on Type 1 - Year-over-year growth 2024-2029 (%)
      • 8.6 Market opportunity by Product
        • Market opportunity by Product ($ million)
        • Data Table on Market opportunity by Product ($ million)

      9 Market Segmentation by End-user

      • 9.1 Market segments
        • Chart on End-user - Market share 2024-2029 (%)
        • Data Table on End-user - Market share 2024-2029 (%)
      • 9.2 Comparison by End-user
        • Chart on Comparison by End-user
        • Data Table on Comparison by End-user
      • 9.3 Municipal fire service - Market size and forecast 2024-2029
        • Chart on Municipal fire service - Market size and forecast 2024-2029 ($ million)
        • Data Table on Municipal fire service - Market size and forecast 2024-2029 ($ million)
        • Chart on Municipal fire service - Year-over-year growth 2024-2029 (%)
        • Data Table on Municipal fire service - Year-over-year growth 2024-2029 (%)
      • 9.4 Commercial - Market size and forecast 2024-2029
        • Chart on Commercial - Market size and forecast 2024-2029 ($ million)
        • Data Table on Commercial - Market size and forecast 2024-2029 ($ million)
        • Chart on Commercial - Year-over-year growth 2024-2029 (%)
        • Data Table on Commercial - Year-over-year growth 2024-2029 (%)
      • 9.5 Others - Market size and forecast 2024-2029
        • Chart on Others - Market size and forecast 2024-2029 ($ million)
        • Data Table on Others - Market size and forecast 2024-2029 ($ million)
        • Chart on Others - Year-over-year growth 2024-2029 (%)
        • Data Table on Others - Year-over-year growth 2024-2029 (%)
      • 9.6 Market opportunity by End-user
        • Market opportunity by End-user ($ million)
        • Data Table on Market opportunity by End-user ($ million)

      10 Market Segmentation by Distribution Channel

      • 10.1 Market segments
        • Chart on Distribution Channel - Market share 2024-2029 (%)
        • Data Table on Distribution Channel - Market share 2024-2029 (%)
      • 10.2 Comparison by Distribution Channel
        • Chart on Comparison by Distribution Channel
        • Data Table on Comparison by Distribution Channel
      • 10.3 Direct sales - Market size and forecast 2024-2029
        • Chart on Direct sales - Market size and forecast 2024-2029 ($ million)
        • Data Table on Direct sales - Market size and forecast 2024-2029 ($ million)
        • Chart on Direct sales - Year-over-year growth 2024-2029 (%)
        • Data Table on Direct sales - Year-over-year growth 2024-2029 (%)
      • 10.4 Indirect sales - Market size and forecast 2024-2029
        • Chart on Indirect sales - Market size and forecast 2024-2029 ($ million)
        • Data Table on Indirect sales - Market size and forecast 2024-2029 ($ million)
        • Chart on Indirect sales - Year-over-year growth 2024-2029 (%)
        • Data Table on Indirect sales - Year-over-year growth 2024-2029 (%)
      • 10.5 Market opportunity by Distribution Channel
        • Market opportunity by Distribution Channel ($ million)
        • Data Table on Market opportunity by Distribution Channel ($ million)

      11 Customer Landscape

      • 11.1 Customer landscape overview
        • Analysis of price sensitivity, lifecycle, customer purchase basket, adoption rates, and purchase criteria

      12 Geographic Landscape

      • 12.1 Geographic segmentation
        • Chart on Market share by geography 2024-2029 (%)
        • Data Table on Market share by geography 2024-2029 (%)
      • 12.2 Geographic comparison
        • Chart on Geographic comparison
        • Data Table on Geographic comparison
      • 12.3 North America - Market size and forecast 2024-2029
        • Chart on North America - Market size and forecast 2024-2029 ($ million)
        • Data Table on North America - Market size and forecast 2024-2029 ($ million)
        • Chart on North America - Year-over-year growth 2024-2029 (%)
        • Data Table on North America - Year-over-year growth 2024-2029 (%)
      • 12.4 Europe - Market size and forecast 2024-2029
        • Chart on Europe - Market size and forecast 2024-2029 ($ million)
        • Data Table on Europe - Market size and forecast 2024-2029 ($ million)
        • Chart on Europe - Year-over-year growth 2024-2029 (%)
        • Data Table on Europe - Year-over-year growth 2024-2029 (%)
      • 12.5 APAC - Market size and forecast 2024-2029
        • Chart on APAC - Market size and forecast 2024-2029 ($ million)
        • Data Table on APAC - Market size and forecast 2024-2029 ($ million)
        • Chart on APAC - Year-over-year growth 2024-2029 (%)
        • Data Table on APAC - Year-over-year growth 2024-2029 (%)
      • 12.6 Middle East and Africa - Market size and forecast 2024-2029
        • Chart on Middle East and Africa - Market size and forecast 2024-2029 ($ million)
        • Data Table on Middle East and Africa - Market size and forecast 2024-2029 ($ million)
        • Chart on Middle East and Africa - Year-over-year growth 2024-2029 (%)
        • Data Table on Middle East and Africa - Year-over-year growth 2024-2029 (%)
      • 12.7 South America - Market size and forecast 2024-2029
        • Chart on South America - Market size and forecast 2024-2029 ($ million)
        • Data Table on South America - Market size and forecast 2024-2029 ($ million)
        • Chart on South America - Year-over-year growth 2024-2029 (%)
        • Data Table on South America - Year-over-year growth 2024-2029 (%)
      • 12.8 US - Market size and forecast 2024-2029
        • Chart on US - Market size and forecast 2024-2029 ($ million)
        • Data Table on US - Market size and forecast 2024-2029 ($ million)
        • Chart on US - Year-over-year growth 2024-2029 (%)
        • Data Table on US - Year-over-year growth 2024-2029 (%)
      • 12.9 China - Market size and forecast 2024-2029
        • Chart on China - Market size and forecast 2024-2029 ($ million)
        • Data Table on China - Market size and forecast 2024-2029 ($ million)
        • Chart on China - Year-over-year growth 2024-2029 (%)
        • Data Table on China - Year-over-year growth 2024-2029 (%)
      • 12.10 UK - Market size and forecast 2024-2029
        • Chart on UK - Market size and forecast 2024-2029 ($ million)
        • Data Table on UK - Market size and forecast 2024-2029 ($ million)
        • Chart on UK - Year-over-year growth 2024-2029 (%)
        • Data Table on UK - Year-over-year growth 2024-2029 (%)
      • 12.11 Germany - Market size and forecast 2024-2029
        • Chart on Germany - Market size and forecast 2024-2029 ($ million)
        • Data Table on Germany - Market size and forecast 2024-2029 ($ million)
        • Chart on Germany - Year-over-year growth 2024-2029 (%)
        • Data Table on Germany - Year-over-year growth 2024-2029 (%)
      • 12.12 Japan - Market size and forecast 2024-2029
        • Chart on Japan - Market size and forecast 2024-2029 ($ million)
        • Data Table on Japan - Market size and forecast 2024-2029 ($ million)
        • Chart on Japan - Year-over-year growth 2024-2029 (%)
        • Data Table on Japan - Year-over-year growth 2024-2029 (%)
      • 12.13 France - Market size and forecast 2024-2029
        • Chart on France - Market size and forecast 2024-2029 ($ million)
        • Data Table on France - Market size and forecast 2024-2029 ($ million)
        • Chart on France - Year-over-year growth 2024-2029 (%)
        • Data Table on France - Year-over-year growth 2024-2029 (%)
      • 12.14 Canada - Market size and forecast 2024-2029
        • Chart on Canada - Market size and forecast 2024-2029 ($ million)
        • Data Table on Canada - Market size and forecast 2024-2029 ($ million)
        • Chart on Canada - Year-over-year growth 2024-2029 (%)
        • Data Table on Canada - Year-over-year growth 2024-2029 (%)
      • 12.15 India - Market size and forecast 2024-2029
        • Chart on India - Market size and forecast 2024-2029 ($ million)
        • Data Table on India - Market size and forecast 2024-2029 ($ million)
        • Chart on India - Year-over-year growth 2024-2029 (%)
        • Data Table on India - Year-over-year growth 2024-2029 (%)
      • 12.16 Italy - Market size and forecast 2024-2029
        • Chart on Italy - Market size and forecast 2024-2029 ($ million)
        • Data Table on Italy - Market size and forecast 2024-2029 ($ million)
        • Chart on Italy - Year-over-year growth 2024-2029 (%)
        • Data Table on Italy - Year-over-year growth 2024-2029 (%)
      • 12.17 South Africa - Market size and forecast 2024-2029
        • Chart on South Africa - Market size and forecast 2024-2029 ($ million)
        • Data Table on South Africa - Market size and forecast 2024-2029 ($ million)
        • Chart on South Africa - Year-over-year growth 2024-2029 (%)
        • Data Table on South Africa - Year-over-year growth 2024-2029 (%)
      • 12.18 Market opportunity by geography
        • Market opportunity by geography ($ million)
        • Data Tables on Market opportunity by geography ($ million)

      13 Drivers, Challenges, and Opportunity/Restraints

      • 13.1 Market drivers
        • 13.2 Market challenges
          • 13.3 Impact of drivers and challenges
            • Impact of drivers and challenges in 2024 and 2029
          • 13.4 Market opportunities/restraints

            14 Competitive Landscape

            • 14.1 Overview
              • 14.2 Competitive Landscape
                • Overview on criticality of inputs and factors of differentiation
              • 14.3 Landscape disruption
                • Overview on factors of disruption
              • 14.4 Industry risks
                • Impact of key risks on business

              15 Competitive Analysis

              • 15.1 Companies profiled
                • Companies covered
              • 15.2 Company ranking index
                • Company ranking index
              • 15.3 Market positioning of companies
                • Matrix on companies position and classification
              • 15.4 Albert Ziegler GmbH
                • Albert Ziegler GmbH - Overview
                • Albert Ziegler GmbH - Product / Service
                • Albert Ziegler GmbH - Key offerings
                • SWOT
              • 15.5 Angus Fire Ltd.
                • Angus Fire Ltd. - Overview
                • Angus Fire Ltd. - Product / Service
                • Angus Fire Ltd. - Key offerings
                • SWOT
              • 15.6 Dixon Valve and Coupling Co. LLC
                • Dixon Valve and Coupling Co. LLC  - Overview
                • Dixon Valve and Coupling Co. LLC  - Product / Service
                • Dixon Valve and Coupling Co. LLC  - Key offerings
                • SWOT
              • 15.7 Dragerwerk AG and Co. KGaA
                • Dragerwerk AG and Co. KGaA - Overview
                • Dragerwerk AG and Co. KGaA - Business segments
                • Dragerwerk AG and Co. KGaA - Key offerings
                • Dragerwerk AG and Co. KGaA - Segment focus
                • SWOT
              • 15.8 Guardian Fire Equipment Inc.
                • Guardian Fire Equipment Inc. - Overview
                • Guardian Fire Equipment Inc. - Product / Service
                • Guardian Fire Equipment Inc. - Key offerings
                • SWOT
              • 15.9 Jakob Eschbach GmbH
                • Jakob Eschbach GmbH - Overview
                • Jakob Eschbach GmbH - Product / Service
                • Jakob Eschbach GmbH - Key offerings
                • SWOT
              • 15.10 KFH Industries Co.
                • KFH Industries Co. - Overview
                • KFH Industries Co. - Product / Service
                • KFH Industries Co. - Key offerings
                • SWOT
              • 15.11 Kuriyama of America Inc.
                • Kuriyama of America Inc. - Overview
                • Kuriyama of America Inc. - Product / Service
                • Kuriyama of America Inc. - Key offerings
                • SWOT
              • 15.12 Mercedes Textiles Ltd.
                • Mercedes Textiles Ltd. - Overview
                • Mercedes Textiles Ltd. - Product / Service
                • Mercedes Textiles Ltd. - Key offerings
                • SWOT
              • 15.13 National Fire Equipment Ltd.
                • National Fire Equipment Ltd. - Overview
                • National Fire Equipment Ltd. - Product / Service
                • National Fire Equipment Ltd. - Key offerings
                • SWOT
              • 15.14 NORTH AMERICAN FIRE HOSE CORP.
                • NORTH AMERICAN FIRE HOSE CORP. - Overview
                • NORTH AMERICAN FIRE HOSE CORP. - Product / Service
                • NORTH AMERICAN FIRE HOSE CORP. - Key offerings
                • SWOT
              • 15.15 Puck Enterprises
                • Puck Enterprises - Overview
                • Puck Enterprises - Product / Service
                • Puck Enterprises - Key offerings
                • SWOT
              • 15.16 Superior Fire Hose Corp.
                • Superior Fire Hose Corp. - Overview
                • Superior Fire Hose Corp. - Product / Service
                • Superior Fire Hose Corp. - Key offerings
                • SWOT
              • 15.17 Terraflex Industries Ltd.
                • Terraflex Industries Ltd. - Overview
                • Terraflex Industries Ltd. - Product / Service
                • Terraflex Industries Ltd. - Key offerings
                • SWOT

              16 Appendix

              • 16.1 Scope of the report
                • 16.2 Inclusions and exclusions checklist
                  • Inclusions checklist
                  • Exclusions checklist
                • 16.3 Currency conversion rates for US$
                  • Currency conversion rates for US$
                • 16.4 Research methodology
                  • Research methodology
                • 16.5 Data procurement
                  • Information sources
                • 16.6 Data validation
                  • Data validation
                • 16.7 Validation techniques employed for market sizing
                  • Validation techniques employed for market sizing
                • 16.8 Data synthesis
                  • Data synthesis
                • 16.9 360 degree market analysis
                  • 360 degree market analysis
                • 16.10 List of abbreviations
                  • List of abbreviations

                Research Methodology

                Technavio presents a detailed picture of the market by way of study, synthesis, and summation of data from multiple sources. The analysts have presented the various facets of the market with a particular focus on identifying the key industry influencers. The data thus presented is comprehensive, reliable, and the result of extensive research, both primary and secondary.

                INFORMATION SOURCES

                Primary sources

                • Manufacturers and suppliers
                • Channel partners
                • Industry experts
                • Strategic decision makers

                Secondary sources

                • Industry journals and periodicals
                • Government data
                • Financial reports of key industry players
                • Historical data
                • Press releases

                DATA ANALYSIS

                Data Synthesis

                • Collation of data
                • Estimation of key figures
                • Analysis of derived insights

                Data Validation

                • Triangulation with data models
                • Reference against proprietary databases
                • Corroboration with industry experts

                REPORT WRITING

                Qualitative

                • Market drivers
                • Market challenges
                • Market trends
                • Five forces analysis

                Quantitative

                • Market size and forecast
                • Market segmentation
                • Geographical insights
                • Competitive landscape

                Interested in this report?

                Get your sample now to see our research methodology and insights!

                Download Now

                Frequently Asked Questions

                Fire Hose market growth will increase by $ 209.6 mn during 2025-2029 .

                The Fire Hose market is expected to grow at a CAGR of 5.4% during 2025-2029 .

                Fire Hose market is segmented by Product( Type 3, Type 2, Type 1) End-user( Municipal fire service, Commercial, Others) Distribution Channel( Direct sales, Indirect sales, APAC, Middle East and Africa, South America)

                Albert Ziegler GmbH, Angus Fire Ltd., Chhatariya Firetech Industries, Dixon Valve and Coupling Co. LLC, Dragerwerk AG and Co. KGaA, Exflame Fire Protection Pvt. Ltd., Guardian Fire Equipment Inc., Jakob Eschbach GmbH, KFH Industries Co., Kuriyama of America Inc., Mercedes Textiles Ltd., National Fire Equipment Ltd., NORTH AMERICAN FIRE HOSE CORP., Parker Hannifin Corp., Puck Enterprises, SINCO FIRE AND SECURITY CO. LTD., Superior Fire Hose Corp., Terraflex Industries Ltd. are a few of the key vendors in the Fire Hose market.

                APAC will register the highest growth rate of 31% among the other regions. Therefore, the Fire Hose market in APAC is expected to garner significant business opportunities for the vendors during the forecast period.

                US, China, UK, Germany, France, Japan, Canada, India, South Africa, Italy

                • Rising in number of fire incidentsIn recent years is the driving factor this market.
                • fire incidents have positively influenced the global fire hose market is the driving factor this market.
                • with some of the most intense wildfire activities. In 2023 is the driving factor this market.
                • Canada experienced unprecedented wildfire activity is the driving factor this market.
                • with fires engulfing around 18 million hectares of land is the driving factor this market.
                • resulting in record-breaking carbon emissions. This year also saw Greece facing the largest wildfire in the European Union to date. The Copernicus Atmosphere Monitoring Service reported that global wildfires generated approximately 2 is the driving factor this market.
                • 170 megatons of carbon emissions in 2023 is the driving factor this market.
                • with Canadian wildfires accounting for 22% of this total. The trend continued into 2024 is the driving factor this market.
                • with data indicating that forest fires are becoming more widespread and severe. The World Resources Institute highlighted that forest fires now result in nearly 6 million more hectares of tree cover loss per year compared to two decades ago. This increase in fire activity is largely attributed to climate change is the driving factor this market.
                • which has created hotter and drier conditions is the driving factor this market.
                • making forests more susceptible to fires.The economic impact of these fire incidents is profound. The destruction of vast forest areas not only leads to significant carbon emissions but also affects the timber industry is the driving factor this market.
                • agriculture is the driving factor this market.
                • and tourism. For instance is the driving factor this market.
                • the wildfires in Canada disrupted timber production is the driving factor this market.
                • leading to increased prices and supply chain issues. Similarly is the driving factor this market.
                • the fires in Greece affected the tourism sector is the driving factor this market.
                • as popular destinations were engulfed in flames is the driving factor this market.
                • deterring visitors and causing substantial economic losses. Moreover is the driving factor this market.
                • the increased frequency and intensity of fires have prompted governments and organizations to invest heavily in fire prevention and management technologies. This includes advanced monitoring systems is the driving factor this market.
                • firefighting equipment is the driving factor this market.
                • and research into fire-resistant materials. Thus is the driving factor this market.
                • such factors are expected to increase the demand for fire hoses is the driving factor this market.
                • which will propel the growth of the market in focus during the forecast period. is the driving factor this market.

                The Fire Hose market vendors should focus on grabbing business opportunities from the Type 3 segment as it accounted for the largest market share in the base year.