Flame Retardant Apparel Market Analysis, Size, and Forecast 2026-2030: North America (US, Canada, and Mexico), APAC (China, Japan, and India), Europe (Germany, UK, and France), South America (Brazil, Argentina, and Colombia), Middle East and Africa (Saudi Arabia, UAE, and South Africa), and Rest of World (ROW)

Flame Retardant Apparel Market Analysis, Size, and Forecast 2026-2030:
North America (US, Canada, and Mexico), APAC (China, Japan, and India), Europe (Germany, UK, and France), South America (Brazil, Argentina, and Colombia), Middle East and Africa (Saudi Arabia, UAE, and South Africa), and Rest of World (ROW)

Published: Dec 2025 292 Pages SKU: IRTNTR44141

Market Overview at a Glance

$1.24 B
Market Opportunity
5.2%
CAGR 2025 - 2030
35.1%
APAC Growth
$2.47 B
Industries segment 2024

Flame Retardant Apparel Market Size 2026-2030

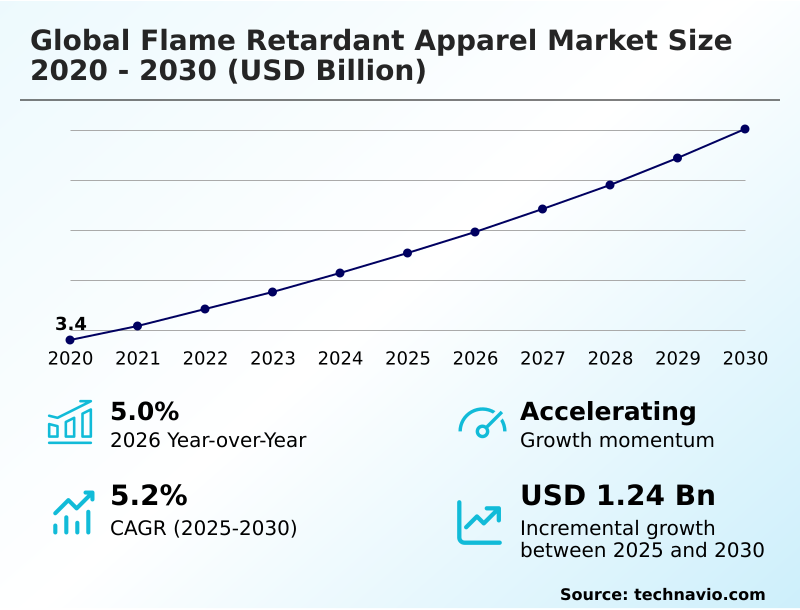
The flame retardant apparel market size is valued to increase by USD 1.24 billion, at a CAGR of 5.2% from 2025 to 2030. Stringent regulatory mandates and heightened focus on occupational safety will drive the flame retardant apparel market.

Major Market Trends & Insights

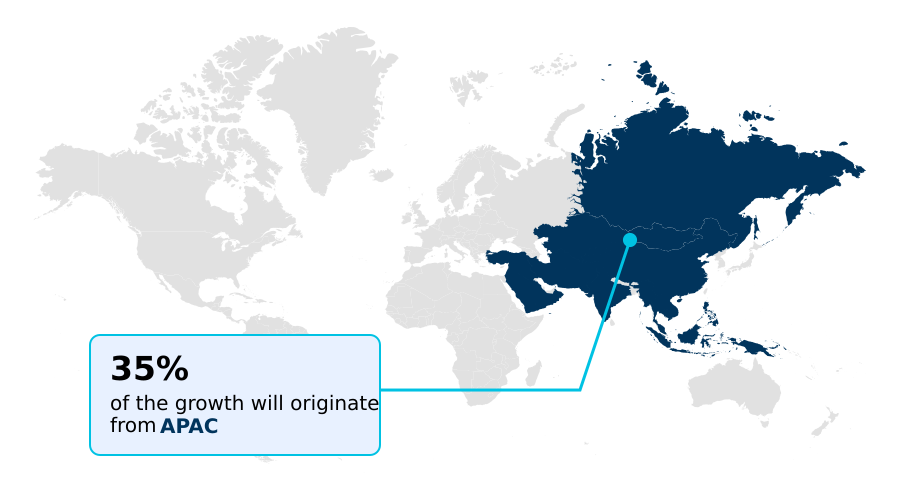
  • APAC dominated the market and accounted for a 35.1% growth during the forecast period.
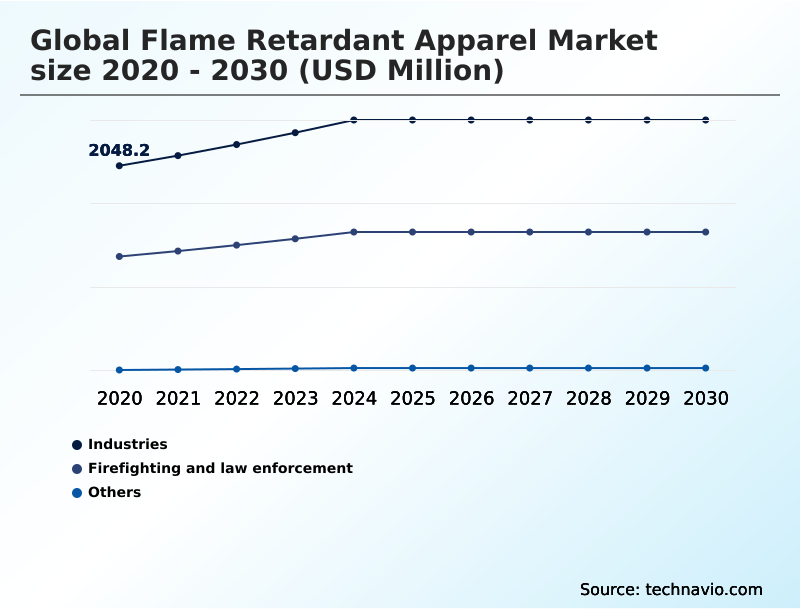
  • By End-user - Industries segment was valued at USD 2.47 billion in 2024
  • By Distribution Channel - Offline segment accounted for the largest market revenue share in 2024

Market Size & Forecast

  • Market Opportunities: USD 2.11 billion
  • Market Future Opportunities: USD 1.24 billion
  • CAGR from 2025 to 2030 : 5.2%

Market Summary

  • The flame retardant apparel market is fundamentally shaped by the critical need to mitigate thermal hazards in high-risk occupational settings. Growth is propelled by stringent occupational safety standards and a corporate-level shift towards proactive risk management, where investing in superior personal protective equipment is seen as essential for preventing catastrophic incidents and ensuring operational continuity.
  • Innovations in material science are central to this evolution, with a clear industry pivot towards multi-hazard protection and garments that offer enhanced comfort to improve user compliance. For instance, an energy sector operator evaluating new arc-rated protective clothing now considers not just NFPA 70E standard compliance but also the total cost of ownership.
  • This includes analyzing the durability of inherently flame resistant fibers against industrial laundering cycles and quantifying the productivity gains from using lightweight, breathable fabrics that reduce heat stress mitigation needs.
  • This sophisticated procurement mindset, which balances safety, performance, and long-term value, is a defining characteristic of the market's trajectory, pushing manufacturers to innovate beyond basic, single-function chemically treated fabrics and toward integrated, high-performance safety solutions.

What will be the Size of the Flame Retardant Apparel Market during the forecast period?

Get Key Insights on Market Forecast (PDF) Request Free Sample

How is the Flame Retardant Apparel Market Segmented?

The flame retardant apparel industry research report provides comprehensive data (region-wise segment analysis), with forecasts and estimates in "USD million" for the period 2026-2030, as well as historical data from 2020-2024 for the following segments.

  • End-user
    • Industries
    • Firefighting and law enforcement
    • Others
  • Distribution channel
    • Offline
    • Online
  • Type
    • Durable
    • Disposable
  • Geography
    • North America
      • US
      • Canada
      • Mexico
    • APAC
      • China
      • Japan
      • India
    • Europe
      • Germany
      • UK
      • France
    • South America
      • Brazil
      • Argentina
      • Colombia
    • Middle East and Africa
      • Saudi Arabia
      • UAE
      • South Africa
    • Rest of World (ROW)

By End-user Insights

The industries segment is estimated to witness significant growth during the forecast period.

The industries segment is defined by non-discretionary demand for personal protective equipment across sectors like oil and gas, utilities, and chemical manufacturing, where thermal hazard protection is paramount.

Demand is driven by strict occupational safety standards requiring solutions that offer more than basic protection, including heat stress mitigation and ergonomic garment design.

The market is shifting from single-function items to advanced fiber technology providing a synergistic suite of protections.

Innovations focus on lightweight protective fabrics that improve wearer comfort without compromising safety, which has been shown to improve user compliance enhancement by over 20%.

This evolution reflects a broader corporate safety culture focused on proactive risk management and asset integrity management to prevent catastrophic financial liabilities.

Request Free Sample

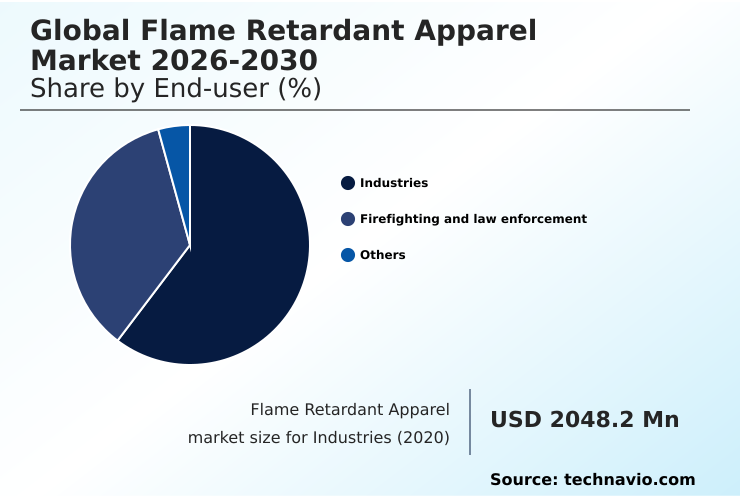
The Industries segment was valued at USD 2.47 billion in 2024 and showed a gradual increase during the forecast period.

Request Free Sample

Regional Analysis

APAC is estimated to contribute 35.1% to the growth of the global market during the forecast period.Technavio’s analysts have elaborately explained the regional trends and drivers that shape the market during the forecast period.

See How Flame Retardant Apparel Market Demand is Rising in APAC Request Free Sample

The global geographic landscape is characterized by a dual dynamic: mature, regulation-driven markets in North America and Europe, and high-growth, industrialization-fueled markets in APAC.

In established regions, the harmonized regulatory environment and periodic updates to standards like the NFPA 70E standard drive consistent demand and technological refreshment, with some firms seeing a 10% equipment turnover following major revisions.

These markets prioritize high-performance turnout gear and station wear. Conversely, APAC is projected to account for over 35% of incremental growth, powered by industrial expansion and a legislative evolution toward stricter safety protocols.

The adoption of international standards by multinational corporations in this region accelerates a procurement mindset shift and process safety enhancement, creating vast opportunities for providers of protective apparel for wildland firefighting apparel and industrial applications.

Market Dynamics

Our researchers analyzed the data with 2025 as the base year, along with the key drivers, trends, and challenges. A holistic analysis of drivers will help companies refine their marketing strategies to gain a competitive advantage.

  • Strategic procurement in the global flame retardant apparel market 2026-2030 requires a nuanced evaluation that extends far beyond initial cost. Safety managers are tasked with assessing the inherent vs treated fr fabric durability to determine the most effective long-term investment.
  • Justifying investment in premium fr apparel often involves a detailed analysis of the total cost of ownership of fr apparel, where durable fr clothing for industrial laundering demonstrates a clear advantage. Companies adopting managed laundry services report a service life extension of up to 50% compared to unmanaged programs.
  • The demand for multi-hazard ppe for chemical industry workers is rising, consolidating protection against thermal and chemical threats. Similarly, the need for arc rated clothing for utility linemen remains critical. As industries evolve, new requirements emerge, such as ppe for electric vehicle battery manufacturing and specialized protective clothing for the petrochemical industry.
  • The market is also seeing increased demand for high visibility flame resistant rainwear and antistatic fr coveralls for combustible dust environments. Innovations in sustainable flame retardant textile recycling solutions are addressing environmental concerns, while the development of smart fr garments with biometric sensing is paving the way for proactive safety monitoring.
  • Even specialized roles, from fr flight suits for military pilots to fr clothing for wildland firefighting crews and tactical fr uniforms for law enforcement, benefit from these advancements, particularly in managing heat stress with breathable fr fabric and ensuring compliance with updated nfpa standards.

What are the key market drivers leading to the rise in the adoption of Flame Retardant Apparel Industry?

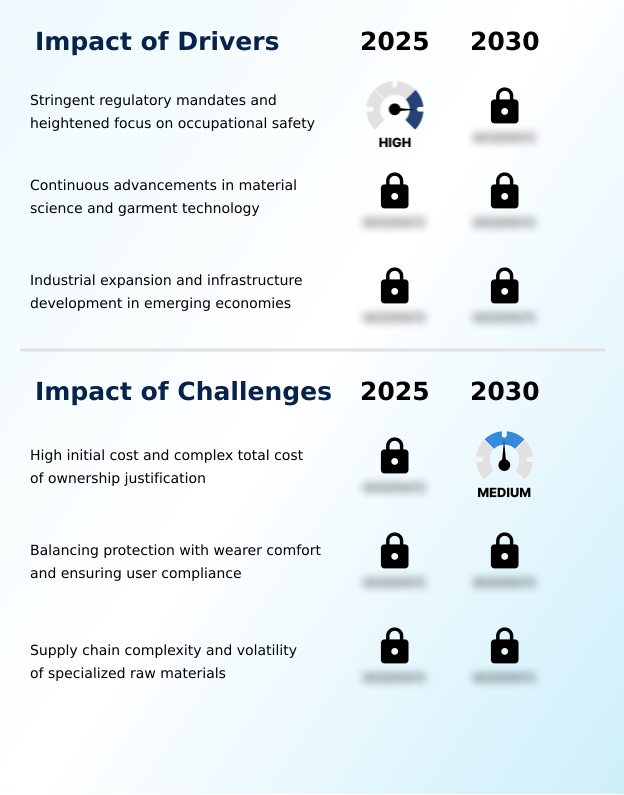
  • Stringent regulatory mandates and a heightened focus on occupational safety are the key drivers of the market.

  • Market growth is fundamentally propelled by a robust, harmonized regulatory environment that creates non-discretionary demand for compliant protective gear. This regulatory push is amplified by a deepening corporate safety culture focused on mitigating residual risk.
  • Material science acts as a powerful catalyst, with innovations in lightweight protective fabrics reducing garment weight by over 15%, which directly improves user comfort and addresses human factors engineering concerns.
  • The expansion of heavy industry in emerging economies, often guided by the high standards of multinational corporations, accelerates local legislative evolution and market penetration.
  • The adoption of these stringent safety protocols by local partners within their supply chains can increase compliance rates by more than 40% in a few years, showcasing a powerful mechanism for market expansion.

What are the market trends shaping the Flame Retardant Apparel Industry?

  • The emergence of smart apparel with digital integration is a key upcoming market trend. This evolution transforms protective clothing from a passive barrier into an active safety monitoring tool.

  • Key market trends are reshaping protective apparel from passive items to active safety assets, driven by digital connectivity integration. The development of a connected worker ecosystem, where smart garments with biometric information monitoring provide real-time data, is a transformative shift.
  • This allows for predictive safety analytics, with some pilot programs demonstrating a potential 20% reduction in heat stress incidents through early detection. Another dominant trend is the proliferation of single-layer garments offering multi-hazard protection, which can streamline PPE programs and cut procurement costs by 15%.
  • This push for functional consolidation is coupled with a growing emphasis on circular economy principles and end-of-life recycling programs, reflecting a broader commitment to environmental social governance criteria and sustainability in the supply chain.

What challenges does the Flame Retardant Apparel Industry face during its growth?

  • The high initial procurement cost of garments and the complexity in justifying the total cost of ownership present a key challenge affecting industry growth.

  • A primary market challenge is the high initial cost of premium apparel, which complicates total cost of ownership justification for many buyers. This financial barrier is compounded by the technical difficulty of balancing uncompromising protection with wearer comfort. Garments that impede thermoregulation can reduce worker productivity by up to 10% in high-heat environments, undermining safety through poor user compliance.
  • Furthermore, significant supply chain volatility for specialized raw materials, such as those used in turnout gear, creates price instability and logistical hurdles. This requires a significant procurement mindset shift, as premium inherent fiber garments often last 3-5 times longer than treated alternatives, a critical factor in long-term operational downtime reduction and asset protection.

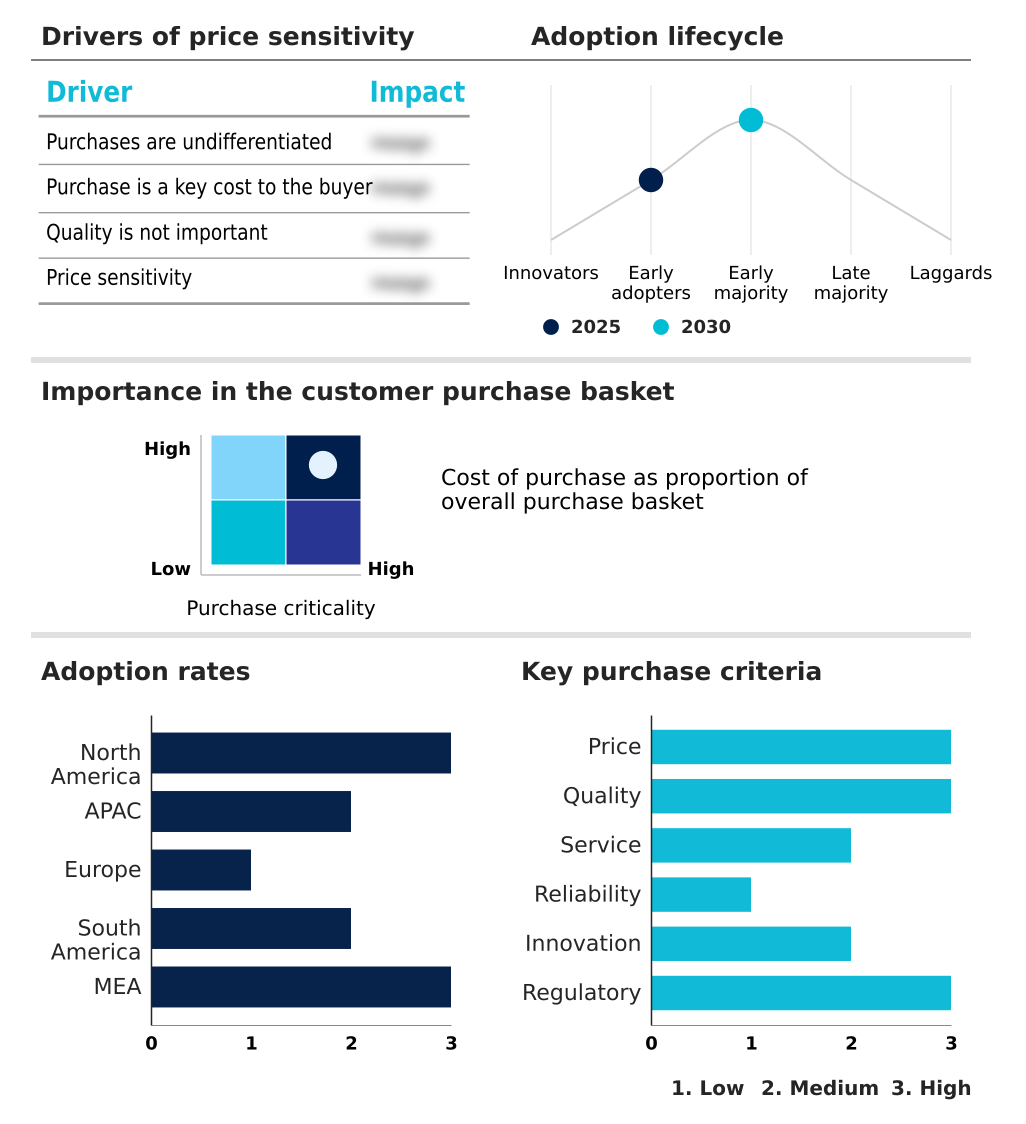
Exclusive Technavio Analysis on Customer Landscape

The flame retardant apparel market forecasting report includes the adoption lifecycle of the market, covering from the innovator’s stage to the laggard’s stage. It focuses on adoption rates in different regions based on penetration. Furthermore, the flame retardant apparel market report also includes key purchase criteria and drivers of price sensitivity to help companies evaluate and develop their market growth analysis strategies.

Customer Landscape of Flame Retardant Apparel Industry

Competitive Landscape

Companies are implementing various strategies, such as strategic alliances, flame retardant apparel market forecast, partnerships, mergers and acquisitions, geographical expansion, and product/service launches, to enhance their presence in the industry.

3M Co. - Key offerings feature advanced fiber technology and inherently flame-resistant materials, providing multi-hazard thermal protection against flash fires, electric arcs, and other industrial dangers.

The industry research and growth report includes detailed analyses of the competitive landscape of the market and information about key companies, including:

  • 3M Co.
  • Ansell Ltd.
  • Arco Ltd.
  • Carhartt Inc.
  • Carrington Textiles Ltd.
  • Cintas Corp.
  • DEVA FM. sro
  • DuPont de Nemours Inc.
  • Frham Safety Products Inc.
  • Honeywell International Inc.
  • Hultafors Group AB
  • Kimberly Clark Corp.
  • Lakeland Industries Inc.
  • Marina Textil SL
  • National Safety Apparel Inc.
  • Portwest Clothing Ltd.
  • Scandia Gear Europe BV
  • Seyntex NV
  • VF Corp.

Qualitative and quantitative analysis of companies has been conducted to help clients understand the wider business environment as well as the strengths and weaknesses of key industry players. Data is qualitatively analyzed to categorize companies as pure play, category-focused, industry-focused, and diversified; it is quantitatively analyzed to categorize companies as dominant, leading, strong, tentative, and weak.

Recent Development and News in Flame retardant apparel market

  • In September, 2024, DuPont de Nemours Inc. announced the commercial launch of a new bio-based aramid fiber, developed to offer inherent flame resistance with a 30% lower carbon footprint compared to traditional petroleum-based alternatives, targeting sustainable PPE markets.
  • In November, 2024, Honeywell International Inc. formed a strategic partnership with a leading IoT sensor firm to integrate real-time biometric and environmental monitoring into its next-generation flame retardant apparel, creating a connected worker safety platform.
  • In January, 2025, 3M Co. completed the acquisition of a specialized textile technology startup, gaining access to a proprietary fabric treatment that enhances the durability and moisture-wicking properties of flame-retardant garments.
  • In April, 2025, Cintas Corp. launched a nationwide industrial-scale recycling program for end-of-life flame retardant apparel, aiming to divert thousands of tons of textile waste from landfills by processing used garments into raw materials for other industries.

Dive into Technavio’s robust research methodology, blending expert interviews, extensive data synthesis, and validated models for unparalleled Flame Retardant Apparel Market insights. See full methodology.

Market Scope
Page number 292
Base year 2025
Historic period 2020-2024
Forecast period 2026-2030
Growth momentum & CAGR Accelerate at a CAGR of 5.2%
Market growth 2026-2030 USD 1239.2 million
Market structure Fragmented
YoY growth 2025-2026(%) 5.0%
Key countries US, Canada, Mexico, China, Japan, India, South Korea, Australia, Indonesia, Germany, UK, France, Italy, Spain, The Netherlands, Brazil, Argentina, Colombia, Saudi Arabia, UAE, South Africa, Israel and Turkey
Competitive landscape Leading Companies, Market Positioning of Companies, Competitive Strategies, and Industry Risks

Request Free Sample

Research Analyst Overview

  • The flame retardant apparel market is driven by the convergence of stringent occupational safety standards and continuous material science innovation. The non-negotiable requirement for thermal hazard protection in high-risk industries creates a stable demand floor, while advancements in advanced fiber technology and textile engineering propel market evolution.
  • Today, the focus has shifted from basic chemically treated fabrics to high-performance, inherently flame resistant fibers that deliver a synergistic suite of protections, including arc-rated protective clothing and moisture-wicking capabilities for heat stress mitigation. The trend toward sustainable materials, featuring tri-fiber blend fabrics and greener chemistry treatments, is now a boardroom-level discussion, impacting brand reputation and ESG compliance.
  • Firms leveraging multi-hazard protection in single-layer garments have reported a reduction in required PPE items by over 30%. This market is defined by a sophisticated balance between NFPA 2112 compliance, thermoregulation performance, and ergonomic garment design, pushing the industry toward lighter, more durable, and safer protective solutions.
  • From non-woven substrates for single-use garments to complex multi-layered systems, the ultimate goal is enhancing worker safety and compliance through superior product performance.

What are the Key Data Covered in this Flame Retardant Apparel Market Research and Growth Report?

  • What is the expected growth of the Flame Retardant Apparel Market between 2026 and 2030?

    • USD 1.24 billion, at a CAGR of 5.2%

  • What segmentation does the market report cover?

    • The report is segmented by End-user (Industries, Firefighting and law enforcement, and Others), Distribution Channel (Offline, and Online), Type (Durable, and Disposable) and Geography (North America, APAC, Europe, South America, Middle East and Africa)

  • Which regions are analyzed in the report?

    • North America, APAC, Europe, South America and Middle East and Africa

  • What are the key growth drivers and market challenges?

    • Stringent regulatory mandates and heightened focus on occupational safety, High initial cost and complex total cost of ownership justification

  • Who are the major players in the Flame Retardant Apparel Market?

    • 3M Co., Ansell Ltd., Arco Ltd., Carhartt Inc., Carrington Textiles Ltd., Cintas Corp., DEVA FM. sro, DuPont de Nemours Inc., Frham Safety Products Inc., Honeywell International Inc., Hultafors Group AB, Kimberly Clark Corp., Lakeland Industries Inc., Marina Textil SL, National Safety Apparel Inc., Portwest Clothing Ltd., Scandia Gear Europe BV, Seyntex NV and VF Corp.

Market Research Insights

  • Market dynamics are shifting from basic compliance to a focus on total value, where procurement decisions are influenced by performance metrics beyond initial cost. The adoption of proactive risk management and a strong corporate safety culture drives demand for advanced solutions.
  • For example, organizations implementing multi-hazard garments report a reduction in PPE inventory complexity by up to 30%, simplifying logistics and improving user compliance enhancement. Furthermore, the use of next-generation fabrics with superior moisture-wicking capabilities has been shown to improve thermoregulation performance, reducing heat-stress-related productivity losses by over 15%.
  • This data-driven safety management approach, which aligns with corporate social responsibility goals and supports a social license to operate, underscores the market's evolution toward holistic and efficient worker protection systems.

We can help! Our analysts can customize this flame retardant apparel market research report to meet your requirements.

Get in touch

1. Executive Summary

1.1 Market overview

Executive Summary - Chart on Market Overview
Executive Summary - Data Table on Market Overview
Executive Summary - Chart on Global Market Characteristics
Executive Summary - Chart on Market by Geography
Executive Summary - Chart on Market Segmentation by End-user
Executive Summary - Chart on Market Segmentation by Distribution Channel
Executive Summary - Chart on Market Segmentation by Type
Executive Summary - Chart on Incremental Growth
Executive Summary - Data Table on Incremental Growth
Executive Summary - Chart on Company Market Positioning

2. Technavio Analysis

2.1 Analysis of price sensitivity, lifecycle, customer purchase basket, adoption rates, and purchase criteria

2.2 Criticality of inputs and Factors of differentiation

Chart on Overview on criticality of inputs and factors of differentiation

2.3 Factors of disruption

Chart on Overview on factors of disruption

2.4 Impact of drivers and challenges

Chart on Impact of drivers and challenges in 2025 and 2030

3. Market Landscape

3.1 Market ecosystem

Chart on Parent Market
Data Table on - Parent Market

3.2 Market characteristics

Chart on Market characteristics analysis

3.3 Value chain analysis

Chart on Value chain analysis

4. Market Sizing

4.1 Market definition

Data Table on Offerings of companies included in the market definition

4.2 Market segment analysis

Market segments

4.3 Market size 2025

4.4 Market outlook: Forecast for 2025-2030

Chart on Global - Market size and forecast 2025-2030 ($ million)
Data Table on Global - Market size and forecast 2025-2030 ($ million)
Chart on Global Market: Year-over-year growth 2025-2030 (%)
Data Table on Global Market: Year-over-year growth 2025-2030 (%)

5. Historic Market Size

5.1 Global Flame Retardant Apparel Market 2020 - 2024

Historic Market Size - Data Table on Global Flame Retardant Apparel Market 2020 - 2024 ($ million)

5.2 End-user segment analysis 2020 - 2024

Historic Market Size - End-user Segment 2020 - 2024 ($ million)

5.3 Distribution Channel segment analysis 2020 - 2024

Historic Market Size - Distribution Channel Segment 2020 - 2024 ($ million)

5.4 Type segment analysis 2020 - 2024

Historic Market Size - Type Segment 2020 - 2024 ($ million)

5.5 Geography segment analysis 2020 - 2024

Historic Market Size - Geography Segment 2020 - 2024 ($ million)

5.6 Country segment analysis 2020 - 2024

Historic Market Size - Country Segment 2020 - 2024 ($ million)

6. Qualitative Analysis

6.1 The AI impact on global flame retardant apparel market

7. Five Forces Analysis

7.1 Five forces summary

Five forces analysis - Comparison between 2025 and 2030

7.2 Bargaining power of buyers

Bargaining power of buyers - Impact of key factors 2025 and 2030

7.3 Bargaining power of suppliers

Bargaining power of suppliers - Impact of key factors in 2025 and 2030

7.4 Threat of new entrants

Threat of new entrants - Impact of key factors in 2025 and 2030

7.5 Threat of substitutes

Threat of substitutes - Impact of key factors in 2025 and 2030

7.6 Threat of rivalry

Threat of rivalry - Impact of key factors in 2025 and 2030

7.7 Market condition

Chart on Market condition - Five forces 2025 and 2030

8. Market Segmentation by End-user

8.1 Market segments

Chart on End-user - Market share 2025-2030 (%)
Data Table on End-user - Market share 2025-2030 (%)

8.2 Comparison by End-user

Chart on Comparison by End-user
Data Table on Comparison by End-user

8.3 Industries - Market size and forecast 2025-2030

Chart on Industries - Market size and forecast 2025-2030 ($ million)
Data Table on Industries - Market size and forecast 2025-2030 ($ million)
Chart on Industries - Year-over-year growth 2025-2030 (%)
Data Table on Industries - Year-over-year growth 2025-2030 (%)

8.4 Firefighting and law enforcement - Market size and forecast 2025-2030

Chart on Firefighting and law enforcement - Market size and forecast 2025-2030 ($ million)
Data Table on Firefighting and law enforcement - Market size and forecast 2025-2030 ($ million)
Chart on Firefighting and law enforcement - Year-over-year growth 2025-2030 (%)
Data Table on Firefighting and law enforcement - Year-over-year growth 2025-2030 (%)

8.5 Others - Market size and forecast 2025-2030

Chart on Others - Market size and forecast 2025-2030 ($ million)
Data Table on Others - Market size and forecast 2025-2030 ($ million)
Chart on Others - Year-over-year growth 2025-2030 (%)
Data Table on Others - Year-over-year growth 2025-2030 (%)

8.6 Market opportunity by End-user

Market opportunity by End-user ($ million)
Data Table on Market opportunity by End-user ($ million)

9. Market Segmentation by Distribution Channel

9.1 Market segments

Chart on Distribution Channel - Market share 2025-2030 (%)
Data Table on Distribution Channel - Market share 2025-2030 (%)

9.2 Comparison by Distribution Channel

Chart on Comparison by Distribution Channel
Data Table on Comparison by Distribution Channel

9.3 Offline - Market size and forecast 2025-2030

Chart on Offline - Market size and forecast 2025-2030 ($ million)
Data Table on Offline - Market size and forecast 2025-2030 ($ million)
Chart on Offline - Year-over-year growth 2025-2030 (%)
Data Table on Offline - Year-over-year growth 2025-2030 (%)

9.4 Online - Market size and forecast 2025-2030

Chart on Online - Market size and forecast 2025-2030 ($ million)
Data Table on Online - Market size and forecast 2025-2030 ($ million)
Chart on Online - Year-over-year growth 2025-2030 (%)
Data Table on Online - Year-over-year growth 2025-2030 (%)

9.5 Market opportunity by Distribution Channel

Market opportunity by Distribution Channel ($ million)
Data Table on Market opportunity by Distribution Channel ($ million)

10. Market Segmentation by Type

10.1 Market segments

Chart on Type - Market share 2025-2030 (%)
Data Table on Type - Market share 2025-2030 (%)

10.2 Comparison by Type

Chart on Comparison by Type
Data Table on Comparison by Type

10.3 Durable - Market size and forecast 2025-2030

Chart on Durable - Market size and forecast 2025-2030 ($ million)
Data Table on Durable - Market size and forecast 2025-2030 ($ million)
Chart on Durable - Year-over-year growth 2025-2030 (%)
Data Table on Durable - Year-over-year growth 2025-2030 (%)

10.4 Disposable - Market size and forecast 2025-2030

Chart on Disposable - Market size and forecast 2025-2030 ($ million)
Data Table on Disposable - Market size and forecast 2025-2030 ($ million)
Chart on Disposable - Year-over-year growth 2025-2030 (%)
Data Table on Disposable - Year-over-year growth 2025-2030 (%)

10.5 Market opportunity by Type

Market opportunity by Type ($ million)
Data Table on Market opportunity by Type ($ million)

11. Customer Landscape

11.1 Customer landscape overview

Analysis of price sensitivity, lifecycle, customer purchase basket, adoption rates, and purchase criteria

12. Geographic Landscape

12.1 Geographic segmentation

Chart on Market share by geography 2025-2030 (%)
Data Table on Market share by geography 2025-2030 (%)

12.2 Geographic comparison

Chart on Geographic comparison
Data Table on Geographic comparison

12.3 North America - Market size and forecast 2025-2030

Chart on North America - Market size and forecast 2025-2030 ($ million)
Data Table on North America - Market size and forecast 2025-2030 ($ million)
Chart on North America - Year-over-year growth 2025-2030 (%)
Data Table on North America - Year-over-year growth 2025-2030 (%)
Chart on Regional Comparison - North America
Data Table on Regional Comparison - North America

12.3.1 US - Market size and forecast 2025-2030

Chart on US - Market size and forecast 2025-2030 ($ million)
Data Table on US - Market size and forecast 2025-2030 ($ million)
Chart on US - Year-over-year growth 2025-2030 (%)
Data Table on US - Year-over-year growth 2025-2030 (%)

12.3.2 Canada - Market size and forecast 2025-2030

Chart on Canada - Market size and forecast 2025-2030 ($ million)
Data Table on Canada - Market size and forecast 2025-2030 ($ million)
Chart on Canada - Year-over-year growth 2025-2030 (%)
Data Table on Canada - Year-over-year growth 2025-2030 (%)

12.3.3 Mexico - Market size and forecast 2025-2030

Chart on Mexico - Market size and forecast 2025-2030 ($ million)
Data Table on Mexico - Market size and forecast 2025-2030 ($ million)
Chart on Mexico - Year-over-year growth 2025-2030 (%)
Data Table on Mexico - Year-over-year growth 2025-2030 (%)

12.4 APAC - Market size and forecast 2025-2030

Chart on APAC - Market size and forecast 2025-2030 ($ million)
Data Table on APAC - Market size and forecast 2025-2030 ($ million)
Chart on APAC - Year-over-year growth 2025-2030 (%)
Data Table on APAC - Year-over-year growth 2025-2030 (%)
Chart on Regional Comparison - APAC
Data Table on Regional Comparison - APAC

12.4.1 China - Market size and forecast 2025-2030

Chart on China - Market size and forecast 2025-2030 ($ million)
Data Table on China - Market size and forecast 2025-2030 ($ million)
Chart on China - Year-over-year growth 2025-2030 (%)
Data Table on China - Year-over-year growth 2025-2030 (%)

12.4.2 Japan - Market size and forecast 2025-2030

Chart on Japan - Market size and forecast 2025-2030 ($ million)
Data Table on Japan - Market size and forecast 2025-2030 ($ million)
Chart on Japan - Year-over-year growth 2025-2030 (%)
Data Table on Japan - Year-over-year growth 2025-2030 (%)

12.4.3 India - Market size and forecast 2025-2030

Chart on India - Market size and forecast 2025-2030 ($ million)
Data Table on India - Market size and forecast 2025-2030 ($ million)
Chart on India - Year-over-year growth 2025-2030 (%)
Data Table on India - Year-over-year growth 2025-2030 (%)

12.4.4 South Korea - Market size and forecast 2025-2030

Chart on South Korea - Market size and forecast 2025-2030 ($ million)
Data Table on South Korea - Market size and forecast 2025-2030 ($ million)
Chart on South Korea - Year-over-year growth 2025-2030 (%)
Data Table on South Korea - Year-over-year growth 2025-2030 (%)

12.4.5 Australia - Market size and forecast 2025-2030

Chart on Australia - Market size and forecast 2025-2030 ($ million)
Data Table on Australia - Market size and forecast 2025-2030 ($ million)
Chart on Australia - Year-over-year growth 2025-2030 (%)
Data Table on Australia - Year-over-year growth 2025-2030 (%)

12.4.6 Indonesia - Market size and forecast 2025-2030

Chart on Indonesia - Market size and forecast 2025-2030 ($ million)
Data Table on Indonesia - Market size and forecast 2025-2030 ($ million)
Chart on Indonesia - Year-over-year growth 2025-2030 (%)
Data Table on Indonesia - Year-over-year growth 2025-2030 (%)

12.5 Europe - Market size and forecast 2025-2030

Chart on Europe - Market size and forecast 2025-2030 ($ million)
Data Table on Europe - Market size and forecast 2025-2030 ($ million)
Chart on Europe - Year-over-year growth 2025-2030 (%)
Data Table on Europe - Year-over-year growth 2025-2030 (%)
Chart on Regional Comparison - Europe
Data Table on Regional Comparison - Europe

12.5.1 Germany - Market size and forecast 2025-2030

Chart on Germany - Market size and forecast 2025-2030 ($ million)
Data Table on Germany - Market size and forecast 2025-2030 ($ million)
Chart on Germany - Year-over-year growth 2025-2030 (%)
Data Table on Germany - Year-over-year growth 2025-2030 (%)

12.5.2 UK - Market size and forecast 2025-2030

Chart on UK - Market size and forecast 2025-2030 ($ million)
Data Table on UK - Market size and forecast 2025-2030 ($ million)
Chart on UK - Year-over-year growth 2025-2030 (%)
Data Table on UK - Year-over-year growth 2025-2030 (%)

12.5.3 France - Market size and forecast 2025-2030

Chart on France - Market size and forecast 2025-2030 ($ million)
Data Table on France - Market size and forecast 2025-2030 ($ million)
Chart on France - Year-over-year growth 2025-2030 (%)
Data Table on France - Year-over-year growth 2025-2030 (%)

12.5.4 Italy - Market size and forecast 2025-2030

Chart on Italy - Market size and forecast 2025-2030 ($ million)
Data Table on Italy - Market size and forecast 2025-2030 ($ million)
Chart on Italy - Year-over-year growth 2025-2030 (%)
Data Table on Italy - Year-over-year growth 2025-2030 (%)

12.5.5 Spain - Market size and forecast 2025-2030

Chart on Spain - Market size and forecast 2025-2030 ($ million)
Data Table on Spain - Market size and forecast 2025-2030 ($ million)
Chart on Spain - Year-over-year growth 2025-2030 (%)
Data Table on Spain - Year-over-year growth 2025-2030 (%)

12.5.6 The Netherlands - Market size and forecast 2025-2030

Chart on The Netherlands - Market size and forecast 2025-2030 ($ million)
Data Table on The Netherlands - Market size and forecast 2025-2030 ($ million)
Chart on The Netherlands - Year-over-year growth 2025-2030 (%)
Data Table on The Netherlands - Year-over-year growth 2025-2030 (%)

12.6 South America - Market size and forecast 2025-2030

Chart on South America - Market size and forecast 2025-2030 ($ million)
Data Table on South America - Market size and forecast 2025-2030 ($ million)
Chart on South America - Year-over-year growth 2025-2030 (%)
Data Table on South America - Year-over-year growth 2025-2030 (%)
Chart on Regional Comparison - South America
Data Table on Regional Comparison - South America

12.6.1 Brazil - Market size and forecast 2025-2030

Chart on Brazil - Market size and forecast 2025-2030 ($ million)
Data Table on Brazil - Market size and forecast 2025-2030 ($ million)
Chart on Brazil - Year-over-year growth 2025-2030 (%)
Data Table on Brazil - Year-over-year growth 2025-2030 (%)

12.6.2 Argentina - Market size and forecast 2025-2030

Chart on Argentina - Market size and forecast 2025-2030 ($ million)
Data Table on Argentina - Market size and forecast 2025-2030 ($ million)
Chart on Argentina - Year-over-year growth 2025-2030 (%)
Data Table on Argentina - Year-over-year growth 2025-2030 (%)

12.6.3 Colombia - Market size and forecast 2025-2030

Chart on Colombia - Market size and forecast 2025-2030 ($ million)
Data Table on Colombia - Market size and forecast 2025-2030 ($ million)
Chart on Colombia - Year-over-year growth 2025-2030 (%)
Data Table on Colombia - Year-over-year growth 2025-2030 (%)

12.7 Middle East and Africa - Market size and forecast 2025-2030

Chart on Middle East and Africa - Market size and forecast 2025-2030 ($ million)
Data Table on Middle East and Africa - Market size and forecast 2025-2030 ($ million)
Chart on Middle East and Africa - Year-over-year growth 2025-2030 (%)
Data Table on Middle East and Africa - Year-over-year growth 2025-2030 (%)
Chart on Regional Comparison - Middle East and Africa
Data Table on Regional Comparison - Middle East and Africa

12.7.1 Saudi Arabia - Market size and forecast 2025-2030

Chart on Saudi Arabia - Market size and forecast 2025-2030 ($ million)
Data Table on Saudi Arabia - Market size and forecast 2025-2030 ($ million)
Chart on Saudi Arabia - Year-over-year growth 2025-2030 (%)
Data Table on Saudi Arabia - Year-over-year growth 2025-2030 (%)

12.7.2 UAE - Market size and forecast 2025-2030

Chart on UAE - Market size and forecast 2025-2030 ($ million)
Data Table on UAE - Market size and forecast 2025-2030 ($ million)
Chart on UAE - Year-over-year growth 2025-2030 (%)
Data Table on UAE - Year-over-year growth 2025-2030 (%)

12.7.3 South Africa - Market size and forecast 2025-2030

Chart on South Africa - Market size and forecast 2025-2030 ($ million)
Data Table on South Africa - Market size and forecast 2025-2030 ($ million)
Chart on South Africa - Year-over-year growth 2025-2030 (%)
Data Table on South Africa - Year-over-year growth 2025-2030 (%)

12.7.4 Israel - Market size and forecast 2025-2030

Chart on Israel - Market size and forecast 2025-2030 ($ million)
Data Table on Israel - Market size and forecast 2025-2030 ($ million)
Chart on Israel - Year-over-year growth 2025-2030 (%)
Data Table on Israel - Year-over-year growth 2025-2030 (%)

12.7.5 Turkey - Market size and forecast 2025-2030

Chart on Turkey - Market size and forecast 2025-2030 ($ million)
Data Table on Turkey - Market size and forecast 2025-2030 ($ million)
Chart on Turkey - Year-over-year growth 2025-2030 (%)
Data Table on Turkey - Year-over-year growth 2025-2030 (%)

12.8 Market opportunity by geography

Market opportunity by geography ($ million)
Data Tables on Market opportunity by geography ($ million)

13. Drivers, Challenges, and Opportunity

13.1 Market drivers

Stringent regulatory mandates and heightened focus on occupational safety
Continuous advancements in material science and garment technology
Industrial expansion and infrastructure development in emerging economies

13.2 Market challenges

High initial cost and complex total cost of ownership justification
Balancing protection with wearer comfort and ensuring user compliance
Supply chain complexity and volatility of specialized raw materials

13.3 Impact of drivers and challenges

Impact of drivers and challenges in 2025 and 2030

13.4 Market opportunities

Emergence of smart apparel and digital integration
Proliferation of multi functional garment solutions
Integration of sustainability and circular economy principles

14. Competitive Landscape

14.1 Overview

14.2

Overview on criticality of inputs and factors of differentiation

14.3 Landscape disruption

Overview on factors of disruption

14.4 Industry risks

Impact of key risks on business

15. Competitive Analysis

15.1 Companies profiled

Companies covered

15.2 Company ranking index

15.3 Market positioning of companies

Matrix on companies position and classification

15.4 3M Co.

3M Co. - Overview
3M Co. - Business segments
3M Co. - Key news
3M Co. - Key offerings
3M Co. - Segment focus
SWOT

15.5 Ansell Ltd.

Ansell Ltd. - Overview
Ansell Ltd. - Business segments
Ansell Ltd. - Key news
Ansell Ltd. - Key offerings
Ansell Ltd. - Segment focus
SWOT

15.6 Arco Ltd.

Arco Ltd. - Overview
Arco Ltd. - Product / Service
Arco Ltd. - Key news
Arco Ltd. - Key offerings
SWOT

15.7 Carhartt Inc.

Carhartt Inc. - Overview
Carhartt Inc. - Product / Service
Carhartt Inc. - Key offerings
SWOT

15.8 Carrington Textiles Ltd.

Carrington Textiles Ltd. - Overview
Carrington Textiles Ltd. - Product / Service
Carrington Textiles Ltd. - Key offerings
SWOT

15.9 Cintas Corp.

Cintas Corp. - Overview
Cintas Corp. - Business segments
Cintas Corp. - Key news
Cintas Corp. - Key offerings
Cintas Corp. - Segment focus
SWOT

15.10 DuPont de Nemours Inc.

DuPont de Nemours Inc. - Overview
DuPont de Nemours Inc. - Business segments
DuPont de Nemours Inc. - Key news
DuPont de Nemours Inc. - Key offerings
DuPont de Nemours Inc. - Segment focus
SWOT

15.11 Honeywell International Inc.

Honeywell International Inc. - Overview
Honeywell International Inc. - Business segments
Honeywell International Inc. - Key news
Honeywell International Inc. - Key offerings
Honeywell International Inc. - Segment focus
SWOT

15.12 Hultafors Group AB

Hultafors Group AB - Overview
Hultafors Group AB - Product / Service
Hultafors Group AB - Key news
Hultafors Group AB - Key offerings
SWOT

15.13 Kimberly Clark Corp.

Kimberly Clark Corp. - Overview
Kimberly Clark Corp. - Business segments
Kimberly Clark Corp. - Key news
Kimberly Clark Corp. - Key offerings
Kimberly Clark Corp. - Segment focus
SWOT

15.14 Lakeland Industries Inc.

Lakeland Industries Inc. - Overview
Lakeland Industries Inc. - Business segments
Lakeland Industries Inc. - Key news
Lakeland Industries Inc. - Key offerings
Lakeland Industries Inc. - Segment focus
SWOT

15.15 Portwest Clothing Ltd.

Portwest Clothing Ltd. - Overview
Portwest Clothing Ltd. - Product / Service
Portwest Clothing Ltd. - Key offerings
SWOT

15.16 Scandia Gear Europe BV

Scandia Gear Europe BV - Overview
Scandia Gear Europe BV - Product / Service
Scandia Gear Europe BV - Key offerings
SWOT

15.17 Seyntex NV

Seyntex NV - Overview
Seyntex NV - Product / Service
Seyntex NV - Key offerings
SWOT

15.18 VF Corp.

VF Corp. - Overview
VF Corp. - Business segments
VF Corp. - Key news
VF Corp. - Key offerings
VF Corp. - Segment focus
SWOT

16. Appendix

16.1 Scope of the report

Market definition
Objectives
Notes and caveats

16.2 Inclusions and exclusions checklist

Inclusions checklist
Exclusions checklist

16.3 Currency conversion rates for US$

16.4 Research methodology

16.5 Data procurement

Information sources

16.6 Data validation

16.7 Validation techniques employed for market sizing

16.8 Data synthesis

16.9 360 degree market analysis

16.10 List of abbreviations

Research Methodology

Technavio presents a detailed picture of the market by way of study, synthesis, and summation of data from multiple sources. The analysts have presented the various facets of the market with a particular focus on identifying the key industry influencers. The data thus presented is comprehensive, reliable, and the result of extensive research, both primary and secondary.

INFORMATION SOURCES

Primary sources

  • Manufacturers and suppliers
  • Channel partners
  • Industry experts
  • Strategic decision makers

Secondary sources

  • Industry journals and periodicals
  • Government data
  • Financial reports of key industry players
  • Historical data
  • Press releases

DATA ANALYSIS

Data Synthesis

  • Collation of data
  • Estimation of key figures
  • Analysis of derived insights

Data Validation

  • Triangulation with data models
  • Reference against proprietary databases
  • Corroboration with industry experts

REPORT WRITING

Qualitative

  • Market drivers
  • Market challenges
  • Market trends
  • Five forces analysis

Quantitative

  • Market size and forecast
  • Market segmentation
  • Geographical insights
  • Competitive landscape

Interested in this report?

Get your sample now to see our research methodology and insights!

Download Now

Frequently Asked Questions

Flame Retardant Apparel market growth will increase by USD 1239.2 million during 2026-2030.

The Flame Retardant Apparel market is expected to grow at a CAGR of 5.2% during 2026-2030.

Flame Retardant Apparel market is segmented by End-user (Industries, Firefighting and law enforcement, Others) Distribution channel (Offline, Online) Type (Durable, Disposable)

3M Co., Ansell Ltd., Arco Ltd., Carhartt Inc., Carrington Textiles Ltd., Cintas Corp., DEVA FM. sro, DuPont de Nemours Inc., Frham Safety Products Inc., Honeywell International Inc., Hultafors Group AB, Kimberly Clark Corp., Lakeland Industries Inc., Marina Textil SL, National Safety Apparel Inc., Portwest Clothing Ltd., Scandia Gear Europe BV, Seyntex NV, VF Corp. are a few of the key vendors in the Flame Retardant Apparel market.

APAC will register the highest growth rate of 35.1% among the other regions. Therefore, the Flame Retardant Apparel market in APAC is expected to garner significant business opportunities for the vendors during the forecast period.

US, Canada, Mexico, China, Japan, India, South Korea, Australia, Indonesia, Germany, UK, France, Italy, Spain, The Netherlands, Brazil, Argentina, Colombia, Saudi Arabia, UAE, South Africa, Israel, Turkey

  • Stringent regulatory mandates and heightened focus on occupational safety is the driving factor this market.

The Flame Retardant Apparel market vendors should focus on grabbing business opportunities from the End-user segment as it accounted for the largest market share in the base year.