Flow Cytometer Market Analysis North America, Europe, Asia, Rest of World (ROW) - US, China, UK, Germany, Canada - Size and Forecast 2024-2028

Flow Cytometer Market Analysis North America, Europe, Asia, Rest of World (ROW) - US, China, UK, Germany, Canada - Size and Forecast 2024-2028

Published: Jul 2024 180 Pages SKU: IRTNTR46387

Market Overview at a Glance

$8.17 B
Market Opportunity
15.2%
CAGR
12.86
YoY growth 2023-2024(%)

Flow Cytometer Market Size 2024-2028

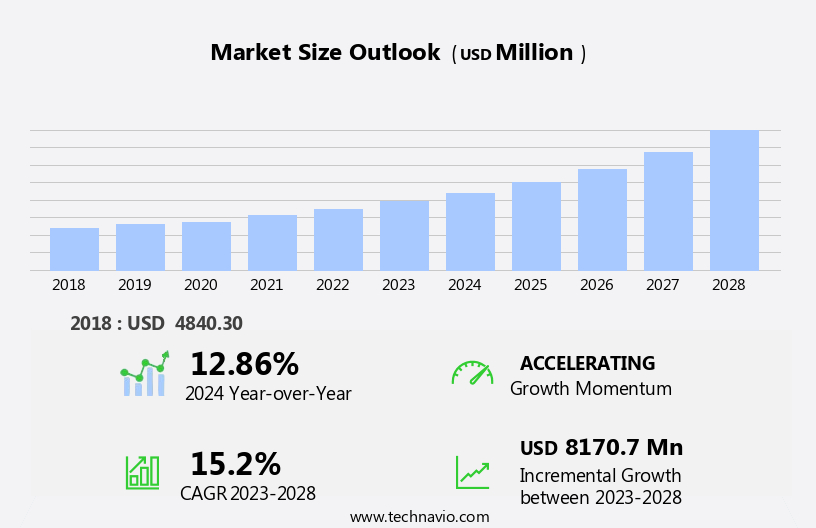
The flow cytometer market size is forecast to increase by USD 8.17 billion at a CAGR of 15.2% between 2023 and 2028.

  • The market is experiencing significant growth due to several key trends. One of the primary drivers is the increasing expenditure on research and development (R&D) in various industries, including healthcare and biotechnology. Reagents, including fluorescently labeled antibodies, viability dyes, and calibration beads, enhance cellular property detection and quantification in applications such as cell sorting, apoptosis analysis, and immunophenotyping. This investment in R&D is leading to the development of advanced flow cytometers with improved capabilities and features. Another trend is the rising level of process automation in laboratories, which is increasing the adoption of flow cytometers for automating complex analysis tasks. However, the high cost of flow cytometer instruments remains a challenge for smaller organizations and research institutions. Despite this, the benefits of using flow cytometry for accurate and rapid analysis of cells and particles are driving market growth. The market analysis report provides a comprehensive overview of these trends and other factors influencing the growth of the market.

What will be the Size of the Flow Cytometer Market During the Forecast Period?

Flow Cytometer Market Size

 Request Free Sample

  • The market encompasses instruments and associated reagents used for clinical diagnostics and life science research. This market is driven by the increasing demand for high-throughput screening and analysis in various applications, including morphologic and biomarker discovery, single-cell analysis, and biotechnology research. Flow cytometry is integral to stem therapy development, with applications in both allogeneic and autologous therapies. The technology enables the analysis of surface markers, proliferation assays, signaling pathways, apoptosis analysis, cycle analysis, and cancer diagnosis. Additionally, advancements in microfluidic technology, immunofluorescence staining, and sorting technology have expanded the capabilities of flow cytometry, making it an essential tool for research in immunology, viability assays, and other fields.
  • Overall, the market is experiencing significant growth due to its versatility and ability to provide valuable insights in various research and diagnostic applications.

How is this Flow Cytometer Industry segmented and which is the largest segment?

The flow cytometer industry research report provides comprehensive data (region-wise segment analysis), with forecasts and estimates in "USD million" for the period 2024-2028, as well as historical data from 2018-2022 for the following segments.

  • Product
    • Reagents and consumables
    • Instruments
    • Others
  • End-user
    • Pharmaceutical industry
    • Health and diagnostic centers
    • Others
  • Geography
    • North America
      • Canada
      • US
    • Europe
      • Germany
      • UK
    • Asia
      • China
    • Rest of World (ROW)

By Product Insights

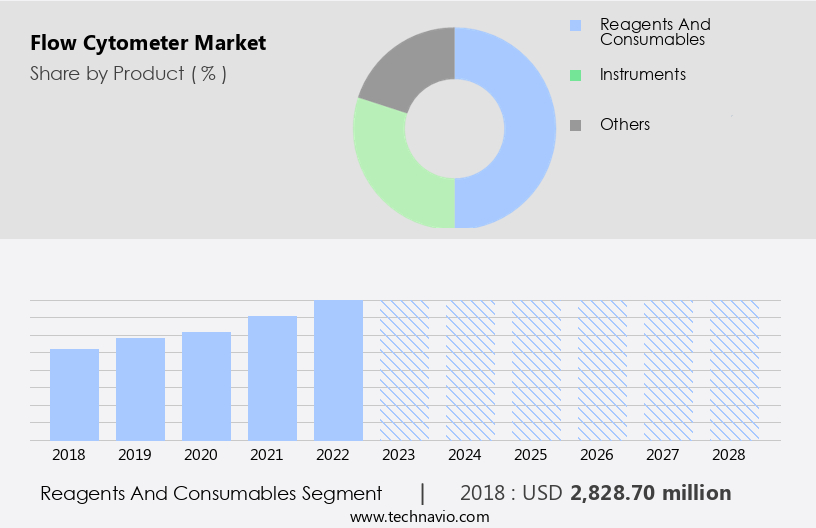
  • The reagents and consumables segment is estimated to witness significant growth during the forecast period. The market is driven by the essential role of reagents and consumables in clinical diagnostics, research, and biopharmaceutical industries. Consumables, including test tubes, sample vials, microplates, and sheath fluids, facilitate sample preparation, handling, and data acquisition, ensuring operational efficiency and maintaining sample integrity for accurate flow cytometric analyses. Applications in cancer research, infectious diseases, and radiation therapy are significant market growth areas. Collaborations between industry leaders like Cytek Biosciences and BD Biosciences in point-of-care diagnostics and automation technologies further advance the market. Multi-processing technologies, digital signal processing, and the near-infrared range expand flow cytometry's capabilities, benefiting biopharmaceutical research and cancer treatment.

Flow Cytometer Market Size

Get a glance at the market report of various segments Request Free Sample

  • The reagents and consumables segment was valued at USD 2.83 billion in 2018 and showed a gradual increase during the forecast period.

Regional Analysis

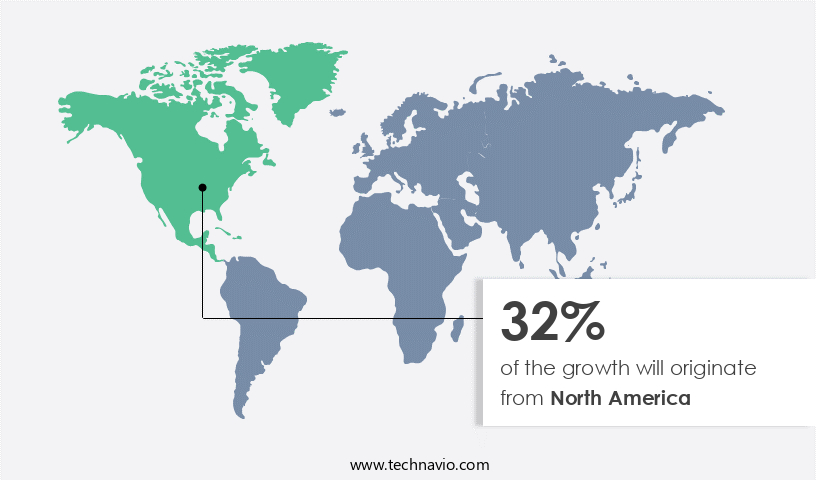
  • North America is estimated to contribute 32% to the growth of the global market during the forecast period. Technavio's analysts have elaborately explained the regional trends and drivers that shape the market during the forecast period.

Flow Cytometer Market Share by Geography

For more insights on the market size of various regions, Request Free Sample

  • The market in North America is experiencing significant growth due to several key factors. The increasing burden of chronic and infectious diseases, such as cancer, has led to a heightened demand for advanced diagnostic tools, including flow cytometers. Additionally, the growing presence of pharmaceutical companies and biotech firms In the region is driving research and development In the field of flow cytometry. This, in turn, is fueling the market's growth. Furthermore, the adoption of automation and digital signal processing technologies, as well as multi-processing capabilities, is enabling the development of point-of-care diagnostics and sort-capable image analysis systems. Collaborations between industry players and research institutions are also contributing to market expansion.
  • The market is expected to continue growing due to the increasing demand for efficient and accurate diagnostic tools in cancer treatment and biopharmaceutical research, as well as the development of multiplex reagents and instruments capable of operating In the near-infrared range.

Market Dynamics

Our researchers analyzed the data with 2023 as the base year, along with the key drivers, trends, and challenges. A holistic analysis of drivers will help companies refine their marketing strategies to gain a competitive advantage.

What are the key market drivers leading to the rise In the adoption of Flow Cytometer Industry?

  • Increasing expenditure on R&D is the key driver of the market. The global flow cytometry market has experienced significant growth in research and development (R&D) expenditures over the past decade. This expansion is driven by the increasing prevalence and incidence of various diseases, including cancer, infectious diseases like COVID-19, heart diseases, chronic obstructive pulmonary disease (COPD), and dementia. Pharmaceutical companies are investing heavily in R&D to discover and develop novel drugs for a broad spectrum of therapeutic applications. Advanced technologies, such as near-ultraviolet (near UV), fluorescent activated sorting, sort-capable image analysis, digital signal processing, and multi-processing technologies, are in high demand to facilitate the development of these drugs. Collaborations between industry players and academic institutions are also on the rise to accelerate research and innovation In the field.
  • Furthermore, the emergence of point-of-care diagnostics and cancer treatment technologies, such as radiation therapy, are expected to create new opportunities for market growth. The use of multiplex reagents and automation in flow cytometry is also gaining popularity in biopharmaceutical research, further fueling market expansion. The near-infrared range is an emerging area of interest in flow cytometry, offering improved sensitivity and specificity for the detection of various biomarkers. Overall, the global flow cytometry market is poised for continued growth due to the increasing demand for advanced technologies In the healthcare and biopharmaceutical industries.

What are the market trends shaping the Flow Cytometer market?

  • Increasing level of process automation is the upcoming market trend.Flow cytometry, a technology utilized In the analysis of cells, is experiencing significant advancements in automation and digital integration. Instruments have evolved from manual sample preparation and loading to automated systems that prepare, load, and store samples, reducing the need for human intervention. These digital interfaces enable seamless integration with other devices and processes, increasing flexibility and efficiency. The near-UV and fluorescent activated sorting capabilities of flow cytometers are essential in cancer research and infectious disease diagnosis.
  • Collaborations between industry leaders, such as Cytek Biosciences and BD Biosciences, have led to innovations like sort-capable image analysis and multi-processing technologies. The near-infrared range is also gaining popularity in radiation therapy and cancer treatment. Automation and digital signal processing are key drivers in biopharmaceutical research, enabling the use of multiplex reagents and point-of-care diagnostics. These advancements contribute to the continuous improvement and integration of flow cytometry into modern laboratory processes.

What challenges does the Flow Cytometer Industry face during its growth?

  • High cost of instruments is a key challenge affecting the industry growth.The market is experiencing significant growth due to its increasing application in cancer research and diagnostics for infectious diseases. The technology's ability to perform sort-capable image analysis, fluorescent activated sorting, and digital signal processing In the near-ultraviolet and near-infrared range makes it an essential tool in biopharmaceutical research and radiation therapy for cancer treatment. Collaborations between key players and the cancer society have been instrumental in advancing the technology's capabilities.
  • However, the high cost of flow cytometer instruments and associated reagents, markers, consumables, and accessories remains a significant barrier to market expansion. The average cost of a flow cytometer instrument ranges from USD 100,200 to USD 500,200, making it a substantial investment for research institutions and healthcare providers. Multi-processing technologies and multiplex reagents are expected to mitigate the high cost by enabling simultaneous analysis of multiple markers, increasing efficiency and reducing the overall cost per test. Automation and digital signal processing are also driving advancements In the field, making flow cytometry a valuable tool for point-of-care diagnostics.

Exclusive Customer Landscape

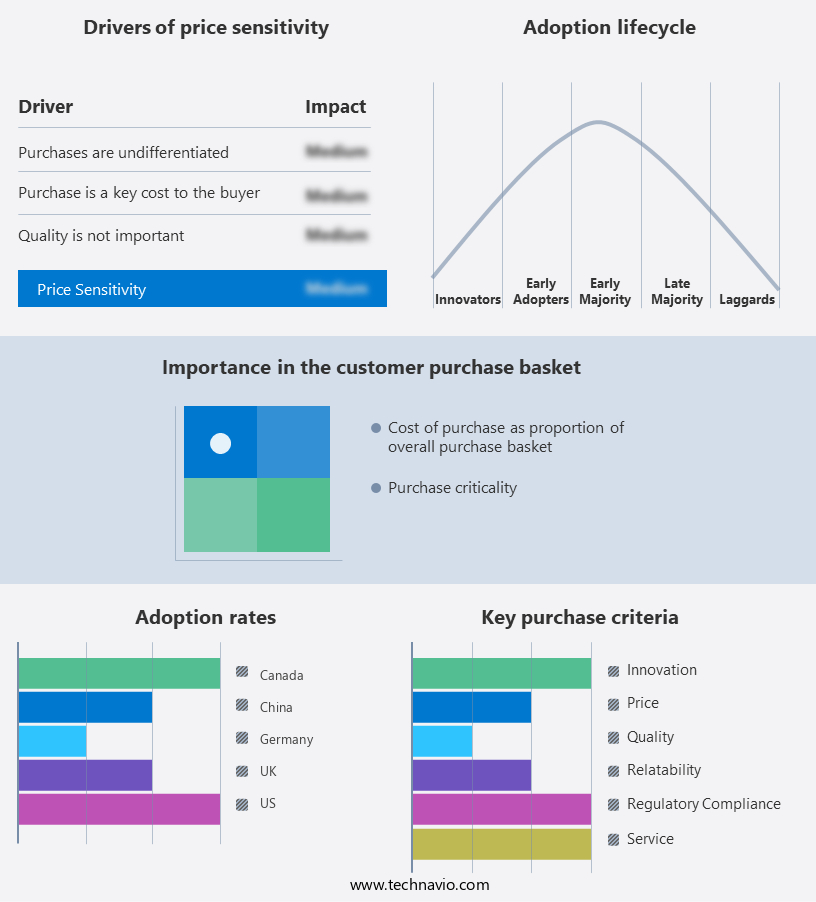
The flow cytometer market forecasting report includes the adoption lifecycle of the market, covering from the innovator's stage to the laggard's stage. It focuses on adoption rates in different regions based on penetration. Furthermore, the flow cytometer market report also includes key purchase criteria and drivers of price sensitivity to help companies evaluate and develop their market growth analysis strategies.

Flow Cytometer Market Share by Geography

 Customer Landscape

Key Companies & Market Insights

Companies are implementing various strategies, such as strategic alliances, flow cytometer market forecast, partnerships, mergers and acquisitions, geographical expansion, and product/service launches, to enhance their presence In the industry. The industry research and growth report includes detailed analyses of the competitive landscape of the market and information about key companies, including:

  • Abbott Laboratories
  • Agilent Technologies Inc.
  • Amphasys AG
  • Apogee Flow Systems Ltd.
  • Becton Dickinson and Co.
  • Bio Rad Laboratories Inc.
  • Cytek Biosciences Inc.
  • Danaher Corp.
  • DiaSorin SpA
  • Enzo Biochem Inc.
  • Miltenyi Biotec B.V. and Co. KG
  • Shenzhen Mindray BioMedical Electronics Co. Ltd
  • OLS OMNI Life Science GmbH and Co. KG
  • On-Chip Biotechnologies Co. Ltd.
  • Sartorius AG
  • Sony Group Corp.
  • Stratedigm Inc.
  • Sysmex Corp.
  • Thermo Fisher Scientific Inc.
  • Union Biometrica Inc.

Qualitative and quantitative analysis of companies has been conducted to help clients understand the wider business environment as well as the strengths and weaknesses of key industry players. Data is qualitatively analyzed to categorize companies as pure play, category-focused, industry-focused, and diversified; it is quantitatively analyzed to categorize companies as dominant, leading, strong, tentative, and weak.

Research Analyst Overview

The market encompasses a diverse range of technologies and applications, driven by the increasing demand for accurate and high-throughput analysis of biological samples. This market is characterized by continuous innovation and collaboration among key players to address the evolving needs of various industries, including biopharmaceutical research and cancer diagnostics. Flow cytometry is a versatile analytical technique used to measure and analyze the physical and chemical characteristics of individual cells. The technology utilizes the principles of laser-induced fluorescence and digital signal processing to detect and quantify cellular components. This allows for the identification, sorting, and analysis of cells based on their size, granularity, and specific molecular markers.

One of the key trends In the market is the development of advanced technologies to expand the capabilities of the instrument. For instance, the use of multi-processing technologies and sort-capable image analysis enables the simultaneous measurement of multiple parameters, enhancing the overall efficiency and accuracy of the analysis. Additionally, the integration of automation and digital signal processing improves data acquisition and analysis, reducing the time and resources required for complex experiments. Another significant trend In the market is the expansion of the flow cytometer's applications beyond traditional research settings. For example, point-of-care diagnostics and cancer treatment are emerging fields where flow cytometry plays a crucial role.

In cancer diagnostics, flow cytometry is used for the detection and characterization of various types of cancer cells, including leukemia and lymphoma. In cancer treatment, the technology is employed for the monitoring of radiation therapy response and the assessment of immunotherapies. The market is also witnessing the development of new reagents and instrument designs to address specific applications. For instance, the use of fluorescent activated sorting and near-UV lasers enables the analysis of cells expressing low levels of fluorescence, while the implementation of near-infrared range lasers expands the ability to analyze cells with high autofluorescence. Collaborations and partnerships among key players are also driving innovation In the market.

These collaborations enable the sharing of expertise, resources, and technologies, leading to the development of new products and applications. For example, collaborations between instrument manufacturers and reagent suppliers facilitate the optimization of instrument performance and the development of new reagents for specific applications. Hence, the market is a dynamic and innovative field, driven by the increasing demand for accurate and high-throughput analysis of biological samples. The market is characterized by continuous innovation, collaboration, and the expansion of applications beyond traditional research settings. The development of advanced technologies, such as multi-processing and sort-capable image analysis, and the integration of automation and digital signal processing are key trends driving the growth of the market.

Market Scope

Report Coverage

Details

Page number

180

Base year

2023

Historic period

2018-2022

Forecast period

2024-2028

Growth momentum & CAGR

Accelerate at a CAGR of 15.2%

Market growth 2024-2028

USD 8.17 billion

Market structure

Fragmented

YoY growth 2023-2024(%)

12.86

Key countries

US, China, UK, Germany, and Canada

Competitive landscape

Leading Companies, Market Positioning of Companies, Competitive Strategies, and Industry Risks

Request Free Sample

What are the Key Data Covered in this Flow Cytometer Market Research and Growth Report?

  • CAGR of the Flow Cytometer industry during the forecast period
  • Detailed information on factors that will drive the growth and forecasting between 2024 and 2028
  • Precise estimation of the size of the market and its contribution of the industry in focus to the parent market
  • Accurate predictions about upcoming growth and trends and changes in consumer behaviour
  • Growth of the market across North America, Europe, Asia, and Rest of World (ROW)
  • Thorough analysis of the market's competitive landscape and detailed information about companies
  • Comprehensive analysis of factors that will challenge the flow cytometer market growth of industry companies

We can help! Our analysts can customize this flow cytometer market research report to meet your requirements.

Get in touch

1 Executive Summary

  • 1.1 Market overview
    • Executive Summary - Chart on Market Overview
    • Executive Summary - Data Table on Market Overview
    • Executive Summary - Chart on Global Market Characteristics
    • Executive Summary - Chart on Market by Geography
    • Executive Summary - Chart on Market Segmentation by Product
    • Executive Summary - Chart on Market Segmentation by End-user
    • Executive Summary - Chart on Incremental Growth
    • Executive Summary - Data Table on Incremental Growth
    • Executive Summary - Chart on Company Market Positioning

2 Market Landscape

  • 2.1 Market ecosystem
    • Parent Market
    • Data Table on - Parent Market
  • 2.2 Market characteristics
    • Market characteristics analysis
  • 2.3 Value chain analysis
    • Value Chain Analysis

3 Market Sizing

  • 3.1 Market definition
    • Offerings of companies included in the market definition
  • 3.2 Market segment analysis
    • Market segments
  • 3.3 Market size 2023
    • 3.4 Market outlook: Forecast for 2023-2028
      • Chart on Global - Market size and forecast 2023-2028 ($ million)
      • Data Table on Global - Market size and forecast 2023-2028 ($ million)
      • Chart on Global Market: Year-over-year growth 2023-2028 (%)
      • Data Table on Global Market: Year-over-year growth 2023-2028 (%)

    4 Historic Market Size

    • 4.1 Global Flow Cytometer Market 2018 - 2022
      • Historic Market Size - Data Table on Global Flow Cytometer Market 2018 - 2022 ($ million)
    • 4.2 Product segment analysis 2018 - 2022
      • Historic Market Size - Product Segment 2018 - 2022 ($ million)
    • 4.3 End-user segment analysis 2018 - 2022
      • Historic Market Size - End-user Segment 2018 - 2022 ($ million)
    • 4.4 Geography segment analysis 2018 - 2022
      • Historic Market Size - Geography Segment 2018 - 2022 ($ million)
    • 4.5 Country segment analysis 2018 - 2022
      • Historic Market Size - Country Segment 2018 - 2022 ($ million)

    5 Five Forces Analysis

    • 5.1 Five forces summary
      • Five forces analysis - Comparison between 2023 and 2028
    • 5.2 Bargaining power of buyers
      • Bargaining power of buyers - Impact of key factors 2023 and 2028
    • 5.3 Bargaining power of suppliers
      • Bargaining power of suppliers - Impact of key factors in 2023 and 2028
    • 5.4 Threat of new entrants
      • Threat of new entrants - Impact of key factors in 2023 and 2028
    • 5.5 Threat of substitutes
      • Threat of substitutes - Impact of key factors in 2023 and 2028
    • 5.6 Threat of rivalry
      • Threat of rivalry - Impact of key factors in 2023 and 2028
    • 5.7 Market condition
      • Chart on Market condition - Five forces 2023 and 2028

    6 Market Segmentation by Product

    • 6.1 Market segments
      • Chart on Product - Market share 2023-2028 (%)
      • Data Table on Product - Market share 2023-2028 (%)
    • 6.2 Comparison by Product
      • Chart on Comparison by Product
      • Data Table on Comparison by Product
    • 6.3 Reagents and consumables - Market size and forecast 2023-2028
      • Chart on Reagents and consumables - Market size and forecast 2023-2028 ($ million)
      • Data Table on Reagents and consumables - Market size and forecast 2023-2028 ($ million)
      • Chart on Reagents and consumables - Year-over-year growth 2023-2028 (%)
      • Data Table on Reagents and consumables - Year-over-year growth 2023-2028 (%)
    • 6.4 Instruments - Market size and forecast 2023-2028
      • Chart on Instruments - Market size and forecast 2023-2028 ($ million)
      • Data Table on Instruments - Market size and forecast 2023-2028 ($ million)
      • Chart on Instruments - Year-over-year growth 2023-2028 (%)
      • Data Table on Instruments - Year-over-year growth 2023-2028 (%)
    • 6.5 Others - Market size and forecast 2023-2028
      • Chart on Others - Market size and forecast 2023-2028 ($ million)
      • Data Table on Others - Market size and forecast 2023-2028 ($ million)
      • Chart on Others - Year-over-year growth 2023-2028 (%)
      • Data Table on Others - Year-over-year growth 2023-2028 (%)
    • 6.6 Market opportunity by Product
      • Market opportunity by Product ($ million)
      • Data Table on Market opportunity by Product ($ million)

    7 Market Segmentation by End-user

    • 7.1 Market segments
      • Chart on End-user - Market share 2023-2028 (%)
      • Data Table on End-user - Market share 2023-2028 (%)
    • 7.2 Comparison by End-user
      • Chart on Comparison by End-user
      • Data Table on Comparison by End-user
    • 7.3 Pharmaceutical industry - Market size and forecast 2023-2028
      • Chart on Pharmaceutical industry - Market size and forecast 2023-2028 ($ million)
      • Data Table on Pharmaceutical industry - Market size and forecast 2023-2028 ($ million)
      • Chart on Pharmaceutical industry - Year-over-year growth 2023-2028 (%)
      • Data Table on Pharmaceutical industry - Year-over-year growth 2023-2028 (%)
    • 7.4 Health and diagnostic centers - Market size and forecast 2023-2028
      • Chart on Health and diagnostic centers - Market size and forecast 2023-2028 ($ million)
      • Data Table on Health and diagnostic centers - Market size and forecast 2023-2028 ($ million)
      • Chart on Health and diagnostic centers - Year-over-year growth 2023-2028 (%)
      • Data Table on Health and diagnostic centers - Year-over-year growth 2023-2028 (%)
    • 7.5 Others - Market size and forecast 2023-2028
      • Chart on Others - Market size and forecast 2023-2028 ($ million)
      • Data Table on Others - Market size and forecast 2023-2028 ($ million)
      • Chart on Others - Year-over-year growth 2023-2028 (%)
      • Data Table on Others - Year-over-year growth 2023-2028 (%)
    • 7.6 Market opportunity by End-user
      • Market opportunity by End-user ($ million)
      • Data Table on Market opportunity by End-user ($ million)

    8 Customer Landscape

    • 8.1 Customer landscape overview
      • Analysis of price sensitivity, lifecycle, customer purchase basket, adoption rates, and purchase criteria

    9 Geographic Landscape

    • 9.1 Geographic segmentation
      • Chart on Market share by geography 2023-2028 (%)
      • Data Table on Market share by geography 2023-2028 (%)
    • 9.2 Geographic comparison
      • Chart on Geographic comparison
      • Data Table on Geographic comparison
    • 9.3 North America - Market size and forecast 2023-2028
      • Chart on North America - Market size and forecast 2023-2028 ($ million)
      • Data Table on North America - Market size and forecast 2023-2028 ($ million)
      • Chart on North America - Year-over-year growth 2023-2028 (%)
      • Data Table on North America - Year-over-year growth 2023-2028 (%)
    • 9.4 Europe - Market size and forecast 2023-2028
      • Chart on Europe - Market size and forecast 2023-2028 ($ million)
      • Data Table on Europe - Market size and forecast 2023-2028 ($ million)
      • Chart on Europe - Year-over-year growth 2023-2028 (%)
      • Data Table on Europe - Year-over-year growth 2023-2028 (%)
    • 9.5 Asia - Market size and forecast 2023-2028
      • Chart on Asia - Market size and forecast 2023-2028 ($ million)
      • Data Table on Asia - Market size and forecast 2023-2028 ($ million)
      • Chart on Asia - Year-over-year growth 2023-2028 (%)
      • Data Table on Asia - Year-over-year growth 2023-2028 (%)
    • 9.6 Rest of World (ROW) - Market size and forecast 2023-2028
      • Chart on Rest of World (ROW) - Market size and forecast 2023-2028 ($ million)
      • Data Table on Rest of World (ROW) - Market size and forecast 2023-2028 ($ million)
      • Chart on Rest of World (ROW) - Year-over-year growth 2023-2028 (%)
      • Data Table on Rest of World (ROW) - Year-over-year growth 2023-2028 (%)
    • 9.7 US - Market size and forecast 2023-2028
      • Chart on US - Market size and forecast 2023-2028 ($ million)
      • Data Table on US - Market size and forecast 2023-2028 ($ million)
      • Chart on US - Year-over-year growth 2023-2028 (%)
      • Data Table on US - Year-over-year growth 2023-2028 (%)
    • 9.8 China - Market size and forecast 2023-2028
      • Chart on China - Market size and forecast 2023-2028 ($ million)
      • Data Table on China - Market size and forecast 2023-2028 ($ million)
      • Chart on China - Year-over-year growth 2023-2028 (%)
      • Data Table on China - Year-over-year growth 2023-2028 (%)
    • 9.9 UK - Market size and forecast 2023-2028
      • Chart on UK - Market size and forecast 2023-2028 ($ million)
      • Data Table on UK - Market size and forecast 2023-2028 ($ million)
      • Chart on UK - Year-over-year growth 2023-2028 (%)
      • Data Table on UK - Year-over-year growth 2023-2028 (%)
    • 9.10 Germany - Market size and forecast 2023-2028
      • Chart on Germany - Market size and forecast 2023-2028 ($ million)
      • Data Table on Germany - Market size and forecast 2023-2028 ($ million)
      • Chart on Germany - Year-over-year growth 2023-2028 (%)
      • Data Table on Germany - Year-over-year growth 2023-2028 (%)
    • 9.11 Canada - Market size and forecast 2023-2028
      • Chart on Canada - Market size and forecast 2023-2028 ($ million)
      • Data Table on Canada - Market size and forecast 2023-2028 ($ million)
      • Chart on Canada - Year-over-year growth 2023-2028 (%)
      • Data Table on Canada - Year-over-year growth 2023-2028 (%)
    • 9.12 Market opportunity by geography
      • Market opportunity by geography ($ million)
      • Data Tables on Market opportunity by geography ($ million)

    10 Drivers, Challenges, and Opportunity/Restraints

    • 10.1 Market drivers
      • 10.2 Market challenges
        • 10.3 Impact of drivers and challenges
          • Impact of drivers and challenges in 2023 and 2028
        • 10.4 Market opportunities/restraints

          11 Competitive Landscape

          • 11.1 Overview
            • 11.2 Competitive Landscape
              • Overview on criticality of inputs and factors of differentiation
            • 11.3 Landscape disruption
              • Overview on factors of disruption
            • 11.4 Industry risks
              • Impact of key risks on business

            12 Competitive Analysis

            • 12.1 Companies profiled
              • Companies covered
            • 12.2 Market positioning of companies
              • Matrix on companies position and classification
            • 12.3 Agilent Technologies Inc.
              • Agilent Technologies Inc. - Overview
              • Agilent Technologies Inc. - Business segments
              • Agilent Technologies Inc. - Key news
              • Agilent Technologies Inc. - Key offerings
              • Agilent Technologies Inc. - Segment focus
            • 12.4 Amphasys AG
              • Amphasys AG - Overview
              • Amphasys AG - Product / Service
              • Amphasys AG - Key offerings
            • 12.5 Apogee Flow Systems Ltd.
              • Apogee Flow Systems Ltd. - Overview
              • Apogee Flow Systems Ltd. - Product / Service
              • Apogee Flow Systems Ltd. - Key offerings
            • 12.6 Becton Dickinson and Co.
              • Becton Dickinson and Co. - Overview
              • Becton Dickinson and Co. - Business segments
              • Becton Dickinson and Co. - Key news
              • Becton Dickinson and Co. - Key offerings
              • Becton Dickinson and Co. - Segment focus
            • 12.7 Bio Rad Laboratories Inc.
              • Bio Rad Laboratories Inc. - Overview
              • Bio Rad Laboratories Inc. - Business segments
              • Bio Rad Laboratories Inc. - Key news
              • Bio Rad Laboratories Inc. - Key offerings
              • Bio Rad Laboratories Inc. - Segment focus
            • 12.8 Cytek Biosciences Inc.
              • Cytek Biosciences Inc. - Overview
              • Cytek Biosciences Inc. - Product / Service
              • Cytek Biosciences Inc. - Key news
              • Cytek Biosciences Inc. - Key offerings
            • 12.9 Danaher Corp.
              • Danaher Corp. - Overview
              • Danaher Corp. - Business segments
              • Danaher Corp. - Key news
              • Danaher Corp. - Key offerings
              • Danaher Corp. - Segment focus
            • 12.10 DiaSorin SpA
              • DiaSorin SpA - Overview
              • DiaSorin SpA - Business segments
              • DiaSorin SpA - Key news
              • DiaSorin SpA - Key offerings
              • DiaSorin SpA - Segment focus
            • 12.11 Enzo Biochem Inc.
              • Enzo Biochem Inc. - Overview
              • Enzo Biochem Inc. - Product / Service
              • Enzo Biochem Inc. - Key news
              • Enzo Biochem Inc. - Key offerings
            • 12.12 Miltenyi Biotec B.V. and Co. KG
              • Miltenyi Biotec B.V. and Co. KG - Overview
              • Miltenyi Biotec B.V. and Co. KG - Product / Service
              • Miltenyi Biotec B.V. and Co. KG - Key news
              • Miltenyi Biotec B.V. and Co. KG - Key offerings
            • 12.13 Sartorius AG
              • Sartorius AG - Overview
              • Sartorius AG - Business segments
              • Sartorius AG - Key news
              • Sartorius AG - Key offerings
              • Sartorius AG - Segment focus
            • 12.14 Sony Group Corp.
              • Sony Group Corp. - Overview
              • Sony Group Corp. - Business segments
              • Sony Group Corp. - Key news
              • Sony Group Corp. - Key offerings
              • Sony Group Corp. - Segment focus
            • 12.15 Stratedigm Inc.
              • Stratedigm Inc. - Overview
              • Stratedigm Inc. - Product / Service
              • Stratedigm Inc. - Key offerings
            • 12.16 Sysmex Corp.
              • Sysmex Corp. - Overview
              • Sysmex Corp. - Business segments
              • Sysmex Corp. - Key offerings
              • Sysmex Corp. - Segment focus
            • 12.17 Thermo Fisher Scientific Inc.
              • Thermo Fisher Scientific Inc. - Overview
              • Thermo Fisher Scientific Inc. - Business segments
              • Thermo Fisher Scientific Inc. - Key news
              • Thermo Fisher Scientific Inc. - Key offerings
              • Thermo Fisher Scientific Inc. - Segment focus

            13 Appendix

            • 13.1 Scope of the report
              • 13.2 Inclusions and exclusions checklist
                • Inclusions checklist
                • Exclusions checklist
              • 13.3 Currency conversion rates for US$
                • Currency conversion rates for US$
              • 13.4 Research methodology
                • Research methodology
              • 13.5 Data procurement
                • Information sources
              • 13.6 Data validation
                • Data validation
              • 13.7 Validation techniques employed for market sizing
                • Validation techniques employed for market sizing
              • 13.8 Data synthesis
                • Data synthesis
              • 360 degree market analysis
                • 360 degree market analysis
              • 13.10 List of abbreviations
                • List of abbreviations

              Research Methodology

              Technavio presents a detailed picture of the market by way of study, synthesis, and summation of data from multiple sources. The analysts have presented the various facets of the market with a particular focus on identifying the key industry influencers. The data thus presented is comprehensive, reliable, and the result of extensive research, both primary and secondary.

              INFORMATION SOURCES

              Primary sources

              • Manufacturers and suppliers
              • Channel partners
              • Industry experts
              • Strategic decision makers

              Secondary sources

              • Industry journals and periodicals
              • Government data
              • Financial reports of key industry players
              • Historical data
              • Press releases

              DATA ANALYSIS

              Data Synthesis

              • Collation of data
              • Estimation of key figures
              • Analysis of derived insights

              Data Validation

              • Triangulation with data models
              • Reference against proprietary databases
              • Corroboration with industry experts

              REPORT WRITING

              Qualitative

              • Market drivers
              • Market challenges
              • Market trends
              • Five forces analysis

              Quantitative

              • Market size and forecast
              • Market segmentation
              • Geographical insights
              • Competitive landscape

              Interested in this report?

              Get your sample now to see our research methodology and insights!

              Download Now

              Frequently Asked Questions

              Flow Cytometer market growth will increase by $ 8170.7 mn during 2024-2028 .

              The Flow Cytometer market is expected to grow at a CAGR of 15.2% during 2024-2028 .

              Flow Cytometer market is segmented by Product( Reagents and consumables, Instruments, Others) End-user( Pharmaceutical industry, Health and diagnostic centers, Others)

              Abbott Laboratories, Agilent Technologies Inc., Amphasys AG, Apogee Flow Systems Ltd., Becton Dickinson and Co., Bio Rad Laboratories Inc., Cytek Biosciences Inc., Danaher Corp., DiaSorin SpA, Enzo Biochem Inc., Miltenyi Biotec B.V. and Co. KG, Shenzhen Mindray BioMedical Electronics Co. Ltd, OLS OMNI Life Science GmbH and Co. KG, On-Chip Biotechnologies Co. Ltd., Sartorius AG, Sony Group Corp., Stratedigm Inc., Sysmex Corp., Thermo Fisher Scientific Inc., Union Biometrica Inc. are a few of the key vendors in the Flow Cytometer market.

              North America will register the highest growth rate of 32% among the other regions. Therefore, the Flow Cytometer market in North America is expected to garner significant business opportunities for the vendors during the forecast period.

              US, China, UK, Germany, Canada

              • Increasing expenditure on R and DThe global expenditure on R and D has seen steady growth over the last ten years. The increasing prevalence and incidence of various diseases is the driving factor this market.
              • such as cancer is the driving factor this market.
              • diabetes is the driving factor this market.
              • COVID-19 is the driving factor this market.
              • heart diseases is the driving factor this market.
              • chronic obstructive pulmonary disease (COPD) is the driving factor this market.
              • and dementia is the driving factor this market.
              • have driven the need for developing biologics and small molecules for treating diseases effectively. Pharmaceutical companies are continuously focusing on R and D activities for the development of new drug molecules to enhance their product pipeline for a wide range of therapeutic applications. They are increasing their R and D expenditure on discovering and developing novel drugs. The growing demand for advanced technologies is the major factor contributing to the growth of this segment of the is the driving factor this market.
              • 65 is the driving factor this market.
              • 65); font-size: 14px">global flow cytometry market during the forecast period. is the driving factor this market.

              The Flow Cytometer market vendors should focus on grabbing business opportunities from the Reagents and consumables segment as it accounted for the largest market share in the base year.