Food Flavors Market Analysis, Size, and Forecast 2026-2030: North America (US, Canada, and Mexico), Europe (Germany, UK, and France), APAC (China, India, and Japan), South America (Brazil and Argentina), Middle East and Africa (Saudi Arabia, UAE, and South Africa), and Rest of World (ROW)

Food Flavors Market Analysis, Size, and Forecast 2026-2030:
North America (US, Canada, and Mexico), Europe (Germany, UK, and France), APAC (China, India, and Japan), South America (Brazil and Argentina), Middle East and Africa (Saudi Arabia, UAE, and South Africa), and Rest of World (ROW)

Published: Mar 2026 295 Pages SKU: IRTNTR43501

Market Overview at a Glance

$7.24 B
Market Opportunity
6.7%
CAGR 2025 - 2030
29.2%
North America Growth
$11.90 B
Natural flavors segment 2024

Food Flavors Market Size 2026-2030

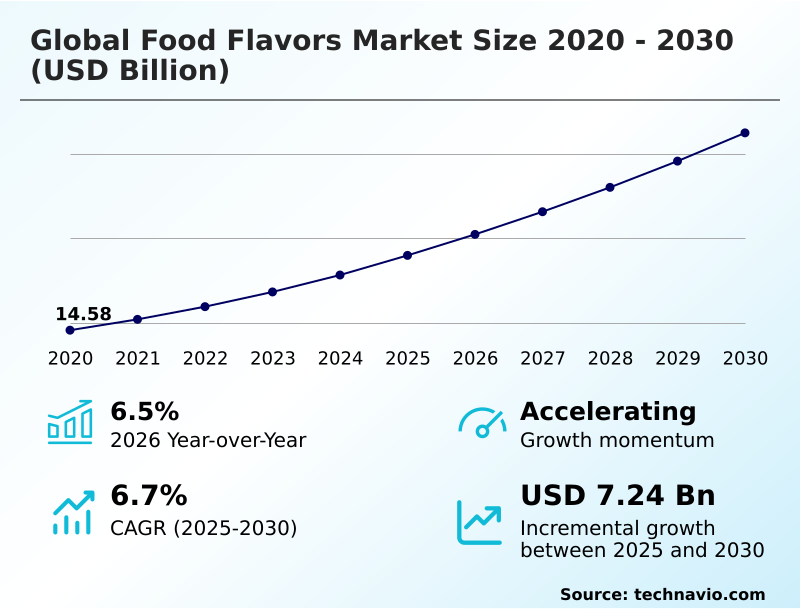
The food flavors market size is valued to increase by USD 7.24 billion, at a CAGR of 6.7% from 2025 to 2030. Increasing demand for natural and clean-label ingredients will drive the food flavors market.

Major Market Trends & Insights

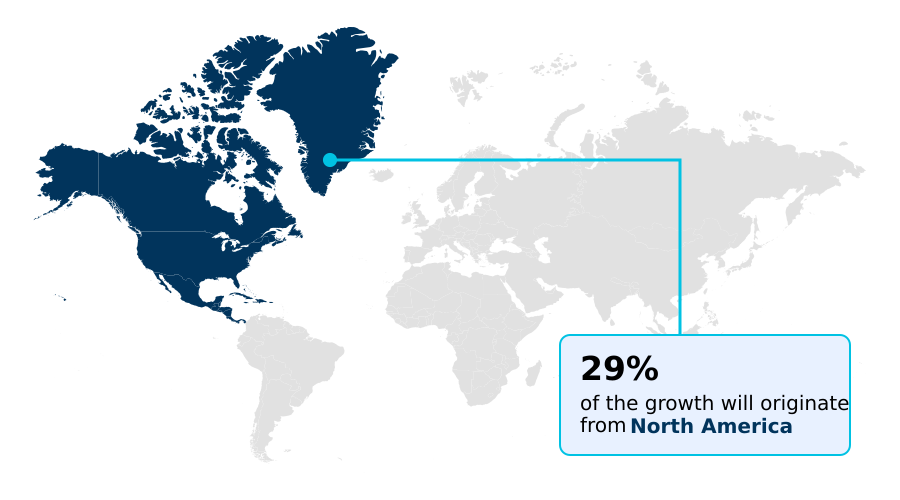
  • North America dominated the market and accounted for a 29.2% growth during the forecast period.
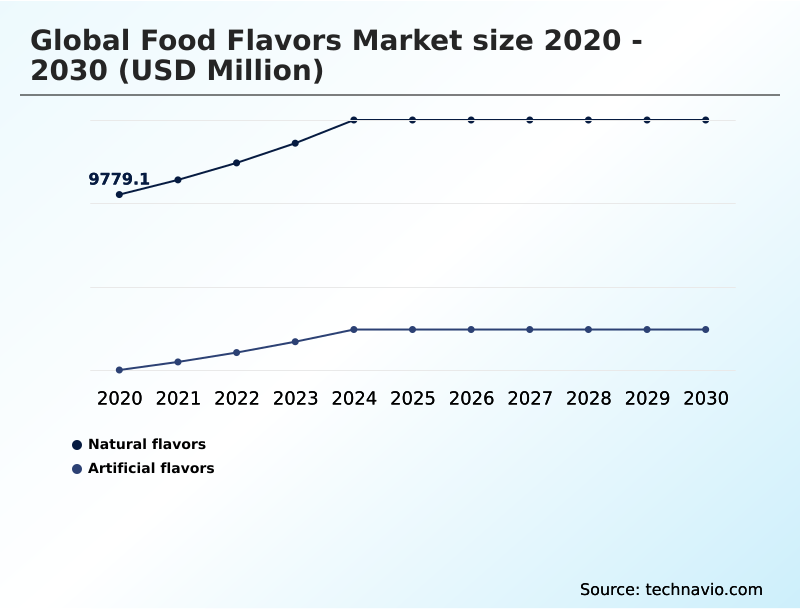
  • By Product - Natural flavors segment was valued at USD 11.90 billion in 2024
  • By Application - Food segment accounted for the largest market revenue share in 2024

Market Size & Forecast

  • Market Opportunities: USD 11.67 billion
  • Market Future Opportunities: USD 7.24 billion
  • CAGR from 2025 to 2030 : 6.7%

Market Summary

  • The food flavors market is undergoing a significant transformation, driven by consumer demand for authenticity and wellness. This shift compels a move away from traditional artificial flavor synthesis towards sophisticated natural flavor extraction and biosynthetic flavor molecules produced via precision fermentation.
  • Key industry efforts are focused on developing clean-label flavor systems and effective plant-based masking agents to improve the palatability of alternative proteins. A critical business scenario involves optimizing the supply chain for volatile citrus oils, where advanced flavor encapsulation technology is used to prevent oxidation, extending shelf life and reducing product waste by up to 15%.
  • Innovations in flavor modulation are also central, enabling the creation of low-sugar products without compromising taste. The global food flavors market 2026-2030 is increasingly defined by the convergence of sensory science and sustainable technology, addressing both consumer preferences and regulatory pressures.

What will be the Size of the Food Flavors Market during the forecast period?

Get Key Insights on Market Forecast (PDF) Request Free Sample

How is the Food Flavors Market Segmented?

The food flavors industry research report provides comprehensive data (region-wise segment analysis), with forecasts and estimates in "USD million" for the period 2026-2030, as well as historical data from 2020-2024 for the following segments.

  • Product
    • Natural flavors
    • Artificial flavors
  • Application
    • Food
    • Beverages
  • End-user
    • Food processing
    • Foodservice
    • Household
  • Geography
    • North America
      • US
      • Canada
      • Mexico
    • Europe
      • Germany
      • UK
      • France
    • APAC
      • China
      • India
      • Japan
    • South America
      • Brazil
      • Argentina
    • Middle East and Africa
      • Saudi Arabia
      • UAE
      • South Africa
    • Rest of World (ROW)

By Product Insights

The natural flavors segment is estimated to witness significant growth during the forecast period.

The natural flavors segment is propelled by a fundamental shift in consumer demand for ingredient transparency. This forces manufacturers to pivot from artificial flavor synthesis toward authentic botanical sources.

Adherence to clean-label standards is now a primary purchasing driver, with advanced flavor encapsulation technology and precision fermentation flavors enabling the development of high-stability products.

For instance, new flavor delivery systems have been shown to improve taste retention in processed foods by over 20%. The industry leverages heat-stable flavor carrier ingredients and effective off-note masking for plant-based applications.

The focus remains on biotechnology in flavor production, particularly for sugar and salt reduction technology, while ensuring synthetic flavor stability and addressing challenges like bitterness masking solutions for functional foods.

Request Free Sample

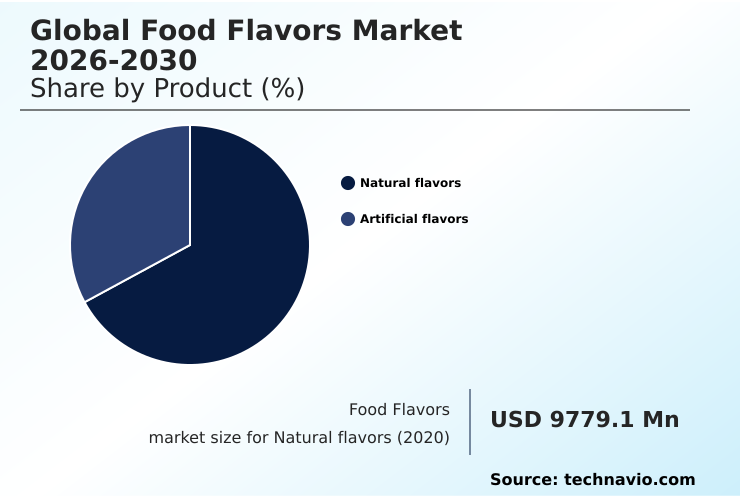
The Natural flavors segment was valued at USD 11.90 billion in 2024 and showed a gradual increase during the forecast period.

Request Free Sample

Regional Analysis

North America is estimated to contribute 29.2% to the growth of the global market during the forecast period.Technavio’s analysts have elaborately explained the regional trends and drivers that shape the market during the forecast period.

See How Food Flavors Market Demand is Rising in North America Request Free Sample

The geographic landscape of the food flavors market is diversified, with North America leading incremental growth, contributing over 29% of the global expansion. This region exhibits strong demand for advanced plant-based masking agents and savory flavor profiles for health-oriented products.

In APAC, rapid urbanization is fueling the need for cost-effective umami flavor enhancers and high-intensity natural sweeteners.

Innovations such as cold-press extraction and enzymatic processes are being adopted globally to meet clean-label standards, with some facilities reporting a 15% increase in yield from raw materials through such technologies.

The development of specialized hydrocolloid flavor carriers supports the expansion of the beverage sector in emerging economies by improving the stability of fermented flavor ingredients and natural sweetener applications in diverse climates.

Market Dynamics

Our researchers analyzed the data with 2025 as the base year, along with the key drivers, trends, and challenges. A holistic analysis of drivers will help companies refine their marketing strategies to gain a competitive advantage.

  • Strategic decision-making in the food flavors market increasingly revolves around a complex set of technical and commercial factors. A thorough cost-benefit of natural vs artificial flavors is essential, especially when formulating clean-label savory snacks.
  • Key challenges include overcoming off-notes in plant-based dairy and stabilizing volatile oils in beverages, where the impact of encapsulation on flavor release is a critical performance metric. The role of AI in predicting flavor trends is becoming indispensable, with some platforms reducing development cycles by half compared to traditional methods.
  • Firms must also navigate the intricate regulatory compliance for natural flavor claims. Advances in heat-stable baking flavors and technologies for masking protein bitterness are creating new opportunities. Concurrently, the sustainability of precision fermentation flavors and applications for upcycled citrus peel flavors are gaining boardroom attention.
  • Understanding flavor solutions for salt reduction and how to develop functional flavors for wellness drinks is paramount for market differentiation.
  • Furthermore, creating authentic ethnic flavor profiles and nostalgic flavor profiles requires a deep understanding of consumer psychology, while a cost analysis of synthetic vanillin informs sourcing strategies amid challenges in sourcing vanilla beans and the high costs of clean label flavor masking techniques.

What are the key market drivers leading to the rise in the adoption of Food Flavors Industry?

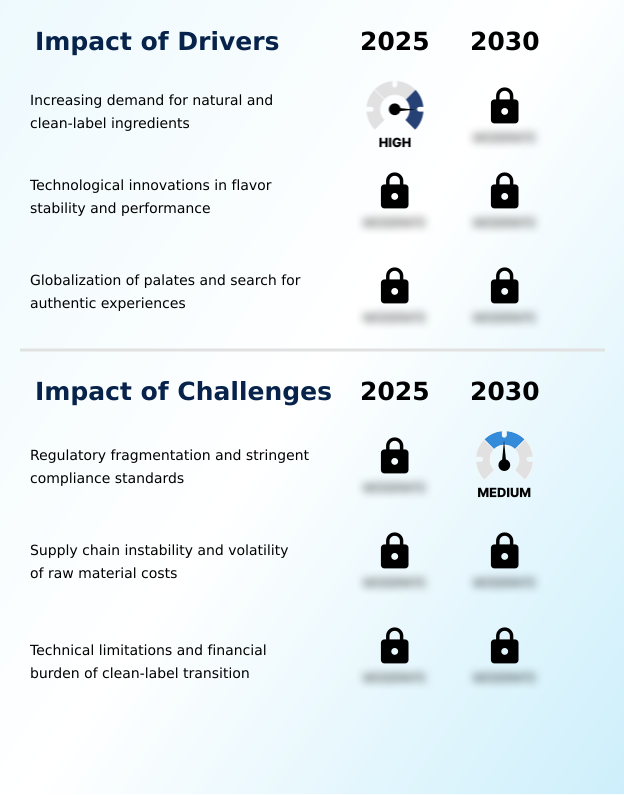
  • The increasing demand for natural and clean-label ingredients is a key driver of the global food flavors market.

  • The primary market driver is the consumer-led demand for naturality, pushing the industry toward clean-label flavor systems and sustainable sourcing.
  • The adoption of natural flavor extraction techniques using food-grade solvents has become widespread, while the development of sustainable aroma chemicals is a key focus.
  • This movement is supported by a significant increase in the use of upcycled flavoring agents and botanical extracts, with some manufacturers reducing raw material waste by over 20%.
  • As a result, there is strong growth in non-GMO extracts and products with organic flavor certification.
  • The natural flavor formulation process is also evolving, with an emphasis on botanical ingredient sourcing and clean-label ingredient solutions to meet the transparency demanded by consumers.
  • This shift not only aligns with consumer values but also opens new avenues for innovation in product formulation.

What are the market trends shaping the Food Flavors Industry?

  • The integration of artificial intelligence and hyper-personalization is an emerging market trend, enabling the creation of highly targeted and customized sensory experiences.

  • Key market trends are redefining product development, with a strong emphasis on functional and personalized offerings. The application of molecular sensory science, for instance, allows for the creation of targeted mouthfeel enhancers and terpene-rich flavors that deliver specific wellness benefits, with R&D teams reporting a 25% faster path to viable prototypes.
  • The use of flavor modulation is critical in achieving these goals, especially for sugar reduction solutions in beverages. As part of this trend, sensory data analytics and AI in flavor creation are being leveraged to predict consumer preferences, improving new product success rates by up to 18%.
  • This data-driven approach, combined with advanced sensory panel testing and a focus on unique terpene flavor profiles, enables the development of highly differentiated products that align with the growing demand for customized and health-conscious food and beverage options.

What challenges does the Food Flavors Industry face during its growth?

  • Regulatory fragmentation and stringent compliance standards are key challenges affecting the growth of the global food flavors market.

  • Navigating the complex global regulatory landscape presents a significant market challenge, particularly concerning the classification of biosynthetic flavor molecules and smoke flavor primary products. Discrepancies in international standards increase compliance costs and can delay market entry, with some companies reporting a 15% increase in regulatory-related expenditures.
  • Supply chain volatility for key raw materials like volatile citrus oils and aroma chemicals further complicates operations. The production of halal certified flavors requires stringent oversight, while the cost-competitiveness of biosynthetic vanillin production against natural sources remains a hurdle.
  • Ensuring synthetic flavor stability during transport and storage is another technical challenge, demanding careful flavor carrier selection and robust aroma profile analysis to prevent issues such as citrus oil oxidation, which can lead to significant product loss.

Exclusive Technavio Analysis on Customer Landscape

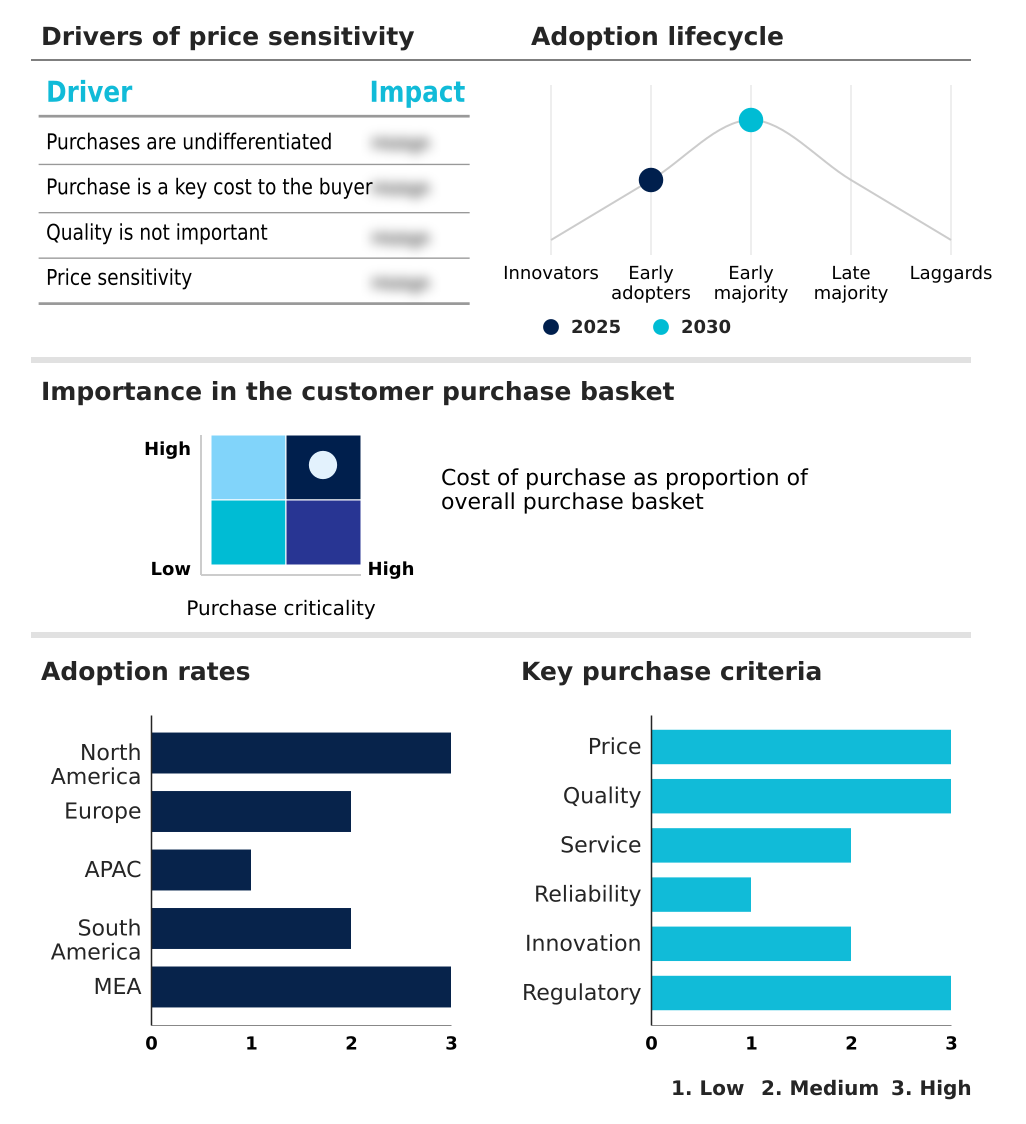
The food flavors market forecasting report includes the adoption lifecycle of the market, covering from the innovator’s stage to the laggard’s stage. It focuses on adoption rates in different regions based on penetration. Furthermore, the food flavors market report also includes key purchase criteria and drivers of price sensitivity to help companies evaluate and develop their market growth analysis strategies.

Customer Landscape of Food Flavors Industry

Competitive Landscape

Companies are implementing various strategies, such as strategic alliances, food flavors market forecast, partnerships, mergers and acquisitions, geographical expansion, and product/service launches, to enhance their presence in the industry.

Apex Flavors Inc. - Analysis indicates a portfolio focused on custom seasoning blends, compound flavors, and coating systems designed for multinational food manufacturers and foodservice operators.

The industry research and growth report includes detailed analyses of the competitive landscape of the market and information about key companies, including:

  • Apex Flavors Inc.
  • Archer Daniels Midland Co.
  • Bell Flavors and Fragrances Inc.
  • DSM Firmenich AG
  • Flavorchem and Orchidia Fragrances
  • Givaudan SA
  • GOLD COAST INGREDIENTS INC.
  • Huabao International Holdings Ltd.
  • International Flavors Inc.
  • Kalsec Inc.
  • Kerry Group Plc
  • McCormick and Co. Inc.
  • Ogawa and Co. Ltd.
  • Robertet SA
  • Sensient Technologies Corp.
  • Symrise Group
  • Synergy Flavors Inc.
  • T.Hasegawa USA Inc.
  • Takasago International Corp.
  • TREATT Plc
  • V Mane Fils

Qualitative and quantitative analysis of companies has been conducted to help clients understand the wider business environment as well as the strengths and weaknesses of key industry players. Data is qualitatively analyzed to categorize companies as pure play, category-focused, industry-focused, and diversified; it is quantitatively analyzed to categorize companies as dominant, leading, strong, tentative, and weak.

Recent Development and News in Food flavors market

  • In August 2024, a significant research initiative in the United Kingdom successfully isolated a new series of aromatic compounds from upcycled agricultural waste, providing a sustainable and natural alternative to traditional fruit flavors.
  • In October 2024, a partnership between an agricultural technology firm and a flavor house led to the development of a mushroom-based flavor enhancer that utilizes the mycelium grown on agricultural side streams such as corn husks.
  • In March 2025, a global flavor leader introduced a revolutionary nano-encapsulation technology that protects volatile citrus oils from oxidation, effectively doubling the shelf life of carbonated beverages in warm climates.
  • In May 2025, a specialized chemical engineering firm developed a heat-stable flavor carrier that prevents the degradation of delicate vanilla and cocoa notes during the industrial baking process.

Dive into Technavio’s robust research methodology, blending expert interviews, extensive data synthesis, and validated models for unparalleled Food Flavors Market insights. See full methodology.

Market Scope
Page number 295
Base year 2025
Historic period 2020-2024
Forecast period 2026-2030
Growth momentum & CAGR Accelerate at a CAGR of 6.7%
Market growth 2026-2030 USD 7244.5 million
Market structure Fragmented
YoY growth 2025-2026(%) 6.5%
Key countries US, Canada, Mexico, Germany, UK, France, Italy, Spain, The Netherlands, China, India, Japan, South Korea, Australia, Indonesia, Brazil, Argentina, Chile, Saudi Arabia, UAE, South Africa, Turkey and Egypt
Competitive landscape Leading Companies, Market Positioning of Companies, Competitive Strategies, and Industry Risks

Request Free Sample

Research Analyst Overview

  • The food flavors market is driven by sophisticated technological advancements and a decisive pivot towards naturality. Boardroom decisions are increasingly centered on investing in biosynthetic flavor molecules and precision fermentation flavors to mitigate supply chain volatility associated with traditional botanical extracts. The adoption of advanced natural flavor extraction methods like supercritical CO2 extraction, cold-press extraction, and oleoresin extraction is becoming standard.
  • Innovations in flavor delivery systems, including flavor encapsulation technology and hydrocolloid flavor carriers, are critical for product stability. Formulators rely on salt reduction technology, sugar reduction solutions, and various mouthfeel enhancers to create healthier products. Key technologies include heat-stable flavor carriers for baked goods, plant-based masking agents for off-note masking, and the use of food-grade solvents.
  • The creation of savory flavor profiles, umami flavor enhancers, and reaction flavors requires deep expertise in molecular sensory science and enzymatic processes. With firms achieving up to a 40% reduction in formulation time using sensory data analytics, the integration of AI is reshaping R&D.
  • The market also focuses on specific ingredients like volatile citrus oils, aroma chemicals, non-GMO extracts, smoke flavor primary products, and terpene-rich flavors, alongside a commitment to upcycled flavoring agents and halal certified flavors.

What are the Key Data Covered in this Food Flavors Market Research and Growth Report?

  • What is the expected growth of the Food Flavors Market between 2026 and 2030?

    • USD 7.24 billion, at a CAGR of 6.7%

  • What segmentation does the market report cover?

    • The report is segmented by Product (Natural flavors, and Artificial flavors), Application (Food, and Beverages), End-user (Food processing, Foodservice, and Household) and Geography (North America, Europe, APAC, South America, Middle East and Africa)

  • Which regions are analyzed in the report?

    • North America, Europe, APAC, South America and Middle East and Africa

  • What are the key growth drivers and market challenges?

    • Increasing demand for natural and clean-label ingredients, Regulatory fragmentation and stringent compliance standards

  • Who are the major players in the Food Flavors Market?

    • Apex Flavors Inc., Archer Daniels Midland Co., Bell Flavors and Fragrances Inc., DSM Firmenich AG, Flavorchem and Orchidia Fragrances, Givaudan SA, GOLD COAST INGREDIENTS INC., Huabao International Holdings Ltd., International Flavors Inc., Kalsec Inc., Kerry Group Plc, McCormick and Co. Inc., Ogawa and Co. Ltd., Robertet SA, Sensient Technologies Corp., Symrise Group, Synergy Flavors Inc., T.Hasegawa USA Inc., Takasago International Corp., TREATT Plc and V Mane Fils

Market Research Insights

  • The dynamics of the food flavors market are shaped by technological innovation and evolving consumer preferences. The strategic selection of a flavor carrier, for instance, can enhance baking-stable flavors, improving product quality and reducing rework rates by up to 10%.
  • Meanwhile, the successful application of bitterness masking solutions in functional beverages has been shown to increase consumer acceptance scores by over 30%. Advances in synthetic flavor stability and microencapsulation of flavors allow for greater product resilience in complex supply chains. As manufacturers seek to meet clean-label demands, the focus on organic flavor certification and halal flavor ingredients intensifies.
  • This requires rigorous aroma profile analysis to ensure compliance and authenticity, pushing the industry toward more sophisticated and sustainable production methods.

We can help! Our analysts can customize this food flavors market research report to meet your requirements.

Get in touch

1. Executive Summary

1.1 Market overview

Executive Summary - Chart on Market Overview
Executive Summary - Data Table on Market Overview
Executive Summary - Chart on Global Market Characteristics
Executive Summary - Chart on Market by Geography
Executive Summary - Chart on Market Segmentation by Product
Executive Summary - Chart on Market Segmentation by Application
Executive Summary - Chart on Market Segmentation by End-user
Executive Summary - Chart on Incremental Growth
Executive Summary - Data Table on Incremental Growth
Executive Summary - Chart on Company Market Positioning

2. Technavio Analysis

2.1 Analysis of price sensitivity, lifecycle, customer purchase basket, adoption rates, and purchase criteria

2.2 Criticality of inputs and Factors of differentiation

Chart on Overview on criticality of inputs and factors of differentiation

2.3 Factors of disruption

Chart on Overview on factors of disruption

2.4 Impact of drivers and challenges

Chart on Impact of drivers and challenges in 2025 and 2030

3. Market Landscape

3.1 Market ecosystem

Chart on Parent Market
Data Table on - Parent Market

3.2 Market characteristics

Chart on Market characteristics analysis

3.3 Value chain analysis

Chart on Value chain analysis

4. Market Sizing

4.1 Market definition

Data Table on Offerings of companies included in the market definition

4.2 Market segment analysis

Market segments

4.3 Market size 2025

4.4 Market outlook: Forecast for 2025-2030

Chart on Global - Market size and forecast 2025-2030 ($ million)
Data Table on Global - Market size and forecast 2025-2030 ($ million)
Chart on Global Market: Year-over-year growth 2025-2030 (%)
Data Table on Global Market: Year-over-year growth 2025-2030 (%)

5. Historic Market Size

5.1 Global Food Flavors Market 2020 - 2024

Historic Market Size - Data Table on Global Food Flavors Market 2020 - 2024 ($ million)

5.2 Product segment analysis 2020 - 2024

Historic Market Size - Product Segment 2020 - 2024 ($ million)

5.3 Application segment analysis 2020 - 2024

Historic Market Size - Application Segment 2020 - 2024 ($ million)

5.4 End-user segment analysis 2020 - 2024

Historic Market Size - End-user Segment 2020 - 2024 ($ million)

5.5 Geography segment analysis 2020 - 2024

Historic Market Size - Geography Segment 2020 - 2024 ($ million)

5.6 Country segment analysis 2020 - 2024

Historic Market Size - Country Segment 2020 - 2024 ($ million)

6. Qualitative Analysis

6.1 The AI impact on global food flavors market

7. Five Forces Analysis

7.1 Five forces summary

Five forces analysis - Comparison between 2025 and 2030

7.2 Bargaining power of buyers

Bargaining power of buyers - Impact of key factors 2025 and 2030

7.3 Bargaining power of suppliers

Bargaining power of suppliers - Impact of key factors in 2025 and 2030

7.4 Threat of new entrants

Threat of new entrants - Impact of key factors in 2025 and 2030

7.5 Threat of substitutes

Threat of substitutes - Impact of key factors in 2025 and 2030

7.6 Threat of rivalry

Threat of rivalry - Impact of key factors in 2025 and 2030

7.7 Market condition

Chart on Market condition - Five forces 2025 and 2030

8. Market Segmentation by Product

8.1 Market segments

Chart on Product - Market share 2025-2030 (%)
Data Table on Product - Market share 2025-2030 (%)

8.2 Comparison by Product

Chart on Comparison by Product
Data Table on Comparison by Product

8.3 Natural flavors - Market size and forecast 2025-2030

Chart on Natural flavors - Market size and forecast 2025-2030 ($ million)
Data Table on Natural flavors - Market size and forecast 2025-2030 ($ million)
Chart on Natural flavors - Year-over-year growth 2025-2030 (%)
Data Table on Natural flavors - Year-over-year growth 2025-2030 (%)

8.4 Artificial flavors - Market size and forecast 2025-2030

Chart on Artificial flavors - Market size and forecast 2025-2030 ($ million)
Data Table on Artificial flavors - Market size and forecast 2025-2030 ($ million)
Chart on Artificial flavors - Year-over-year growth 2025-2030 (%)
Data Table on Artificial flavors - Year-over-year growth 2025-2030 (%)

8.5 Market opportunity by Product

Market opportunity by Product ($ million)
Data Table on Market opportunity by Product ($ million)

9. Market Segmentation by Application

9.1 Market segments

Chart on Application - Market share 2025-2030 (%)
Data Table on Application - Market share 2025-2030 (%)

9.2 Comparison by Application

Chart on Comparison by Application
Data Table on Comparison by Application

9.3 Food - Market size and forecast 2025-2030

Chart on Food - Market size and forecast 2025-2030 ($ million)
Data Table on Food - Market size and forecast 2025-2030 ($ million)
Chart on Food - Year-over-year growth 2025-2030 (%)
Data Table on Food - Year-over-year growth 2025-2030 (%)

9.4 Beverages - Market size and forecast 2025-2030

Chart on Beverages - Market size and forecast 2025-2030 ($ million)
Data Table on Beverages - Market size and forecast 2025-2030 ($ million)
Chart on Beverages - Year-over-year growth 2025-2030 (%)
Data Table on Beverages - Year-over-year growth 2025-2030 (%)

9.5 Market opportunity by Application

Market opportunity by Application ($ million)
Data Table on Market opportunity by Application ($ million)

10. Market Segmentation by End-user

10.1 Market segments

Chart on End-user - Market share 2025-2030 (%)
Data Table on End-user - Market share 2025-2030 (%)

10.2 Comparison by End-user

Chart on Comparison by End-user
Data Table on Comparison by End-user

10.3 Food processing - Market size and forecast 2025-2030

Chart on Food processing - Market size and forecast 2025-2030 ($ million)
Data Table on Food processing - Market size and forecast 2025-2030 ($ million)
Chart on Food processing - Year-over-year growth 2025-2030 (%)
Data Table on Food processing - Year-over-year growth 2025-2030 (%)

10.4 Foodservice - Market size and forecast 2025-2030

Chart on Foodservice - Market size and forecast 2025-2030 ($ million)
Data Table on Foodservice - Market size and forecast 2025-2030 ($ million)
Chart on Foodservice - Year-over-year growth 2025-2030 (%)
Data Table on Foodservice - Year-over-year growth 2025-2030 (%)

10.5 Household - Market size and forecast 2025-2030

Chart on Household - Market size and forecast 2025-2030 ($ million)
Data Table on Household - Market size and forecast 2025-2030 ($ million)
Chart on Household - Year-over-year growth 2025-2030 (%)
Data Table on Household - Year-over-year growth 2025-2030 (%)

10.6 Market opportunity by End-user

Market opportunity by End-user ($ million)
Data Table on Market opportunity by End-user ($ million)

11. Customer Landscape

11.1 Customer landscape overview

Analysis of price sensitivity, lifecycle, customer purchase basket, adoption rates, and purchase criteria

12. Geographic Landscape

12.1 Geographic segmentation

Chart on Market share by geography 2025-2030 (%)
Data Table on Market share by geography 2025-2030 (%)

12.2 Geographic comparison

Chart on Geographic comparison
Data Table on Geographic comparison

12.3 North America - Market size and forecast 2025-2030

Chart on North America - Market size and forecast 2025-2030 ($ million)
Data Table on North America - Market size and forecast 2025-2030 ($ million)
Chart on North America - Year-over-year growth 2025-2030 (%)
Data Table on North America - Year-over-year growth 2025-2030 (%)
Chart on Regional Comparison - North America
Data Table on Regional Comparison - North America

12.3.1 US - Market size and forecast 2025-2030

Chart on US - Market size and forecast 2025-2030 ($ million)
Data Table on US - Market size and forecast 2025-2030 ($ million)
Chart on US - Year-over-year growth 2025-2030 (%)
Data Table on US - Year-over-year growth 2025-2030 (%)

12.3.2 Canada - Market size and forecast 2025-2030

Chart on Canada - Market size and forecast 2025-2030 ($ million)
Data Table on Canada - Market size and forecast 2025-2030 ($ million)
Chart on Canada - Year-over-year growth 2025-2030 (%)
Data Table on Canada - Year-over-year growth 2025-2030 (%)

12.3.3 Mexico - Market size and forecast 2025-2030

Chart on Mexico - Market size and forecast 2025-2030 ($ million)
Data Table on Mexico - Market size and forecast 2025-2030 ($ million)
Chart on Mexico - Year-over-year growth 2025-2030 (%)
Data Table on Mexico - Year-over-year growth 2025-2030 (%)

12.4 Europe - Market size and forecast 2025-2030

Chart on Europe - Market size and forecast 2025-2030 ($ million)
Data Table on Europe - Market size and forecast 2025-2030 ($ million)
Chart on Europe - Year-over-year growth 2025-2030 (%)
Data Table on Europe - Year-over-year growth 2025-2030 (%)
Chart on Regional Comparison - Europe
Data Table on Regional Comparison - Europe

12.4.1 Germany - Market size and forecast 2025-2030

Chart on Germany - Market size and forecast 2025-2030 ($ million)
Data Table on Germany - Market size and forecast 2025-2030 ($ million)
Chart on Germany - Year-over-year growth 2025-2030 (%)
Data Table on Germany - Year-over-year growth 2025-2030 (%)

12.4.2 UK - Market size and forecast 2025-2030

Chart on UK - Market size and forecast 2025-2030 ($ million)
Data Table on UK - Market size and forecast 2025-2030 ($ million)
Chart on UK - Year-over-year growth 2025-2030 (%)
Data Table on UK - Year-over-year growth 2025-2030 (%)

12.4.3 France - Market size and forecast 2025-2030

Chart on France - Market size and forecast 2025-2030 ($ million)
Data Table on France - Market size and forecast 2025-2030 ($ million)
Chart on France - Year-over-year growth 2025-2030 (%)
Data Table on France - Year-over-year growth 2025-2030 (%)

12.4.4 Italy - Market size and forecast 2025-2030

Chart on Italy - Market size and forecast 2025-2030 ($ million)
Data Table on Italy - Market size and forecast 2025-2030 ($ million)
Chart on Italy - Year-over-year growth 2025-2030 (%)
Data Table on Italy - Year-over-year growth 2025-2030 (%)

12.4.5 Spain - Market size and forecast 2025-2030

Chart on Spain - Market size and forecast 2025-2030 ($ million)
Data Table on Spain - Market size and forecast 2025-2030 ($ million)
Chart on Spain - Year-over-year growth 2025-2030 (%)
Data Table on Spain - Year-over-year growth 2025-2030 (%)

12.4.6 The Netherlands - Market size and forecast 2025-2030

Chart on The Netherlands - Market size and forecast 2025-2030 ($ million)
Data Table on The Netherlands - Market size and forecast 2025-2030 ($ million)
Chart on The Netherlands - Year-over-year growth 2025-2030 (%)
Data Table on The Netherlands - Year-over-year growth 2025-2030 (%)

12.5 APAC - Market size and forecast 2025-2030

Chart on APAC - Market size and forecast 2025-2030 ($ million)
Data Table on APAC - Market size and forecast 2025-2030 ($ million)
Chart on APAC - Year-over-year growth 2025-2030 (%)
Data Table on APAC - Year-over-year growth 2025-2030 (%)
Chart on Regional Comparison - APAC
Data Table on Regional Comparison - APAC

12.5.1 China - Market size and forecast 2025-2030

Chart on China - Market size and forecast 2025-2030 ($ million)
Data Table on China - Market size and forecast 2025-2030 ($ million)
Chart on China - Year-over-year growth 2025-2030 (%)
Data Table on China - Year-over-year growth 2025-2030 (%)

12.5.2 India - Market size and forecast 2025-2030

Chart on India - Market size and forecast 2025-2030 ($ million)
Data Table on India - Market size and forecast 2025-2030 ($ million)
Chart on India - Year-over-year growth 2025-2030 (%)
Data Table on India - Year-over-year growth 2025-2030 (%)

12.5.3 Japan - Market size and forecast 2025-2030

Chart on Japan - Market size and forecast 2025-2030 ($ million)
Data Table on Japan - Market size and forecast 2025-2030 ($ million)
Chart on Japan - Year-over-year growth 2025-2030 (%)
Data Table on Japan - Year-over-year growth 2025-2030 (%)

12.5.4 South Korea - Market size and forecast 2025-2030

Chart on South Korea - Market size and forecast 2025-2030 ($ million)
Data Table on South Korea - Market size and forecast 2025-2030 ($ million)
Chart on South Korea - Year-over-year growth 2025-2030 (%)
Data Table on South Korea - Year-over-year growth 2025-2030 (%)

12.5.5 Australia - Market size and forecast 2025-2030

Chart on Australia - Market size and forecast 2025-2030 ($ million)
Data Table on Australia - Market size and forecast 2025-2030 ($ million)
Chart on Australia - Year-over-year growth 2025-2030 (%)
Data Table on Australia - Year-over-year growth 2025-2030 (%)

12.5.6 Indonesia - Market size and forecast 2025-2030

Chart on Indonesia - Market size and forecast 2025-2030 ($ million)
Data Table on Indonesia - Market size and forecast 2025-2030 ($ million)
Chart on Indonesia - Year-over-year growth 2025-2030 (%)
Data Table on Indonesia - Year-over-year growth 2025-2030 (%)

12.6 South America - Market size and forecast 2025-2030

Chart on South America - Market size and forecast 2025-2030 ($ million)
Data Table on South America - Market size and forecast 2025-2030 ($ million)
Chart on South America - Year-over-year growth 2025-2030 (%)
Data Table on South America - Year-over-year growth 2025-2030 (%)
Chart on Regional Comparison - South America
Data Table on Regional Comparison - South America

12.6.1 Brazil - Market size and forecast 2025-2030

Chart on Brazil - Market size and forecast 2025-2030 ($ million)
Data Table on Brazil - Market size and forecast 2025-2030 ($ million)
Chart on Brazil - Year-over-year growth 2025-2030 (%)
Data Table on Brazil - Year-over-year growth 2025-2030 (%)

12.6.2 Argentina - Market size and forecast 2025-2030

Chart on Argentina - Market size and forecast 2025-2030 ($ million)
Data Table on Argentina - Market size and forecast 2025-2030 ($ million)
Chart on Argentina - Year-over-year growth 2025-2030 (%)
Data Table on Argentina - Year-over-year growth 2025-2030 (%)

12.6.3 Chile - Market size and forecast 2025-2030

Chart on Chile - Market size and forecast 2025-2030 ($ million)
Data Table on Chile - Market size and forecast 2025-2030 ($ million)
Chart on Chile - Year-over-year growth 2025-2030 (%)
Data Table on Chile - Year-over-year growth 2025-2030 (%)

12.7 Middle East and Africa - Market size and forecast 2025-2030

Chart on Middle East and Africa - Market size and forecast 2025-2030 ($ million)
Data Table on Middle East and Africa - Market size and forecast 2025-2030 ($ million)
Chart on Middle East and Africa - Year-over-year growth 2025-2030 (%)
Data Table on Middle East and Africa - Year-over-year growth 2025-2030 (%)
Chart on Regional Comparison - Middle East and Africa
Data Table on Regional Comparison - Middle East and Africa

12.7.1 Saudi Arabia - Market size and forecast 2025-2030

Chart on Saudi Arabia - Market size and forecast 2025-2030 ($ million)
Data Table on Saudi Arabia - Market size and forecast 2025-2030 ($ million)
Chart on Saudi Arabia - Year-over-year growth 2025-2030 (%)
Data Table on Saudi Arabia - Year-over-year growth 2025-2030 (%)

12.7.2 UAE - Market size and forecast 2025-2030

Chart on UAE - Market size and forecast 2025-2030 ($ million)
Data Table on UAE - Market size and forecast 2025-2030 ($ million)
Chart on UAE - Year-over-year growth 2025-2030 (%)
Data Table on UAE - Year-over-year growth 2025-2030 (%)

12.7.3 South Africa - Market size and forecast 2025-2030

Chart on South Africa - Market size and forecast 2025-2030 ($ million)
Data Table on South Africa - Market size and forecast 2025-2030 ($ million)
Chart on South Africa - Year-over-year growth 2025-2030 (%)
Data Table on South Africa - Year-over-year growth 2025-2030 (%)

12.7.4 Turkey - Market size and forecast 2025-2030

Chart on Turkey - Market size and forecast 2025-2030 ($ million)
Data Table on Turkey - Market size and forecast 2025-2030 ($ million)
Chart on Turkey - Year-over-year growth 2025-2030 (%)
Data Table on Turkey - Year-over-year growth 2025-2030 (%)

12.7.5 Egypt - Market size and forecast 2025-2030

Chart on Egypt - Market size and forecast 2025-2030 ($ million)
Data Table on Egypt - Market size and forecast 2025-2030 ($ million)
Chart on Egypt - Year-over-year growth 2025-2030 (%)
Data Table on Egypt - Year-over-year growth 2025-2030 (%)

12.8 Market opportunity by geography

Market opportunity by geography ($ million)
Data Tables on Market opportunity by geography ($ million)

13. Drivers, Challenges, and Opportunity

13.1 Market drivers

Increasing demand for natural and clean-label ingredients
Technological innovations in flavor stability and performance
Globalization of palates and search for authentic experiences

13.2 Market challenges

Regulatory fragmentation and stringent compliance standards
Supply chain instability and volatility of raw material costs
Technical limitations and financial burden of clean-label transition

13.3 Impact of drivers and challenges

Impact of drivers and challenges in 2025 and 2030

13.4 Market opportunities

Integration of AI and hyper-personalization
Sustainable sourcing and rise of upcycled flavoring agents
Emergence of functional and emotionally resonant flavor profiles

14. Competitive Landscape

14.1 Overview

14.2

Overview on criticality of inputs and factors of differentiation

14.3 Landscape disruption

Overview on factors of disruption

14.4 Industry risks

Impact of key risks on business

15. Competitive Analysis

15.1 Companies profiled

Companies covered

15.2 Company ranking index

15.3 Market positioning of companies

Matrix on companies position and classification

15.4 Archer Daniels Midland Co.

Archer Daniels Midland Co. - Overview
Archer Daniels Midland Co. - Business segments
Archer Daniels Midland Co. - Key news
Archer Daniels Midland Co. - Key offerings
Archer Daniels Midland Co. - Segment focus
SWOT

15.5 DSM Firmenich AG

DSM Firmenich AG - Overview
DSM Firmenich AG - Product / Service
DSM Firmenich AG - Key offerings
SWOT

15.6 Givaudan SA

Givaudan SA - Overview
Givaudan SA - Business segments
Givaudan SA - Key news
Givaudan SA - Key offerings
Givaudan SA - Segment focus
SWOT

15.7 Huabao International Holdings Ltd.

Huabao International Holdings Ltd. - Overview
Huabao International Holdings Ltd. - Business segments
Huabao International Holdings Ltd. - Key offerings
Huabao International Holdings Ltd. - Segment focus
SWOT

15.8 International Flavors Inc.

International Flavors Inc. - Overview
International Flavors Inc. - Business segments
International Flavors Inc. - Key news
International Flavors Inc. - Key offerings
International Flavors Inc. - Segment focus
SWOT

15.9 Kerry Group Plc

Kerry Group Plc - Overview
Kerry Group Plc - Business segments
Kerry Group Plc - Key offerings
Kerry Group Plc - Segment focus
SWOT

15.10 McCormick and Co. Inc.

McCormick and Co. Inc. - Overview
McCormick and Co. Inc. - Business segments
McCormick and Co. Inc. - Key news
McCormick and Co. Inc. - Key offerings
McCormick and Co. Inc. - Segment focus
SWOT

15.11 Robertet SA

Robertet SA - Overview
Robertet SA - Business segments
Robertet SA - Key offerings
Robertet SA - Segment focus
SWOT

15.12 Sensient Technologies Corp.

Sensient Technologies Corp. - Overview
Sensient Technologies Corp. - Business segments
Sensient Technologies Corp. - Key offerings
Sensient Technologies Corp. - Segment focus
SWOT

15.13 Symrise Group

Symrise Group - Overview
Symrise Group - Business segments
Symrise Group - Key news
Symrise Group - Key offerings
Symrise Group - Segment focus
SWOT

15.14 Synergy Flavors Inc.

Synergy Flavors Inc. - Overview
Synergy Flavors Inc. - Product / Service
Synergy Flavors Inc. - Key offerings
SWOT

15.15 T.Hasegawa USA Inc.

T.Hasegawa USA Inc. - Overview
T.Hasegawa USA Inc. - Product / Service
T.Hasegawa USA Inc. - Key offerings
SWOT

15.16 Takasago International Corp.

Takasago International Corp. - Overview
Takasago International Corp. - Business segments
Takasago International Corp. - Key news
Takasago International Corp. - Key offerings
Takasago International Corp. - Segment focus
SWOT

15.17 TREATT Plc

TREATT Plc - Overview
TREATT Plc - Product / Service
TREATT Plc - Key offerings
SWOT

15.18 V Mane Fils

V Mane Fils - Overview
V Mane Fils - Product / Service
V Mane Fils - Key offerings
SWOT

16. Appendix

16.1 Scope of the report

Market definition
Objectives
Notes and caveats

16.2 Inclusions and exclusions checklist

Inclusions checklist
Exclusions checklist

16.3 Currency conversion rates for US$

16.4 Research methodology

16.5 Data procurement

Information sources

16.6 Data validation

16.7 Validation techniques employed for market sizing

16.8 Data synthesis

16.9 360 degree market analysis

16.10 List of abbreviations

Research Methodology

Technavio presents a detailed picture of the market by way of study, synthesis, and summation of data from multiple sources. The analysts have presented the various facets of the market with a particular focus on identifying the key industry influencers. The data thus presented is comprehensive, reliable, and the result of extensive research, both primary and secondary.

INFORMATION SOURCES

Primary sources

  • Manufacturers and suppliers
  • Channel partners
  • Industry experts
  • Strategic decision makers

Secondary sources

  • Industry journals and periodicals
  • Government data
  • Financial reports of key industry players
  • Historical data
  • Press releases

DATA ANALYSIS

Data Synthesis

  • Collation of data
  • Estimation of key figures
  • Analysis of derived insights

Data Validation

  • Triangulation with data models
  • Reference against proprietary databases
  • Corroboration with industry experts

REPORT WRITING

Qualitative

  • Market drivers
  • Market challenges
  • Market trends
  • Five forces analysis

Quantitative

  • Market size and forecast
  • Market segmentation
  • Geographical insights
  • Competitive landscape

Interested in this report?

Get your sample now to see our research methodology and insights!

Download Now

Frequently Asked Questions

Food Flavors market growth will increase by USD 7244.5 million during 2026-2030.

The Food Flavors market is expected to grow at a CAGR of 6.7% during 2026-2030.

Food Flavors market is segmented by Product (Natural flavors, Artificial flavors) Application (Food, Beverages) End-user (Food processing, Foodservice, Household)

Apex Flavors Inc., Archer Daniels Midland Co., Bell Flavors and Fragrances Inc., DSM Firmenich AG, Flavorchem and Orchidia Fragrances, Givaudan SA, GOLD COAST INGREDIENTS INC., Huabao International Holdings Ltd., International Flavors Inc., Kalsec Inc., Kerry Group Plc, McCormick and Co. Inc., Ogawa and Co. Ltd., Robertet SA, Sensient Technologies Corp., Symrise Group, Synergy Flavors Inc., T.Hasegawa USA Inc., Takasago International Corp., TREATT Plc, V Mane Fils are a few of the key vendors in the Food Flavors market.

North America will register the highest growth rate of 29.2% among the other regions. Therefore, the Food Flavors market in North America is expected to garner significant business opportunities for the vendors during the forecast period.

US, Canada, Mexico, Germany, UK, France, Italy, Spain, The Netherlands, China, India, Japan, South Korea, Australia, Indonesia, Brazil, Argentina, Chile, Saudi Arabia, UAE, South Africa, Turkey, Egypt

  • Increasing demand for natural and clean-label ingredients is the driving factor this market.

The Food Flavors market vendors should focus on grabbing business opportunities from the Product segment as it accounted for the largest market share in the base year.
RIA - Research AI Assistant
Ask RIA