
Functional Food Ingredients Market Size 2026-2030
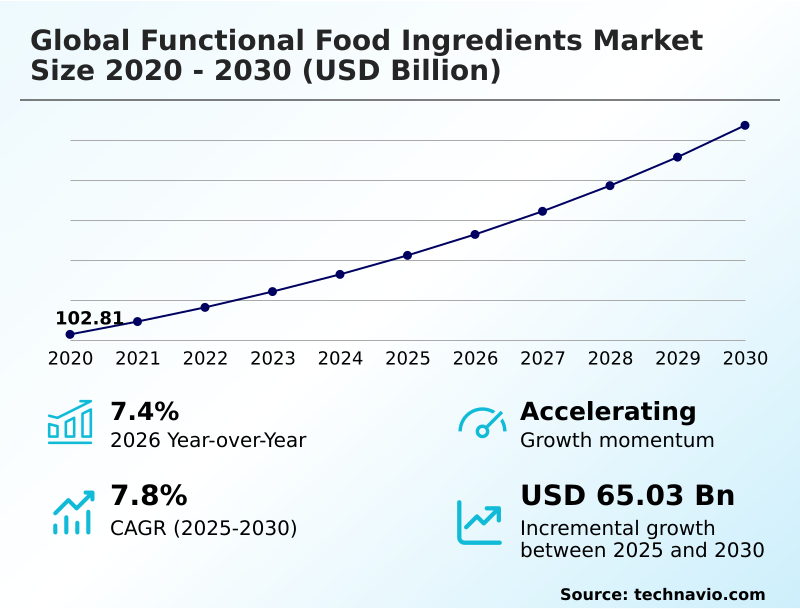
The Functional Food Ingredients Market size was valued at USD 142.31 billion in 2025, growing at a CAGR of 7.8% during the forecast period 2026-2030.
Major Market Trends & Insights
- APAC dominated the market and accounted for a 35.5% growth during the forecast period.
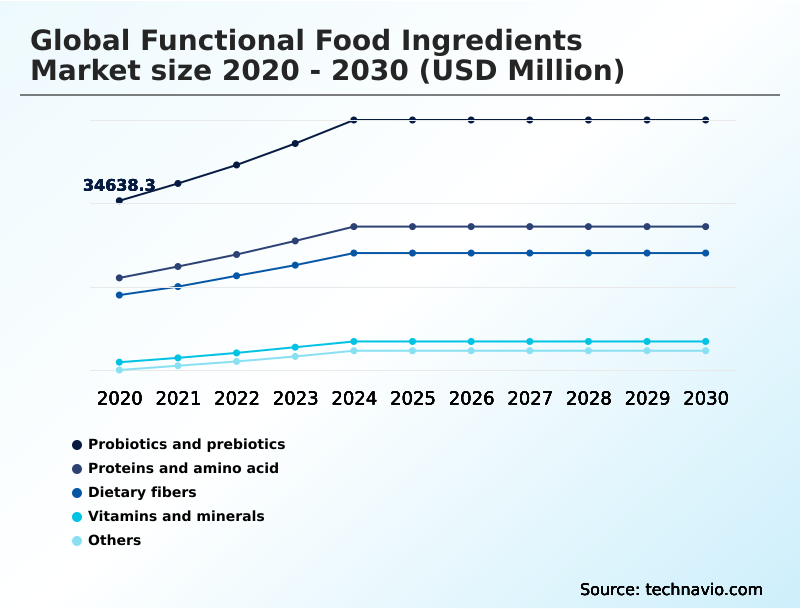
- By Product - Probiotics and prebiotics segment was valued at USD 45.96 billion in 2024
- By Application - Food and beverages segment accounted for the largest market revenue share in 2024
Market Size & Forecast
- Historic Market Opportunities 2020-2024: USD 104.52 billion
- Market Future Opportunities 2025-2030: USD 65.03 billion
- CAGR from 2025 to 2030 : 7.8%
Market Summary
- The functional food ingredients market is undergoing a structural transformation, with the probiotics and prebiotics segment alone accounting for over one-third of the market. This shift is driven by a consumer transition toward preventive healthcare, focusing on benefits such as improved gut microbiota and metabolic health.
- For manufacturers, this presents a significant operational scenario: incorporating delicate bioactive compounds into a complex food matrix requires advanced microencapsulation, a process that can increase formulation costs by nearly 30% compared to standard fortification. While the demand for personalized nutrition propels innovation, the industry faces the challenge of regulatory fragmentation.
- Navigating differing international standards for health claims complicates product commercialization and requires substantial investment in clinical validation, slowing time-to-market for novel nutraceuticals and clean-label ingredients.
What will be the Size of the Functional Food Ingredients Market during the forecast period?
Get Key Insights on Market Forecast (PDF) Request Free Sample
How is the Functional Food Ingredients Market Segmented?
The functional food ingredients industry research report provides comprehensive data (region-wise segment analysis), with forecasts and analysis for the period 2026-2030, as well as historical data from 2020-2024 for the following segments.
- Product
- Probiotics and prebiotics
- Proteins and amino acid
- Dietary fibers
- Vitamins and minerals
- Others
- Application
- Food and beverages
- Pharmaceuticals
- Others
- Source
- Natural
- Synthetic
- Geography
- APAC
- China
- Japan
- India
- North America
- US
- Canada
- Mexico
- Europe
- Germany
- UK
- France
- Middle East and Africa
- Saudi Arabia
- UAE
- South Africa
- South America
- Brazil
- Argentina
- Rest of World (ROW)
- APAC
How is the Functional Food Ingredients Market Segmented by Product?
The probiotics and prebiotics segment is estimated to witness significant growth during the forecast period.
The probiotics and prebiotics segment, which consistently captures over 34% of product-based revenue, is defined by the consumer shift toward preventive healthcare.
A key operational challenge is ensuring formulation stability, as advanced microencapsulation techniques are required to achieve over 90% viability of live cultures in diverse food matrix applications, a significant improvement over older methods.
This focus on bioavailability and metabolic health is driven by a deeper understanding of the gut microbiota and its role in immune resilience.
As a result, the demand for shelf-stable synbiotics and postbiotics in everyday foods is increasing, compelling manufacturers to invest in technologies that support the delivery of these sensitive bioactive compounds without compromising the final product's organoleptic properties or requiring specialized handling.
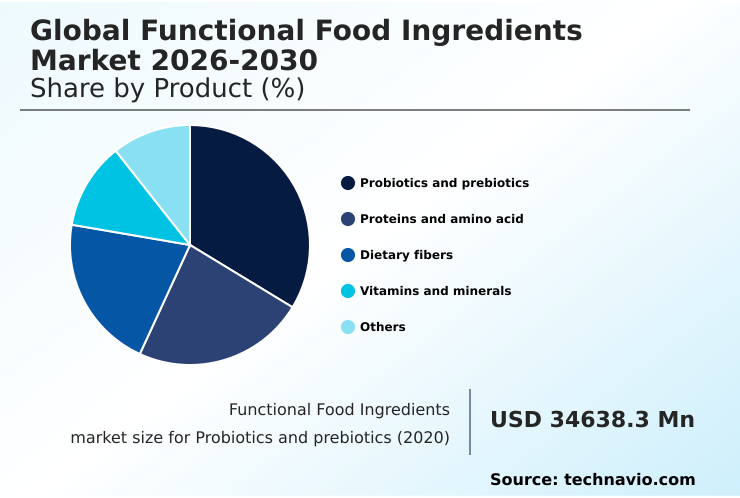
The Probiotics and prebiotics segment was valued at USD 45.96 billion in 2024 and showed a gradual increase during the forecast period.
How demand for the Functional Food Ingredients market is rising in the leading region?
APAC is estimated to contribute 35.5% to the growth of the global market during the forecast period.Technavio’s analysts have elaborately explained the regional trends and drivers that shape the market during the forecast period.

See How Functional Food Ingredients Market demand is rising in APAC Request Free Sample
The geographic landscape of the functional food ingredients market is led by APAC, which is set to contribute approximately 35.5% of the market's incremental growth, outpacing North America's 29.5%.
This dominance is driven by countries like China and Japan, where a deep-rooted culture of therapeutic nutrition and a rapidly aging population fuel demand for nootropics and adaptogens.
In contrast, the North American market is primarily driven by consumer demand for preventive healthcare solutions to manage lifestyle-related conditions, leading to higher adoption of plant-based proteins and dietary fibers in snacks and beverages.
This regional divergence impacts supply chain strategies; manufacturers in APAC often focus on integrating ingredients into traditional staples, a different formulation challenge than in Europe, where strict regulations necessitate extensive clinical data for any product claiming to support cellular nutrition or holistic wellness.
What are the key Drivers, Trends, and Challenges in the Functional Food Ingredients Market?
Our researchers analyzed the data with 2025 as the base year, along with the key drivers, trends, and challenges. A holistic analysis of drivers will help companies refine their marketing strategies to gain a competitive advantage.
- As consumers increasingly seek functional food for gut health, the industry is responding with sophisticated formulations that leverage the benefits of probiotics in food. This trend has intensified the debate around natural vs synthetic food ingredients, with a clear market shift toward clean-label and sustainable sourcing.
- Formulations using natural botanical extracts often see a 15-20% higher ingredient cost compared to their synthetic counterparts, a critical factor in final product pricing and supply chain planning. The demand for plant based protein ingredients continues to surge, driven by health and environmental concerns. These proteins are now integral to products targeting muscle synthesis and healthy aging.
- Simultaneously, the role of dietary fiber in food has expanded beyond digestion to include glycemic control and prebiotic functions, supporting the overall gut microbiota. The efficacy of these ingredients is paramount, as demonstrated by synbiotic blends that can improve nutrient absorption by over 25% compared to standalone probiotics.
- This focus on validated outcomes is shaping the future of personalized nutrition and metabolic health solutions, where the synergy between different bioactive compounds is key to delivering tangible health benefits.

What are the key market drivers leading to the rise in the adoption of Functional Food Ingredients Industry?
- A fundamental market driver is the shift toward clean-label sustainability, which increases demand for fermentation-derived bioactive ingredients.
- A key market driver is the consumer shift toward preventive healthcare, which has industrialized the use of microbiome-focused functional formulations, leading to a 40% increase in synbiotic product development.
- This demand is fueled by a greater understanding of the gut-brain axis and its role in immune resilience and mental well-being.
- Consequently, businesses must invest in advanced encapsulation technologies to ensure high probiotic survival rates, with leading methods achieving over 90% viability in acidic food matrices. This technical requirement increases production costs but is essential for delivering effective, shelf-stable products.
- The rise of psychobiotic ingredients to support mental wellness alongside physical health further drives innovation in creating multi-functional foods that meet the global demand for health-optimized, convenient nutrition.
What are the market trends shaping the Functional Food Ingredients Industry?
- The expansion of botanical adaptogens is a key market trend. It is increasingly coupled with AI-driven nutrient enhancement to personalize functional food formulations.
- A primary market trend is the proliferation of bioactive protein blends and enzyme-treated bioactive peptides designed for healthy aging, a priority for nearly 75% of global consumers. This has caused a strategic pivot away from generic protein supplementation toward highly functional amino acids and plant-based proteins that offer superior bioavailability and support muscle protein synthesis.
- For businesses, this translates into a wave of product reformulations to combat sarcopenia, incorporating ingredients like collagen peptides. The use of hybrid protein sources, combining whey with sustainable legumes, improves absorption rates by up to 25% compared to single-source plant proteins.
- This innovation allows for the creation of nutrient-dense snacks and beverages that act as tools for managing age-related physical decline, aligning with the broader push for longevity-focused cellular nutrition and holistic wellness.
What challenges does the Functional Food Ingredients Industry face during its growth?
- A key challenge affecting industry growth is the high cost associated with sensory masking techniques and advanced microencapsulation for potent functional ingredients.
- A significant challenge is the inherent sensory limitations of potent functional food ingredients, which can reduce repeat purchase intent by over 50% due to off-flavors. While consumers prioritize health, taste remains the primary driver of purchasing behavior, creating a conflict when using bitter bioactive peptides or botanical extracts.
- This forces businesses to invest heavily in sensory masking and microencapsulation technologies, which can account for nearly 30% of the R&D budget for new product lines. The high cost of these solutions creates a financial barrier, particularly for manufacturers in price-sensitive markets.
- This challenge of balancing premium functionality with a palatable sensory experience often leads to margin compression, limiting the widespread adoption of highly fortified foods to the premium wellness niche.
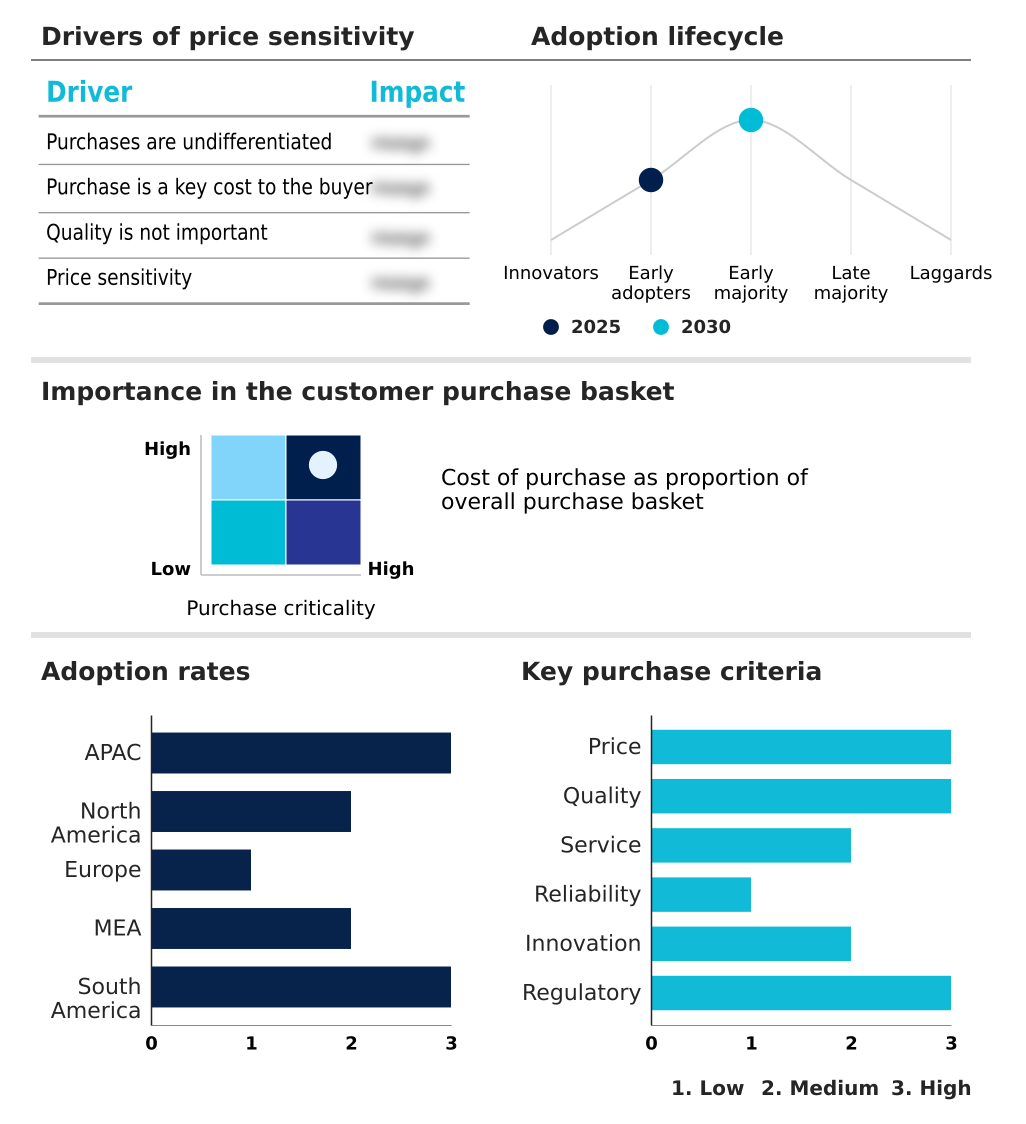
Exclusive Technavio Analysis on Customer Landscape
The functional food ingredients market forecasting report includes the adoption lifecycle of the market, covering from the innovator’s stage to the laggard’s stage. It focuses on adoption rates in different regions based on penetration. Furthermore, the functional food ingredients market report also includes key purchase criteria and drivers of price sensitivity to help companies evaluate and develop their market growth analysis strategies.
Customer Landscape of Functional Food Ingredients Industry
Competitive Landscape
Companies are implementing various strategies, such as strategic alliances, functional food ingredients market forecast, partnerships, mergers and acquisitions, geographical expansion, and product/service launches, to enhance their presence in the industry.
Ajinomoto Co. Inc. - Specialized amino acids and seasoning ingredients are engineered to enhance both nutritional value and sensory profiles in food applications.
The industry research and growth report includes detailed analyses of the competitive landscape of the market and information about key companies, including:
- Ajinomoto Co. Inc.
- American Proteins Inc.
- Archer Daniels Midland Co.
- Arla Foods amba
- Associated British Foods Plc
- BASF SE
- Bio Botanica Inc.
- Cargill Inc.
- DSM Firmenich AG
- Givaudan SA
- Ingredion Inc.
- International Flavors Inc.
- Kemin Industries Inc.
- Kerry Group Plc
- Novonesis Group
- Omega Protein Corp.
- Royal Cosun
- Sudzucker AG
- Symrise Group
- Tate and Lyle Plc
Qualitative and quantitative analysis of companies has been conducted to help clients understand the wider business environment as well as the strengths and weaknesses of key industry players. Data is qualitatively analyzed to categorize companies as pure play, category-focused, industry-focused, and diversified; it is quantitatively analyzed to categorize companies as dominant, leading, strong, tentative, and weak.
Market Intelligence Radar: High-Impact Developments & Growth Signals
- In the packaged foods and meats industry, increasingly stringent food safety regulations, such as the Food Safety Modernization Act (FSMA) in the US, are compelling manufacturers to demand functional food ingredients with verifiable supply chain transparency and GRAS status, impacting sourcing and compliance costs.
- A consumer shift toward minimally processed and clean-label products is driving demand for natural functional food ingredients, such as botanical extracts and antioxidants, to replace synthetic additives, directly influencing formulation strategies and R&D priorities.
- The rapid expansion of e-commerce and online grocery channels, which has seen growth rates exceed 20% in some categories, creates new avenues for packaged foods with specialized functional food ingredients, as digital platforms allow for more effective communication of health benefits like immune resilience.
- The rise of private-label brands, which now account for over 18% of retail value in markets like the US, is creating demand for cost-effective yet high-performing functional food ingredients, pressuring suppliers to offer competitive pricing on items like dietary fibers and plant-based proteins.
Dive into Technavio’s robust research methodology, blending expert interviews, extensive data synthesis, and validated models for unparalleled Functional Food Ingredients Market insights. See full methodology.
| Market Scope | |
|---|---|
| Page number | 307 |
| Base year | 2025 |
| Historic period | 2020-2024 |
| Forecast period | 2026-2030 |
| Growth momentum & CAGR | Accelerate at a CAGR of 7.8% |
| Market growth 2026-2030 | USD 65026.2 million |
| Market structure | Fragmented |
| YoY growth 2025-2026(%) | 7.4% |
| Key countries | China, Japan, India, South Korea, Indonesia, Australia, US, Canada, Mexico, Germany, UK, France, Italy, Spain, The Netherlands, Saudi Arabia, UAE, South Africa, Turkey, Israel, Brazil, Argentina and Chile |
| Competitive landscape | Leading Companies, Market Positioning of Companies, Competitive Strategies, and Industry Risks |
Research Analyst Overview
- The market ecosystem for functional food ingredients is a complex value chain where over 60% of raw materials are plant-derived, involving stakeholders from agriculture to retail. Ingredient manufacturers apply advanced technologies like precision fermentation to convert these inputs into high-purity bioactive compounds, such as probiotics and collagen peptides.
- The process is heavily influenced by regulatory bodies like the EFSA and FDA, which mandate rigorous testing for safety and health claims, making GRAS status a critical asset. Food and beverage companies, the primary customers, face moderate buyer power due to high price sensitivity but are driven by consumer demand for preventive healthcare.
- This demand has made sensory masking technologies crucial, now accounting for up to 30% of R&D budgets for new product lines to ensure consumer acceptance of fortified products.
What are the Key Data Covered in this Functional Food Ingredients Market Research and Growth Report?
-
What is the expected growth of the Functional Food Ingredients Market between 2026 and 2030?
-
The Functional Food Ingredients Market is expected to grow by USD 65.03 billion during 2026-2030, registering a CAGR of 7.8%. Year-over-year growth in 2026 is estimated at 7.4%%. This acceleration is shaped by shift toward clean-label sustainability and fermentation-derived bioactives, which is intensifying demand across multiple end-use verticals covered in the report.
-
-
What segmentation does the market report cover?
-
The report is segmented by Product (Probiotics and prebiotics, Proteins and amino acid, Dietary fibers, Vitamins and minerals, and Others), Application (Food and beverages, Pharmaceuticals, and Others), Source (Natural, and Synthetic) and Geography (APAC, North America, Europe, Middle East and Africa, South America). Among these, the Probiotics and prebiotics segment is estimated to witness significant growth during the forecast period, driven by rising adoption across key application areas. Each segment includes detailed qualitative and quantitative analysis, along with historical data from 2020-2024 and forecasts through 2030 with year-over-year growth rates.
-
-
Which regions are analyzed in the report?
-
The report covers APAC, North America, Europe, Middle East and Africa and South America. APAC is estimated to contribute 35.5% to market growth during the forecast period. Country-level analysis includes China, Japan, India, South Korea, Indonesia, Australia, US, Canada, Mexico, Germany, UK, France, Italy, Spain, The Netherlands, Saudi Arabia, UAE, South Africa, Turkey, Israel, Brazil, Argentina and Chile, with dedicated market size tables and year-over-year growth for each.
-
-
What are the key growth drivers and market challenges?
-
The primary driver is shift toward clean-label sustainability and fermentation-derived bioactives, which is accelerating investment and industry demand. The main challenge is high costs of sensory masking and advanced microencapsulation, creating operational barriers for key market participants. The report quantifies the impact of each driver and challenge across 2026 and 2030 with comparative analysis.
-
-
Who are the major players in the Functional Food Ingredients Market?
-
Key vendors include Ajinomoto Co. Inc., American Proteins Inc., Archer Daniels Midland Co., Arla Foods amba, Associated British Foods Plc, BASF SE, Bio Botanica Inc., Cargill Inc., DSM Firmenich AG, Givaudan SA, Ingredion Inc., International Flavors Inc., Kemin Industries Inc., Kerry Group Plc, Novonesis Group, Omega Protein Corp., Royal Cosun, Sudzucker AG, Symrise Group and Tate and Lyle Plc. The report provides qualitative and quantitative analysis categorizing companies as dominant, leading, strong, tentative, and weak based on their market positioning. Company profiles include business segment analysis, SWOT assessment, key offerings, and recent strategic developments.
-
Market Research Insights
- The competitive landscape is moderately fragmented, with the top five vendors commanding less than 40% of the total market, fostering intense rivalry based on innovation. Key players like Kerry and Cargill are focusing on high-value niches, such as supportive nutrition for GLP-1 users, with ingredients like the BC30 probiotic shown to improve digestive comfort in 69% of surveyed consumers.
- This reflects a broader industry pivot toward clinically validated bioactive peptides and synbiotic blends. This strategy directly addresses the demand for science-backed personalized nutrition. However, companies must navigate the persistent challenge of supply chain vulnerability for high-value botanical extracts, leading many to invest in precision fermentation to ensure a stable, high-purity supply of ingredients for food fortification and metabolic health applications.
We can help! Our analysts can customize this functional food ingredients market research report to meet your requirements.
 RIA -
RIA - 
