Food Sweetener Market Analysis, Size, and Forecast 2026-2030: North America (US, Canada, and Mexico), Europe (Germany, UK, and France), APAC (China, Japan, and India), South America (Brazil and Argentina), Middle East and Africa (Saudi Arabia, UAE, and South Africa), and Rest of World (ROW)

Food Sweetener Market Analysis, Size, and Forecast 2026-2030:
North America (US, Canada, and Mexico), Europe (Germany, UK, and France), APAC (China, Japan, and India), South America (Brazil and Argentina), Middle East and Africa (Saudi Arabia, UAE, and South Africa), and Rest of World (ROW)

Published: Jan 2026 293 Pages SKU: IRTNTR72065

Market Overview at a Glance

$1.97 B
Market Opportunity
4.4%
CAGR 2025 - 2030
41.2%
North America Growth
$6.17 B
High-intensity sweeteners segment 2024

Food Sweetener Market Size 2026-2030

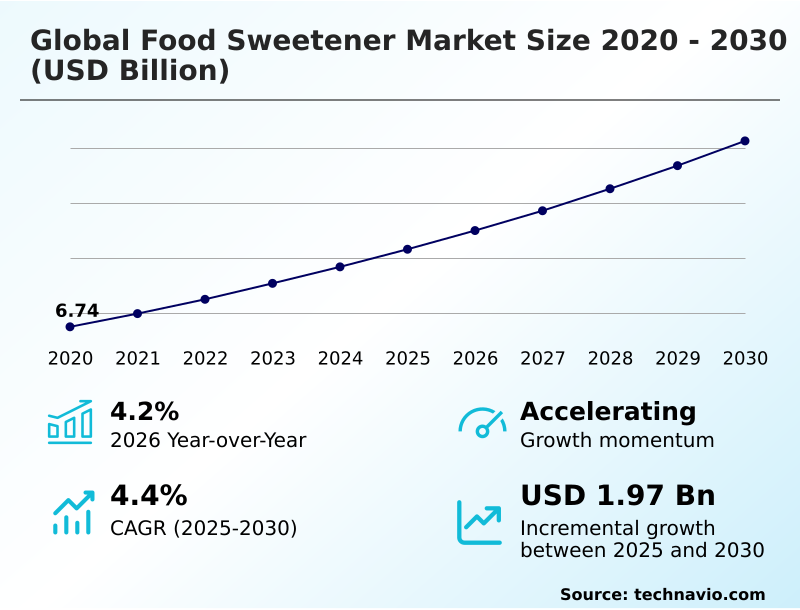
The food sweetener market size is valued to increase by USD 1.97 billion, at a CAGR of 4.4% from 2025 to 2030. Multiple applications of sugar substitutes will drive the food sweetener market.

Major Market Trends & Insights

  • North America dominated the market and accounted for a 41.2% growth during the forecast period.
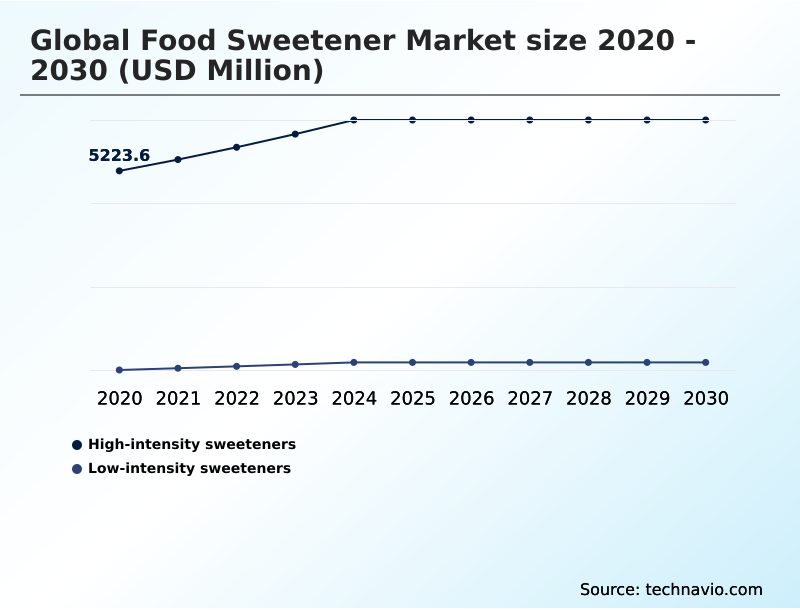
  • By Type - High-intensity sweeteners segment was valued at USD 6.17 billion in 2024
  • By Application - Bakery and confectionery segment accounted for the largest market revenue share in 2024

Market Size & Forecast

  • Market Opportunities: USD 3.38 billion
  • Market Future Opportunities: USD 1.97 billion
  • CAGR from 2025 to 2030 : 4.4%

Market Summary

  • The food sweetener market is undergoing a significant transformation, driven by a pronounced consumer shift toward health and wellness. This evolution is compelling manufacturers to innovate beyond traditional sucrose, embracing a diverse portfolio of sugar substitutes.
  • Key drivers include the widespread adoption of low-calorie and zero-calorie sweeteners in response to rising metabolic health concerns and regulatory pressures to reduce sugar content in processed foods. A prominent trend is the growing demand for natural and plant-based sweeteners, such as stevia and monk fruit, which align with clean-label preferences.
  • For instance, a beverage company might reformulate its flagship product line using a blend of bio-engineered sweeteners and natural extracts to achieve a 30% calorie reduction while maintaining the desired taste profile, thereby appealing to health-conscious consumers.
  • However, the market faces challenges related to the sensory attributes of some sugar alternatives, including lingering aftertastes, and the high costs associated with research and development for novel sweetening solutions. Navigating stringent food safety regulations and managing consumer perceptions of artificial sweeteners remain critical for sustained market success.
  • This dynamic environment necessitates continuous innovation in food science to balance taste, cost, and health benefits.

What will be the Size of the Food Sweetener Market during the forecast period?

Get Key Insights on Market Forecast (PDF) Request Free Sample

How is the Food Sweetener Market Segmented?

The food sweetener industry research report provides comprehensive data (region-wise segment analysis), with forecasts and estimates in "USD million" for the period 2026-2030, as well as historical data from 2020-2024 for the following segments.

  • Type
    • High-intensity sweeteners
    • Low-intensity sweeteners
  • Application
    • Bakery and confectionery
    • Beverages
    • Dairy and frozen desserts
    • Others
  • Source
    • Plant-based
    • Synthetic
    • Bio-engineered
  • Geography
    • North America
      • US
      • Canada
      • Mexico
    • Europe
      • Germany
      • UK
      • France
    • APAC
      • China
      • Japan
      • India
    • South America
      • Brazil
      • Argentina
    • Middle East and Africa
      • Saudi Arabia
      • UAE
      • South Africa
    • Rest of World (ROW)

By Type Insights

The high-intensity sweeteners segment is estimated to witness significant growth during the forecast period.

The global food sweetener market segmentation is shaped by the rising adoption of high-intensity sweeteners, driven by consumer demand for low-calorie solutions.

These potent sugar substitutes, including both natural sweeteners and artificial sweeteners, enable significant sugar reduction in food and beverage formulation, addressing health-conscious reformulation goals.

Food and beverage manufacturers leverage these sweetening solutions for their functional properties in finished products, with formulation blends enhancing mouthfeel and texture. Innovations in plant-derived extracts and advanced sweetening systems are critical for maintaining a competitive edge.

This segment is a primary contributor to market expansion, accounting for over 41% of incremental growth by enabling the development of products that meet clean-label requirements without compromising taste.

Request Free Sample

The High-intensity sweeteners segment was valued at USD 6.17 billion in 2024 and showed a gradual increase during the forecast period.

Request Free Sample

Regional Analysis

North America is estimated to contribute 41.2% to the growth of the global market during the forecast period.Technavio’s analysts have elaborately explained the regional trends and drivers that shape the market during the forecast period.

See How Food Sweetener Market Demand is Rising in North America Request Free Sample

The geographic landscape of the food sweetener market is defined by varied regional dynamics and consumer preferences. North America leads in market share, commanding over 35% of the market, driven by strong consumer demand for low-calorie and natural alternatives.

In this region, advanced food technology infrastructure supports the rapid adoption of novel ingredients like sweet proteins and rare sugars. Europe follows, with a mature market focused on clean-label compliance and regulatory-driven sugar reduction.

APAC is the fastest-growing region, with increasing health awareness and rising disposable incomes fueling demand for healthier food options.

Latin America and the Middle East and Africa represent emerging markets with significant growth potential, although adoption is tempered by pricing sensitivities and supply chain complexities.

Across these regions, the successful application of nutritive sweeteners and saccharin alternatives is critical for market penetration and expansion.

Market Dynamics

Our researchers analyzed the data with 2025 as the base year, along with the key drivers, trends, and challenges. A holistic analysis of drivers will help companies refine their marketing strategies to gain a competitive advantage.

  • Strategic decision-making in the food sweetener market requires a deep understanding of complex formulation variables and consumer trends. The high-intensity vs low-intensity sweeteners debate continues to shape product development, with choices impacting both cost and label appeal. Applications of plant-based sweeteners are expanding beyond beverages into bakery and confectionery, demanding new approaches to taste modulation.
  • The use of synthetic sweeteners in beverage formulation remains widespread due to cost-effectiveness, but it faces scrutiny over clean-label perceptions. Simultaneously, manufacturers face significant challenges in bio-engineered sweetener production, particularly in achieving scale and cost parity. A key focus area is steviol glycoside taste profile improvement to mitigate bitter off-notes.
  • The role of polyols in confectionery is well-established for texture and bulk, but formulators are exploring novel blends. Furthermore, clean label sweetener sourcing strategies are becoming integral to brand identity and consumer trust. Formulating with rare sugars like allulose offers benefits but requires navigating regulatory hurdles and supply chain constraints.
  • The exploration of sweet protein stability in food processing is a frontier of innovation, promising high-intensity sweetness with a clean taste. Finally, a thorough grasp of the non-nutritive sweetener regulatory landscape is essential for global market access.
  • Companies that effectively integrate these considerations into their operational planning often achieve a 15% faster product launch cycle compared to competitors with siloed R&D and regulatory teams.

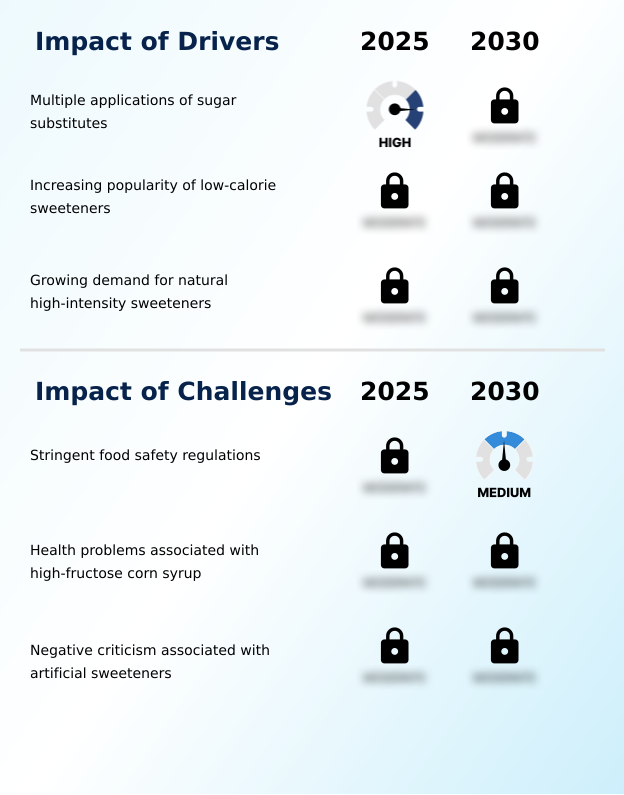
What are the key market drivers leading to the rise in the adoption of Food Sweetener Industry?

  • The increasing use of sugar substitutes across multiple applications is a key driver for the market.

  • The market's growth is primarily driven by the rising global focus on health and wellness, which is accelerating the adoption of low-calorie sweeteners and alternative sweetening agents.
  • The increasing prevalence of lifestyle-related health conditions has prompted food and beverage companies to actively pursue sugar-reduction strategies, incorporating everything from bulk sweeteners to high-fructose corn syrup alternatives.
  • Innovations that enhance the sweet taste perception while minimizing off-notes have improved product acceptance, with reformulated products achieving up to a 20% higher repeat purchase rate.
  • Furthermore, the versatility of sweeteners in diverse applications, from beverages to baked goods, expands market opportunities.
  • Regulatory support for sugar reduction initiatives also acts as a significant catalyst, encouraging manufacturers to innovate with ingredients like sugar beet molasses and other plant-derived options, thereby driving sustained market expansion.

What are the market trends shaping the Food Sweetener Industry?

  • The growing demand for organic food sweeteners is an emerging trend, driven by a heightened consumer focus on health, wellness, and clean-label products.

  • Key trends in the food sweetener market are driven by consumer demand for healthier options and technological advancements in ingredient science. The focus on sugar-like taste and clean-label compliance is pushing innovation in high-intensity natural sweeteners and novel sweetening ingredients.
  • For example, advancements in fermentation technology have led to the development of sweeteners with improved sensory attributes, showing a 30% reduction in undesirable aftertaste compared to earlier versions. Furthermore, the trend toward non-GMO and organic sweetening solutions is gaining momentum, with brands that adopt these standards reporting an average 15% increase in consumer loyalty.
  • The development of functional sweeteners that offer added health benefits, such as prebiotic effects, is another significant trend shaping the competitive landscape. This shift compels manufacturers to invest in R&D to create products that deliver both sweetness and wellness advantages.

What challenges does the Food Sweetener Industry face during its growth?

  • Stringent food safety regulations present a key challenge that impacts the growth of the industry.

  • The food sweetener market faces significant challenges related to regulatory complexities and consumer perceptions. Navigating the intricate web of global food safety regulations for ingredients like acesulfame-k and various polyols demands substantial investment in compliance and testing, with regulatory approval processes sometimes extending product development timelines by up to 18 months.
  • Another major hurdle is overcoming the negative consumer sentiment associated with certain artificial and synthetic sweeteners. Formulators must also address technical difficulties such as ensuring solubility in beverage systems and achieving the desired texture in food products.
  • These challenges are compounded by supply chain vulnerabilities for natural ingredients, which can lead to price volatility and impact production costs, thereby constraining market growth despite strong underlying demand for sugar alternatives.

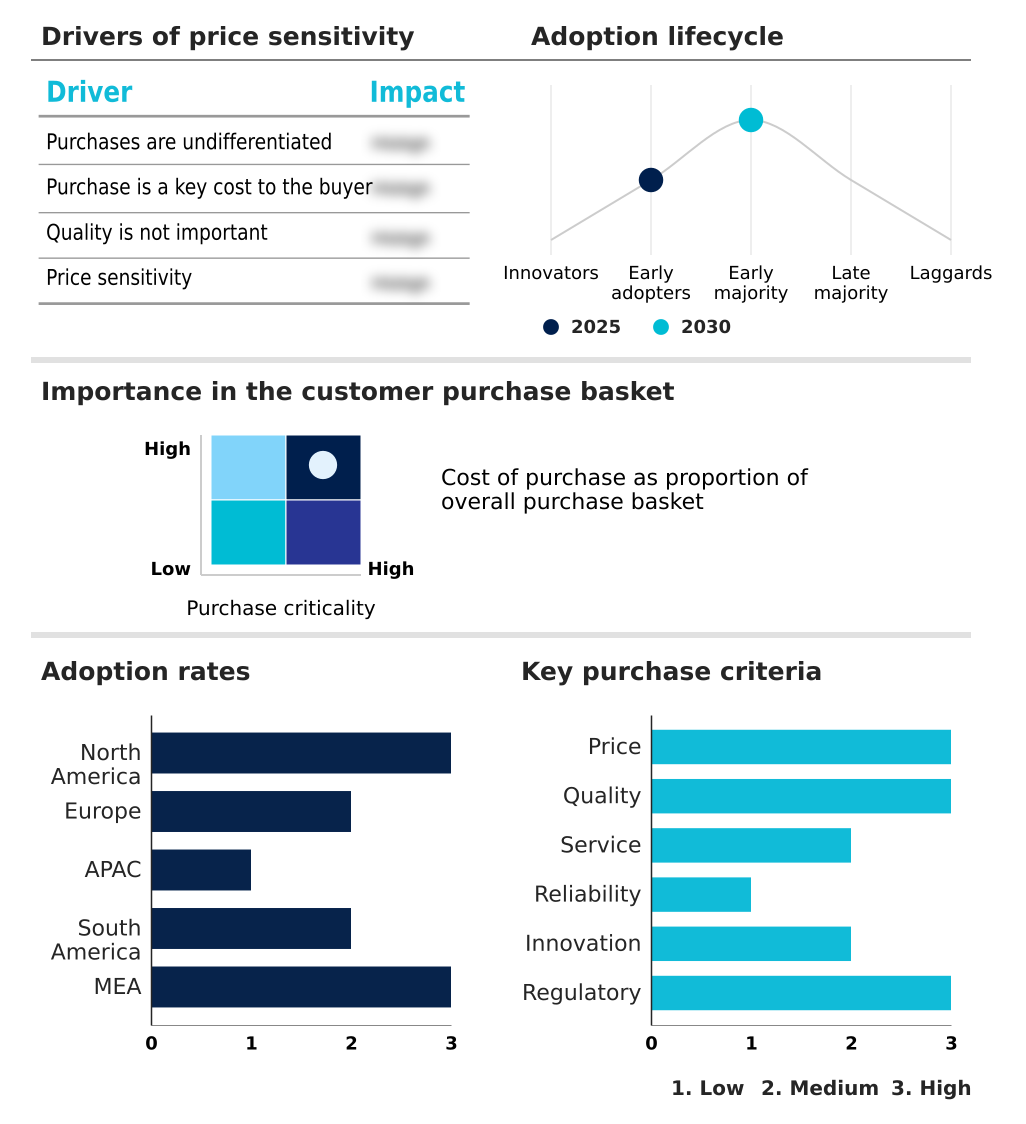
Exclusive Technavio Analysis on Customer Landscape

The food sweetener market forecasting report includes the adoption lifecycle of the market, covering from the innovator’s stage to the laggard’s stage. It focuses on adoption rates in different regions based on penetration. Furthermore, the food sweetener market report also includes key purchase criteria and drivers of price sensitivity to help companies evaluate and develop their market growth analysis strategies.

Customer Landscape of Food Sweetener Industry

Competitive Landscape

Companies are implementing various strategies, such as strategic alliances, food sweetener market forecast, partnerships, mergers and acquisitions, geographical expansion, and product/service launches, to enhance their presence in the industry.

Ajinomoto Co. Inc. - The company provides a portfolio of sweetener solutions, including nutritive and non-nutritive options, catering to diverse industrial food and beverage formulation requirements.

The industry research and growth report includes detailed analyses of the competitive landscape of the market and information about key companies, including:

  • Ajinomoto Co. Inc.
  • Archer Daniels Midland Co.
  • Cargill Inc.
  • Celanese Corp.
  • Dohler GmbH
  • DuPont de Nemours Inc.
  • Foodchem International Corp.
  • GLG Life Tech Corp.
  • Ingredion Inc.
  • International Flavors Inc.
  • Kerry Group Plc
  • Roquette Freres SA
  • Tate and Lyle Plc
  • Tereos Participations
  • Wilmar International Ltd.

Qualitative and quantitative analysis of companies has been conducted to help clients understand the wider business environment as well as the strengths and weaknesses of key industry players. Data is qualitatively analyzed to categorize companies as pure play, category-focused, industry-focused, and diversified; it is quantitatively analyzed to categorize companies as dominant, leading, strong, tentative, and weak.

Recent Development and News in Food sweetener market

  • In September 2025, Cargill's precision-fermented stevia sweetener, EverSweet, was named a finalist in the Global Good Awards for Game Changing Innovation of the Year, highlighting the market's focus on sustainable and healthier sweetening solutions.
  • In July 2025, the U.S. Food and Drug Administration (FDA) finalized regulatory updates to revoke outdated standards for certain artificially sweetened canned fruit and vegetable products, signaling evolving oversight in the sweetener industry.
  • In June 2025, Layn Natural Ingredients launched its plant-based sweetener SteviUp M2, a high-purity steviol glycoside designed to offer improved solubility and a sugar-like taste for various food and beverage applications.
  • In February 2025, Oobli announced a strategic partnership with Ingredion, following an $18 million funding round, to accelerate the commercialization of its sweet protein-based systems for sugar reduction.

Dive into Technavio’s robust research methodology, blending expert interviews, extensive data synthesis, and validated models for unparalleled Food Sweetener Market insights. See full methodology.

Market Scope
Page number 293
Base year 2025
Historic period 2020-2024
Forecast period 2026-2030
Growth momentum & CAGR Accelerate at a CAGR of 4.4%
Market growth 2026-2030 USD 1969.0 million
Market structure Fragmented
YoY growth 2025-2026(%) 4.2%
Key countries US, Canada, Mexico, Germany, UK, France, Italy, Spain, The Netherlands, China, Japan, India, South Korea, Australia, Indonesia, Brazil, Argentina, Chile, Saudi Arabia, UAE, South Africa, Israel and Turkey
Competitive landscape Leading Companies, Market Positioning of Companies, Competitive Strategies, and Industry Risks

Request Free Sample

Research Analyst Overview

  • The food sweetener market is advancing through intense innovation focused on health, functionality, and sustainability. The sector is moving beyond simple sucrose replacement to embrace sophisticated high-fructose corn syrup alternatives and next-generation sugar alcohol variants. A key industry dynamic is the development of bioconversion-derived sweeteners and fermentation-based formulations, which offer improved taste profiles and cleaner labels.
  • The application of high-potency sweeteners, including advanced stevia leaf extracts and monk fruit concentrate, is expanding across categories. Innovations such as sweet molecule engineering and precision fermentation sweeteners are enabling the creation of novel sweetening compounds with specific functional benefits. For example, the use of brazzein sweet protein is gaining traction for its clean, sugar-like taste.
  • Manufacturers are also focused on flavor modification technologies and bitterness blocking agents to overcome sensory challenges. This technical progress is critical, as companies using synergistic sweetener blends have demonstrated a 20% improvement in formulation cost-efficiency.
  • The market's evolution is defined by the interplay between consumer demand for naturalness, regulatory pressures for sugar reduction, and the scientific pursuit of the perfect sugar substitute.

What are the Key Data Covered in this Food Sweetener Market Research and Growth Report?

  • What is the expected growth of the Food Sweetener Market between 2026 and 2030?

    • USD 1.97 billion, at a CAGR of 4.4%

  • What segmentation does the market report cover?

    • The report is segmented by Type (High-intensity sweeteners, and Low-intensity sweeteners), Application (Bakery and confectionery, Beverages, Dairy and frozen desserts, and Others), Source (Plant-based, Synthetic, and Bio-engineered) and Geography (North America, Europe, APAC, South America, Middle East and Africa)

  • Which regions are analyzed in the report?

    • North America, Europe, APAC, South America and Middle East and Africa

  • What are the key growth drivers and market challenges?

    • Multiple applications of sugar substitutes, Stringent food safety regulations

  • Who are the major players in the Food Sweetener Market?

    • Ajinomoto Co. Inc., Archer Daniels Midland Co., Cargill Inc., Celanese Corp., Dohler GmbH, DuPont de Nemours Inc., Foodchem International Corp., GLG Life Tech Corp., Ingredion Inc., International Flavors Inc., Kerry Group Plc, Roquette Freres SA, Tate and Lyle Plc, Tereos Participations and Wilmar International Ltd.

Market Research Insights

  • The food sweetener market is characterized by dynamic shifts as manufacturers align with consumer health priorities. The demand for reduced sugar content is reshaping food formulation science, with a focus on taste profile optimization and sensory experience enhancement. For instance, companies leveraging advanced aftertaste masking technology report a 25% increase in consumer preference scores for reformulated beverages.
  • Concurrently, ingredient sourcing transparency has become a competitive differentiator, with clean label requirements driving a 15% uptick in the adoption of plant-derived alternatives. Achieving optimal mouthfeel and stability remains a core challenge, but innovations in solubility improvement methods are enabling broader applications.
  • These factors underscore a market where technical proficiency in calorie reduction formulation and sugar reduction strategies is essential for growth and consumer acceptance.

We can help! Our analysts can customize this food sweetener market research report to meet your requirements.

Get in touch

1. Executive Summary

1.1 Market overview

Executive Summary - Chart on Market Overview
Executive Summary - Data Table on Market Overview
Executive Summary - Chart on Global Market Characteristics
Executive Summary - Chart on Market by Geography
Executive Summary - Chart on Market Segmentation by Type
Executive Summary - Chart on Market Segmentation by Application
Executive Summary - Chart on Market Segmentation by Source
Executive Summary - Chart on Incremental Growth
Executive Summary - Data Table on Incremental Growth
Executive Summary - Chart on Company Market Positioning

2. Technavio Analysis

2.1 Analysis of price sensitivity, lifecycle, customer purchase basket, adoption rates, and purchase criteria

2.2 Criticality of inputs and Factors of differentiation

Chart on Overview on criticality of inputs and factors of differentiation

2.3 Factors of disruption

Chart on Overview on factors of disruption

2.4 Impact of drivers and challenges

Chart on Impact of drivers and challenges in 2025 and 2030

3. Market Landscape

3.1 Market ecosystem

Chart on Parent Market
Data Table on - Parent Market

3.2 Market characteristics

Chart on Market characteristics analysis

3.3 Value chain analysis

Chart on Value chain analysis

4. Market Sizing

4.1 Market definition

Data Table on Offerings of companies included in the market definition

4.2 Market segment analysis

Market segments

4.3 Market size 2025

4.4 Market outlook: Forecast for 2025-2030

Chart on Global - Market size and forecast 2025-2030 ($ million)
Data Table on Global - Market size and forecast 2025-2030 ($ million)
Chart on Global Market: Year-over-year growth 2025-2030 (%)
Data Table on Global Market: Year-over-year growth 2025-2030 (%)

5. Historic Market Size

5.1 Global Food Sweetener Market 2020 - 2024

Historic Market Size - Data Table on Global Food Sweetener Market 2020 - 2024 ($ million)

5.2 Type segment analysis 2020 - 2024

Historic Market Size - Type Segment 2020 - 2024 ($ million)

5.3 Application segment analysis 2020 - 2024

Historic Market Size - Application Segment 2020 - 2024 ($ million)

5.4 Source segment analysis 2020 - 2024

Historic Market Size - Source Segment 2020 - 2024 ($ million)

5.5 Geography segment analysis 2020 - 2024

Historic Market Size - Geography Segment 2020 - 2024 ($ million)

5.6 Country segment analysis 2020 - 2024

Historic Market Size - Country Segment 2020 - 2024 ($ million)

6. Qualitative Analysis

6.1 AI Impact on Global Food Sweetener Market

7. Five Forces Analysis

7.1 Five forces summary

Five forces analysis - Comparison between 2025 and 2030

7.2 Bargaining power of buyers

Bargaining power of buyers - Impact of key factors 2025 and 2030

7.3 Bargaining power of suppliers

Bargaining power of suppliers - Impact of key factors in 2025 and 2030

7.4 Threat of new entrants

Threat of new entrants - Impact of key factors in 2025 and 2030

7.5 Threat of substitutes

Threat of substitutes - Impact of key factors in 2025 and 2030

7.6 Threat of rivalry

Threat of rivalry - Impact of key factors in 2025 and 2030

7.7 Market condition

Chart on Market condition - Five forces 2025 and 2030

8. Market Segmentation by Type

8.1 Market segments

Chart on Type - Market share 2025-2030 (%)
Data Table on Type - Market share 2025-2030 (%)

8.2 Comparison by Type

Chart on Comparison by Type
Data Table on Comparison by Type

8.3 High-intensity sweeteners - Market size and forecast 2025-2030

Chart on High-intensity sweeteners - Market size and forecast 2025-2030 ($ million)
Data Table on High-intensity sweeteners - Market size and forecast 2025-2030 ($ million)
Chart on High-intensity sweeteners - Year-over-year growth 2025-2030 (%)
Data Table on High-intensity sweeteners - Year-over-year growth 2025-2030 (%)

8.4 Low-intensity sweeteners - Market size and forecast 2025-2030

Chart on Low-intensity sweeteners - Market size and forecast 2025-2030 ($ million)
Data Table on Low-intensity sweeteners - Market size and forecast 2025-2030 ($ million)
Chart on Low-intensity sweeteners - Year-over-year growth 2025-2030 (%)
Data Table on Low-intensity sweeteners - Year-over-year growth 2025-2030 (%)

8.5 Market opportunity by Type

Market opportunity by Type ($ million)
Data Table on Market opportunity by Type ($ million)

9. Market Segmentation by Application

9.1 Market segments

Chart on Application - Market share 2025-2030 (%)
Data Table on Application - Market share 2025-2030 (%)

9.2 Comparison by Application

Chart on Comparison by Application
Data Table on Comparison by Application

9.3 Bakery and confectionery - Market size and forecast 2025-2030

Chart on Bakery and confectionery - Market size and forecast 2025-2030 ($ million)
Data Table on Bakery and confectionery - Market size and forecast 2025-2030 ($ million)
Chart on Bakery and confectionery - Year-over-year growth 2025-2030 (%)
Data Table on Bakery and confectionery - Year-over-year growth 2025-2030 (%)

9.4 Beverages - Market size and forecast 2025-2030

Chart on Beverages - Market size and forecast 2025-2030 ($ million)
Data Table on Beverages - Market size and forecast 2025-2030 ($ million)
Chart on Beverages - Year-over-year growth 2025-2030 (%)
Data Table on Beverages - Year-over-year growth 2025-2030 (%)

9.5 Dairy and frozen desserts - Market size and forecast 2025-2030

Chart on Dairy and frozen desserts - Market size and forecast 2025-2030 ($ million)
Data Table on Dairy and frozen desserts - Market size and forecast 2025-2030 ($ million)
Chart on Dairy and frozen desserts - Year-over-year growth 2025-2030 (%)
Data Table on Dairy and frozen desserts - Year-over-year growth 2025-2030 (%)

9.6 Others - Market size and forecast 2025-2030

Chart on Others - Market size and forecast 2025-2030 ($ million)
Data Table on Others - Market size and forecast 2025-2030 ($ million)
Chart on Others - Year-over-year growth 2025-2030 (%)
Data Table on Others - Year-over-year growth 2025-2030 (%)

9.7 Market opportunity by Application

Market opportunity by Application ($ million)
Data Table on Market opportunity by Application ($ million)

10. Market Segmentation by Source

10.1 Market segments

Chart on Source - Market share 2025-2030 (%)
Data Table on Source - Market share 2025-2030 (%)

10.2 Comparison by Source

Chart on Comparison by Source
Data Table on Comparison by Source

10.3 Plant-based - Market size and forecast 2025-2030

Chart on Plant-based - Market size and forecast 2025-2030 ($ million)
Data Table on Plant-based - Market size and forecast 2025-2030 ($ million)
Chart on Plant-based - Year-over-year growth 2025-2030 (%)
Data Table on Plant-based - Year-over-year growth 2025-2030 (%)

10.4 Synthetic - Market size and forecast 2025-2030

Chart on Synthetic - Market size and forecast 2025-2030 ($ million)
Data Table on Synthetic - Market size and forecast 2025-2030 ($ million)
Chart on Synthetic - Year-over-year growth 2025-2030 (%)
Data Table on Synthetic - Year-over-year growth 2025-2030 (%)

10.5 Bio-engineered - Market size and forecast 2025-2030

Chart on Bio-engineered - Market size and forecast 2025-2030 ($ million)
Data Table on Bio-engineered - Market size and forecast 2025-2030 ($ million)
Chart on Bio-engineered - Year-over-year growth 2025-2030 (%)
Data Table on Bio-engineered - Year-over-year growth 2025-2030 (%)

10.6 Market opportunity by Source

Market opportunity by Source ($ million)
Data Table on Market opportunity by Source ($ million)

11. Customer Landscape

11.1 Customer landscape overview

Analysis of price sensitivity, lifecycle, customer purchase basket, adoption rates, and purchase criteria

12. Geographic Landscape

12.1 Geographic segmentation

Chart on Market share by geography 2025-2030 (%)
Data Table on Market share by geography 2025-2030 (%)

12.2 Geographic comparison

Chart on Geographic comparison
Data Table on Geographic comparison

12.3 North America - Market size and forecast 2025-2030

Chart on North America - Market size and forecast 2025-2030 ($ million)
Data Table on North America - Market size and forecast 2025-2030 ($ million)
Chart on North America - Year-over-year growth 2025-2030 (%)
Data Table on North America - Year-over-year growth 2025-2030 (%)
Chart on Regional Comparison - North America
Data Table on Regional Comparison - North America

12.3.1 US - Market size and forecast 2025-2030

Chart on US - Market size and forecast 2025-2030 ($ million)
Data Table on US - Market size and forecast 2025-2030 ($ million)
Chart on US - Year-over-year growth 2025-2030 (%)
Data Table on US - Year-over-year growth 2025-2030 (%)

12.3.2 Canada - Market size and forecast 2025-2030

Chart on Canada - Market size and forecast 2025-2030 ($ million)
Data Table on Canada - Market size and forecast 2025-2030 ($ million)
Chart on Canada - Year-over-year growth 2025-2030 (%)
Data Table on Canada - Year-over-year growth 2025-2030 (%)

12.3.3 Mexico - Market size and forecast 2025-2030

Chart on Mexico - Market size and forecast 2025-2030 ($ million)
Data Table on Mexico - Market size and forecast 2025-2030 ($ million)
Chart on Mexico - Year-over-year growth 2025-2030 (%)
Data Table on Mexico - Year-over-year growth 2025-2030 (%)

12.4 Europe - Market size and forecast 2025-2030

Chart on Europe - Market size and forecast 2025-2030 ($ million)
Data Table on Europe - Market size and forecast 2025-2030 ($ million)
Chart on Europe - Year-over-year growth 2025-2030 (%)
Data Table on Europe - Year-over-year growth 2025-2030 (%)
Chart on Regional Comparison - Europe
Data Table on Regional Comparison - Europe

12.4.1 Germany - Market size and forecast 2025-2030

Chart on Germany - Market size and forecast 2025-2030 ($ million)
Data Table on Germany - Market size and forecast 2025-2030 ($ million)
Chart on Germany - Year-over-year growth 2025-2030 (%)
Data Table on Germany - Year-over-year growth 2025-2030 (%)

12.4.2 UK - Market size and forecast 2025-2030

Chart on UK - Market size and forecast 2025-2030 ($ million)
Data Table on UK - Market size and forecast 2025-2030 ($ million)
Chart on UK - Year-over-year growth 2025-2030 (%)
Data Table on UK - Year-over-year growth 2025-2030 (%)

12.4.3 France - Market size and forecast 2025-2030

Chart on France - Market size and forecast 2025-2030 ($ million)
Data Table on France - Market size and forecast 2025-2030 ($ million)
Chart on France - Year-over-year growth 2025-2030 (%)
Data Table on France - Year-over-year growth 2025-2030 (%)

12.4.4 Italy - Market size and forecast 2025-2030

Chart on Italy - Market size and forecast 2025-2030 ($ million)
Data Table on Italy - Market size and forecast 2025-2030 ($ million)
Chart on Italy - Year-over-year growth 2025-2030 (%)
Data Table on Italy - Year-over-year growth 2025-2030 (%)

12.4.5 Spain - Market size and forecast 2025-2030

Chart on Spain - Market size and forecast 2025-2030 ($ million)
Data Table on Spain - Market size and forecast 2025-2030 ($ million)
Chart on Spain - Year-over-year growth 2025-2030 (%)
Data Table on Spain - Year-over-year growth 2025-2030 (%)

12.4.6 The Netherlands - Market size and forecast 2025-2030

Chart on The Netherlands - Market size and forecast 2025-2030 ($ million)
Data Table on The Netherlands - Market size and forecast 2025-2030 ($ million)
Chart on The Netherlands - Year-over-year growth 2025-2030 (%)
Data Table on The Netherlands - Year-over-year growth 2025-2030 (%)

12.5 APAC - Market size and forecast 2025-2030

Chart on APAC - Market size and forecast 2025-2030 ($ million)
Data Table on APAC - Market size and forecast 2025-2030 ($ million)
Chart on APAC - Year-over-year growth 2025-2030 (%)
Data Table on APAC - Year-over-year growth 2025-2030 (%)
Chart on Regional Comparison - APAC
Data Table on Regional Comparison - APAC

12.5.1 China - Market size and forecast 2025-2030

Chart on China - Market size and forecast 2025-2030 ($ million)
Data Table on China - Market size and forecast 2025-2030 ($ million)
Chart on China - Year-over-year growth 2025-2030 (%)
Data Table on China - Year-over-year growth 2025-2030 (%)

12.5.2 Japan - Market size and forecast 2025-2030

Chart on Japan - Market size and forecast 2025-2030 ($ million)
Data Table on Japan - Market size and forecast 2025-2030 ($ million)
Chart on Japan - Year-over-year growth 2025-2030 (%)
Data Table on Japan - Year-over-year growth 2025-2030 (%)

12.5.3 India - Market size and forecast 2025-2030

Chart on India - Market size and forecast 2025-2030 ($ million)
Data Table on India - Market size and forecast 2025-2030 ($ million)
Chart on India - Year-over-year growth 2025-2030 (%)
Data Table on India - Year-over-year growth 2025-2030 (%)

12.5.4 South Korea - Market size and forecast 2025-2030

Chart on South Korea - Market size and forecast 2025-2030 ($ million)
Data Table on South Korea - Market size and forecast 2025-2030 ($ million)
Chart on South Korea - Year-over-year growth 2025-2030 (%)
Data Table on South Korea - Year-over-year growth 2025-2030 (%)

12.5.5 Australia - Market size and forecast 2025-2030

Chart on Australia - Market size and forecast 2025-2030 ($ million)
Data Table on Australia - Market size and forecast 2025-2030 ($ million)
Chart on Australia - Year-over-year growth 2025-2030 (%)
Data Table on Australia - Year-over-year growth 2025-2030 (%)

12.5.6 Indonesia - Market size and forecast 2025-2030

Chart on Indonesia - Market size and forecast 2025-2030 ($ million)
Data Table on Indonesia - Market size and forecast 2025-2030 ($ million)
Chart on Indonesia - Year-over-year growth 2025-2030 (%)
Data Table on Indonesia - Year-over-year growth 2025-2030 (%)

12.6 South America - Market size and forecast 2025-2030

Chart on South America - Market size and forecast 2025-2030 ($ million)
Data Table on South America - Market size and forecast 2025-2030 ($ million)
Chart on South America - Year-over-year growth 2025-2030 (%)
Data Table on South America - Year-over-year growth 2025-2030 (%)
Chart on Regional Comparison - South America
Data Table on Regional Comparison - South America

12.6.1 Brazil - Market size and forecast 2025-2030

Chart on Brazil - Market size and forecast 2025-2030 ($ million)
Data Table on Brazil - Market size and forecast 2025-2030 ($ million)
Chart on Brazil - Year-over-year growth 2025-2030 (%)
Data Table on Brazil - Year-over-year growth 2025-2030 (%)

12.6.2 Argentina - Market size and forecast 2025-2030

Chart on Argentina - Market size and forecast 2025-2030 ($ million)
Data Table on Argentina - Market size and forecast 2025-2030 ($ million)
Chart on Argentina - Year-over-year growth 2025-2030 (%)
Data Table on Argentina - Year-over-year growth 2025-2030 (%)

12.6.3 Chile - Market size and forecast 2025-2030

Chart on Chile - Market size and forecast 2025-2030 ($ million)
Data Table on Chile - Market size and forecast 2025-2030 ($ million)
Chart on Chile - Year-over-year growth 2025-2030 (%)
Data Table on Chile - Year-over-year growth 2025-2030 (%)

12.7 Middle East and Africa - Market size and forecast 2025-2030

Chart on Middle East and Africa - Market size and forecast 2025-2030 ($ million)
Data Table on Middle East and Africa - Market size and forecast 2025-2030 ($ million)
Chart on Middle East and Africa - Year-over-year growth 2025-2030 (%)
Data Table on Middle East and Africa - Year-over-year growth 2025-2030 (%)
Chart on Regional Comparison - Middle East and Africa
Data Table on Regional Comparison - Middle East and Africa

12.7.1 Saudi Arabia - Market size and forecast 2025-2030

Chart on Saudi Arabia - Market size and forecast 2025-2030 ($ million)
Data Table on Saudi Arabia - Market size and forecast 2025-2030 ($ million)
Chart on Saudi Arabia - Year-over-year growth 2025-2030 (%)
Data Table on Saudi Arabia - Year-over-year growth 2025-2030 (%)

12.7.2 UAE - Market size and forecast 2025-2030

Chart on UAE - Market size and forecast 2025-2030 ($ million)
Data Table on UAE - Market size and forecast 2025-2030 ($ million)
Chart on UAE - Year-over-year growth 2025-2030 (%)
Data Table on UAE - Year-over-year growth 2025-2030 (%)

12.7.3 South Africa - Market size and forecast 2025-2030

Chart on South Africa - Market size and forecast 2025-2030 ($ million)
Data Table on South Africa - Market size and forecast 2025-2030 ($ million)
Chart on South Africa - Year-over-year growth 2025-2030 (%)
Data Table on South Africa - Year-over-year growth 2025-2030 (%)

12.7.4 Israel - Market size and forecast 2025-2030

Chart on Israel - Market size and forecast 2025-2030 ($ million)
Data Table on Israel - Market size and forecast 2025-2030 ($ million)
Chart on Israel - Year-over-year growth 2025-2030 (%)
Data Table on Israel - Year-over-year growth 2025-2030 (%)

12.7.5 Turkey - Market size and forecast 2025-2030

Chart on Turkey - Market size and forecast 2025-2030 ($ million)
Data Table on Turkey - Market size and forecast 2025-2030 ($ million)
Chart on Turkey - Year-over-year growth 2025-2030 (%)
Data Table on Turkey - Year-over-year growth 2025-2030 (%)

12.8 Market opportunity by geography

Market opportunity by geography ($ million)
Data Tables on Market opportunity by geography ($ million)

13. Drivers, Challenges, and Opportunity

13.1 Market drivers

Multiple applications of sugar substitutes
Increasing popularity of low-calorie sweeteners
Growing demand for natural high-intensity sweeteners

13.2 Market challenges

Stringent food safety regulations
Health problems associated with high-fructose corn syrup
Negative criticism associated with artificial sweeteners

13.3 Impact of drivers and challenges

Impact of drivers and challenges in 2025 and 2030

13.4 Market opportunities

Growing demand for organic food sweeteners
New product launches
Non-GMO project verification

14. Competitive Landscape

14.1 Overview

14.2

Overview on criticality of inputs and factors of differentiation

14.3 Landscape disruption

Overview on factors of disruption

14.4 Industry risks

Impact of key risks on business

15. Competitive Analysis

15.1 Companies profiled

Companies covered

15.2 Company ranking index

15.3 Market positioning of companies

Matrix on companies position and classification

15.4 Ajinomoto Co. Inc.

Ajinomoto Co. Inc. - Overview
Ajinomoto Co. Inc. - Business segments
Ajinomoto Co. Inc. - Key news
Ajinomoto Co. Inc. - Key offerings
Ajinomoto Co. Inc. - Segment focus
SWOT

15.5 Archer Daniels Midland Co.

Archer Daniels Midland Co. - Overview
Archer Daniels Midland Co. - Business segments
Archer Daniels Midland Co. - Key news
Archer Daniels Midland Co. - Key offerings
Archer Daniels Midland Co. - Segment focus
SWOT

15.6 Cargill Inc.

Cargill Inc. - Overview
Cargill Inc. - Product / Service
Cargill Inc. - Key offerings
SWOT

15.7 Celanese Corp.

Celanese Corp. - Overview
Celanese Corp. - Business segments
Celanese Corp. - Key news
Celanese Corp. - Key offerings
Celanese Corp. - Segment focus
SWOT

15.8 Dohler GmbH

Dohler GmbH - Overview
Dohler GmbH - Product / Service
Dohler GmbH - Key offerings
SWOT

15.9 DuPont de Nemours Inc.

DuPont de Nemours Inc. - Overview
DuPont de Nemours Inc. - Business segments
DuPont de Nemours Inc. - Key news
DuPont de Nemours Inc. - Key offerings
DuPont de Nemours Inc. - Segment focus
SWOT

15.10 Foodchem International Corp.

Foodchem International Corp. - Overview
Foodchem International Corp. - Product / Service
Foodchem International Corp. - Key offerings
SWOT

15.11 GLG Life Tech Corp.

GLG Life Tech Corp. - Overview
GLG Life Tech Corp. - Product / Service
GLG Life Tech Corp. - Key offerings
SWOT

15.12 Ingredion Inc.

Ingredion Inc. - Overview
Ingredion Inc. - Business segments
Ingredion Inc. - Key news
Ingredion Inc. - Key offerings
Ingredion Inc. - Segment focus
SWOT

15.13 International Flavors Inc.

International Flavors Inc. - Overview
International Flavors Inc. - Business segments
International Flavors Inc. - Key news
International Flavors Inc. - Key offerings
International Flavors Inc. - Segment focus
SWOT

15.14 Kerry Group Plc

Kerry Group Plc - Overview
Kerry Group Plc - Business segments
Kerry Group Plc - Key offerings
Kerry Group Plc - Segment focus
SWOT

15.15 Roquette Freres SA

Roquette Freres SA - Overview
Roquette Freres SA - Product / Service
Roquette Freres SA - Key offerings
SWOT

15.16 Tate and Lyle Plc

Tate and Lyle Plc - Overview
Tate and Lyle Plc - Business segments
Tate and Lyle Plc - Key news
Tate and Lyle Plc - Key offerings
Tate and Lyle Plc - Segment focus
SWOT

15.17 Tereos Participations

Tereos Participations - Overview
Tereos Participations - Product / Service
Tereos Participations - Key offerings
SWOT

15.18 Wilmar International Ltd.

Wilmar International Ltd. - Overview
Wilmar International Ltd. - Business segments
Wilmar International Ltd. - Key offerings
Wilmar International Ltd. - Segment focus
SWOT

16. Appendix

16.1 Scope of the report

Market definition
Objectives
Notes and caveats

16.2 Inclusions and exclusions checklist

Inclusions checklist
Exclusions checklist

16.3 Currency conversion rates for US$

16.4 Research methodology

16.5 Data procurement

Information sources

16.6 Data validation

16.7 Validation techniques employed for market sizing

16.8 Data synthesis

16.9 360 degree market analysis

16.10 List of abbreviations

Research Methodology

Technavio presents a detailed picture of the market by way of study, synthesis, and summation of data from multiple sources. The analysts have presented the various facets of the market with a particular focus on identifying the key industry influencers. The data thus presented is comprehensive, reliable, and the result of extensive research, both primary and secondary.

INFORMATION SOURCES

Primary sources

  • Manufacturers and suppliers
  • Channel partners
  • Industry experts
  • Strategic decision makers

Secondary sources

  • Industry journals and periodicals
  • Government data
  • Financial reports of key industry players
  • Historical data
  • Press releases

DATA ANALYSIS

Data Synthesis

  • Collation of data
  • Estimation of key figures
  • Analysis of derived insights

Data Validation

  • Triangulation with data models
  • Reference against proprietary databases
  • Corroboration with industry experts

REPORT WRITING

Qualitative

  • Market drivers
  • Market challenges
  • Market trends
  • Five forces analysis

Quantitative

  • Market size and forecast
  • Market segmentation
  • Geographical insights
  • Competitive landscape

Interested in this report?

Get your sample now to see our research methodology and insights!

Download Now

Frequently Asked Questions

Food Sweetener market growth will increase by USD 1969.0 million during 2026-2030.

The Food Sweetener market is expected to grow at a CAGR of 4.4% during 2026-2030.

Food Sweetener market is segmented by Type (High-intensity sweeteners, Low-intensity sweeteners) Application (Bakery and confectionery, Beverages, Dairy and frozen desserts, Others) Source (Plant-based, Synthetic, Bio-engineered)

Ajinomoto Co. Inc., Archer Daniels Midland Co., Cargill Inc., Celanese Corp., Dohler GmbH, DuPont de Nemours Inc., Foodchem International Corp., GLG Life Tech Corp., Ingredion Inc., International Flavors Inc., Kerry Group Plc, Roquette Freres SA, Tate and Lyle Plc, Tereos Participations, Wilmar International Ltd. are a few of the key vendors in the Food Sweetener market.

North America will register the highest growth rate of 41.2% among the other regions. Therefore, the Food Sweetener market in North America is expected to garner significant business opportunities for the vendors during the forecast period.

US, Canada, Mexico, Germany, UK, France, Italy, Spain, The Netherlands, China, Japan, India, South Korea, Australia, Indonesia, Brazil, Argentina, Chile, Saudi Arabia, UAE, South Africa, Israel, Turkey

  • Multiple applications of sugar substitutes is the driving factor this market.

The Food Sweetener market vendors should focus on grabbing business opportunities from the Type segment as it accounted for the largest market share in the base year.