Freight Audit And Payment Market Analysis, Size, and Forecast 2026-2030: North America (US, Canada, and Mexico), Europe (Germany, UK, and France), APAC (China, Japan, and India), Middle East and Africa (Saudi Arabia, UAE, and South Africa), South America (Brazil, Argentina, and Colombia), and Rest of World (ROW)

Freight Audit And Payment Market Analysis, Size, and Forecast 2026-2030:
North America (US, Canada, and Mexico), Europe (Germany, UK, and France), APAC (China, Japan, and India), Middle East and Africa (Saudi Arabia, UAE, and South Africa), South America (Brazil, Argentina, and Colombia), and Rest of World (ROW)

Published: Mar 2026 299 Pages SKU: IRTNTR81269

Market Overview at a Glance

$651.2 Mn
Market Opportunity
11.2%
CAGR 2025 - 2030
38.4%
North America Growth
$577.8 Mn
Large enterprises segment 2024

Freight Audit And Payment Market Size 2026-2030

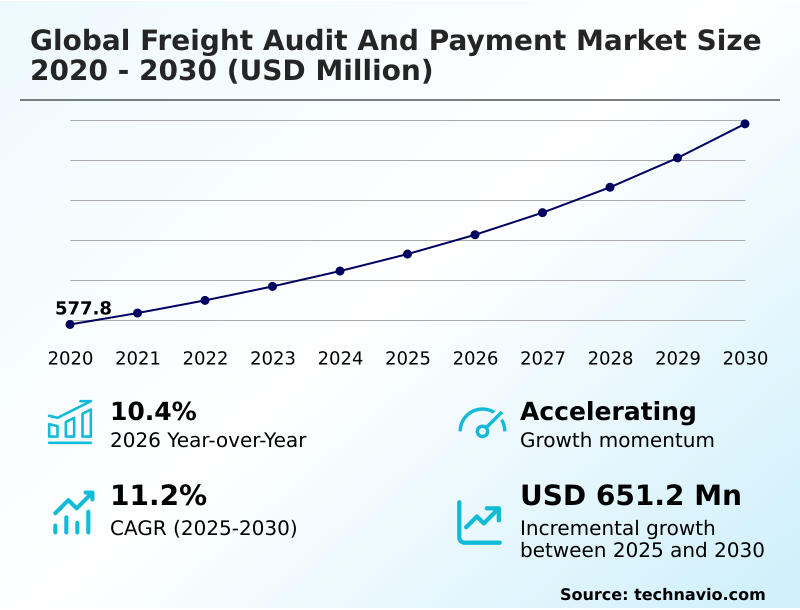
The freight audit and payment market size is valued to increase by USD 651.2 million, at a CAGR of 11.2% from 2025 to 2030. Increasing complexity of global supply chains and multi-modal logistics. will drive the freight audit and payment market.

Major Market Trends & Insights

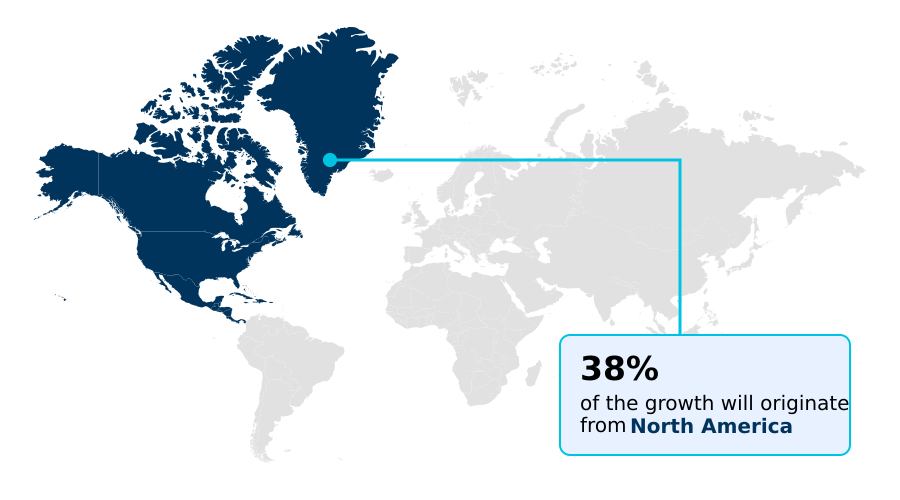
  • North America dominated the market and accounted for a 38.4% growth during the forecast period.
  • By Business Segment - Large enterprises segment was valued at USD 577.8 million in 2024
  • By Application - Road freight segment accounted for the largest market revenue share in 2024

Market Size & Forecast

  • Market Opportunities: USD 1.00 billion
  • Market Future Opportunities: USD 651.2 million
  • CAGR from 2025 to 2030 : 11.2%

Market Summary

  • The Freight Audit and Payment market is integral to modern supply chain management, focused on optimizing financial workflows and ensuring billing accuracy. The primary driver is the increasing complexity of logistics networks, which makes manual invoice reconciliation impractical and prone to error.
  • Digital transformation is a key catalyst, with technologies like artificial intelligence and machine learning enabling the automated validation of vast numbers of freight invoices against contracts and tariffs. This identifies discrepancies such as duplicate billings and incorrect rates, leading to significant cost recovery.
  • A key trend is the integration of sustainability metrics, allowing organizations to track the carbon footprint of their shipments directly from invoice data. For instance, a global manufacturer can leverage a centralized platform to audit invoices from various carriers across different transport modes, ensuring that payments are accurate while also monitoring compliance with its environmental, social, and governance goals.
  • Despite these advancements, challenges such as data standardization and cybersecurity persist, requiring continuous investment in secure and interoperable systems.

What will be the Size of the Freight Audit And Payment Market during the forecast period?

Get Key Insights on Market Forecast (PDF) Request Free Sample

How is the Freight Audit And Payment Market Segmented?

The freight audit and payment industry research report provides comprehensive data (region-wise segment analysis), with forecasts and estimates in "USD million" for the period 2026-2030, as well as historical data from 2020-2024 for the following segments.
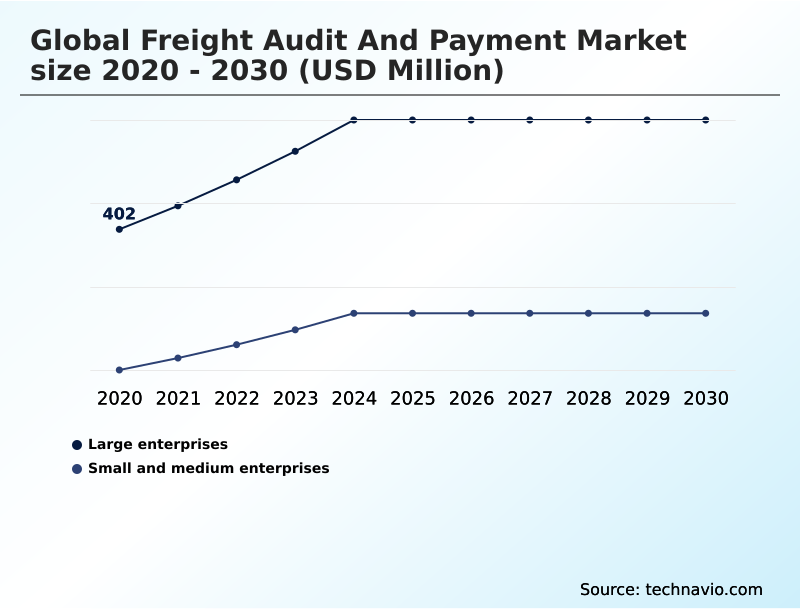
  • Business segment
    • Large enterprises
    • Small and medium enterprises
  • Application
    • Road freight
    • Ocean freight
    • Air freight
    • Rail freight
  • End-user
    • Retail and e-commerce
    • Manufacturing
    • Food and beverage
    • Healthcare
    • Others
  • Geography
    • North America
      • US
      • Canada
      • Mexico
    • Europe
      • Germany
      • UK
      • France
    • APAC
      • China
      • Japan
      • India
    • Middle East and Africa
      • Saudi Arabia
      • UAE
      • South Africa
    • South America
      • Brazil
      • Argentina
      • Colombia
    • Rest of World (ROW)

By Business Segment Insights

The large enterprises segment is estimated to witness significant growth during the forecast period.

Large enterprises drive the market, leveraging sophisticated platforms for comprehensive transportation spend management. These organizations utilize freight invoice auditing to manage complex, multi-modal logistics, where automated invoice validation improves accuracy by over 15%.

Integrated systems facilitate detailed general ledger coding and bill of lading reconciliation, essential for maintaining financial integrity across global operations. The focus is on transforming carrier invoice processing from a cost center into a strategic function.

By centralizing data, these firms enhance their dispute resolution workflow and gain deep visibility into transportation expenditures, enabling better cost control and operational efficiency. The adoption of such platforms is a critical component of modern supply chain financial management.

Request Free Sample

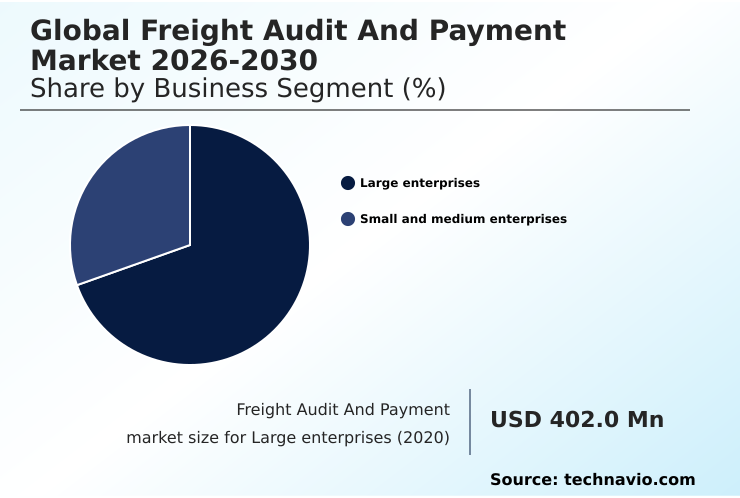
The Large enterprises segment was valued at USD 577.8 million in 2024 and showed a gradual increase during the forecast period.

Request Free Sample

Regional Analysis

North America is estimated to contribute 38.4% to the growth of the global market during the forecast period.Technavio’s analysts have elaborately explained the regional trends and drivers that shape the market during the forecast period.

See How Freight Audit And Payment Market Demand is Rising in North America Request Free Sample

The market's geographic landscape is led by North America, which accounts for nearly 38.4% of the incremental growth, driven by a mature logistics sector and high adoption of financial technologies. Europe follows, emphasizing regulatory compliance and sustainability.

However, APAC is poised to exhibit the fastest regional growth, fueled by expanding manufacturing and e-commerce sectors. The implementation of real-time rate compliance and accurate landed cost calculation is becoming critical in this region.

Global freight payment services are adapting to this shift by enhancing their multi-currency payment processing capabilities.

The increasing adoption of e-invoicing for logistics is also a significant factor, as it standardizes data formats and streamlines the auditing process across diverse geographic markets, reducing complexity for multinational corporations.

Market Dynamics

Our researchers analyzed the data with 2025 as the base year, along with the key drivers, trends, and challenges. A holistic analysis of drivers will help companies refine their marketing strategies to gain a competitive advantage.

  • As organizations explore how to automate freight invoice validation, the focus shifts toward integrated platforms that offer end-to-end management. Implementing best practices for freight bill auditing is crucial for success, with industry leaders reporting error reduction rates twice as high as those relying on manual checks.
  • A key strategy involves reducing transportation spend with AI, which can analyze historical data to predict future costs and recommend optimal shipping strategies. Many businesses weigh the benefits of outsourced freight payment against in-house solutions, considering factors like expertise and scalability.
  • In a vendor comparison of freight audit services, key differentiators include technological capabilities, global reach, and the ability to handle multi-modal transportation spend. A significant hurdle remains the challenges in global freight settlement, including currency fluctuations and varying regulations. The impact of blockchain on freight payments is a growing topic of discussion, as it promises to enhance security and transparency.
  • The ability to accurately calculate the total landed cost for shipments remains a core requirement, providing true visibility into supply chain profitability. Businesses also seek solutions for managing accessorial charges in logistics, a common source of billing disputes. Automating dispute resolution with carriers not only speeds up payment cycles but also improves relationships.
  • Ultimately, using data analytics for carrier negotiation allows shippers to secure more favorable rates, directly impacting the bottom line.

What are the key market drivers leading to the rise in the adoption of Freight Audit And Payment Industry?

  • The increasing complexity of global supply chains and multi-modal logistics is a primary driver for the market.

  • The primary drivers are the increasing complexity of supply chains and the push for digital transformation. As companies engage in multi-modal logistics, the volume and variety of invoices grow, making manual verification impractical.
  • Digitalization, particularly through AI in freight auditing and automated invoice data extraction, improves data accuracy by over 40%. These technologies are crucial for effective supply chain payment optimization and ensuring freight payment compliance across jurisdictions.
  • The demand for transportation spend visibility platforms is also a significant catalyst, as businesses seek to gain a holistic view of their logistics expenditures.
  • This enables better financial control and strategic decision-making, transforming the freight audit process into a competitive advantage rather than just an administrative necessity.

What are the market trends shaping the Freight Audit And Payment Industry?

  • A key market trend involves the integration of environmental metrics and carbon accounting within the audit lifecycle. This fusion allows for holistic value management beyond simple cost recovery.

  • Key trends are reshaping the market, moving it beyond simple cost recovery toward strategic value creation. The integration of smart contract settlement and blockchain for freight payments is a significant technological shift, with early adopters reporting up to a 70% reduction in settlement times. This level of automation minimizes disputes and enhances trust between shippers and carriers.
  • Simultaneously, the focus on sustainability is driving the adoption of carbon emission auditing as part of the standard workflow, directly supporting ESG reporting in freight audit. Furthermore, the expansion of predictive cost analytics allows businesses to forecast transportation spend with up to 95% accuracy.
  • This transition from reactive auditing to proactive financial planning is a hallmark of modern freight audit and payment solutions.

What challenges does the Freight Audit And Payment Industry face during its growth?

  • The fragmentation of data formats and significant interoperability hurdles present a key challenge affecting industry growth.

  • Significant challenges persist, primarily stemming from data fragmentation and security vulnerabilities. The lack of standardized invoice formats forces providers to rely on complex discrepancy reporting and robotic process automation in freight audit, which can increase processing time by up to 50%. This interoperability issue complicates payment automation and hinders real-time analysis.
  • Moreover, the industry faces heightened security risks in freight payment systems, with cybersecurity incidents in logistics reported to have risen nearly 25% year-over-year. As a result, companies must balance the need for efficient, cloud-based freight audit tools with the imperative to protect sensitive financial data against increasingly sophisticated threats, adding to operational costs and complexity.

Exclusive Technavio Analysis on Customer Landscape

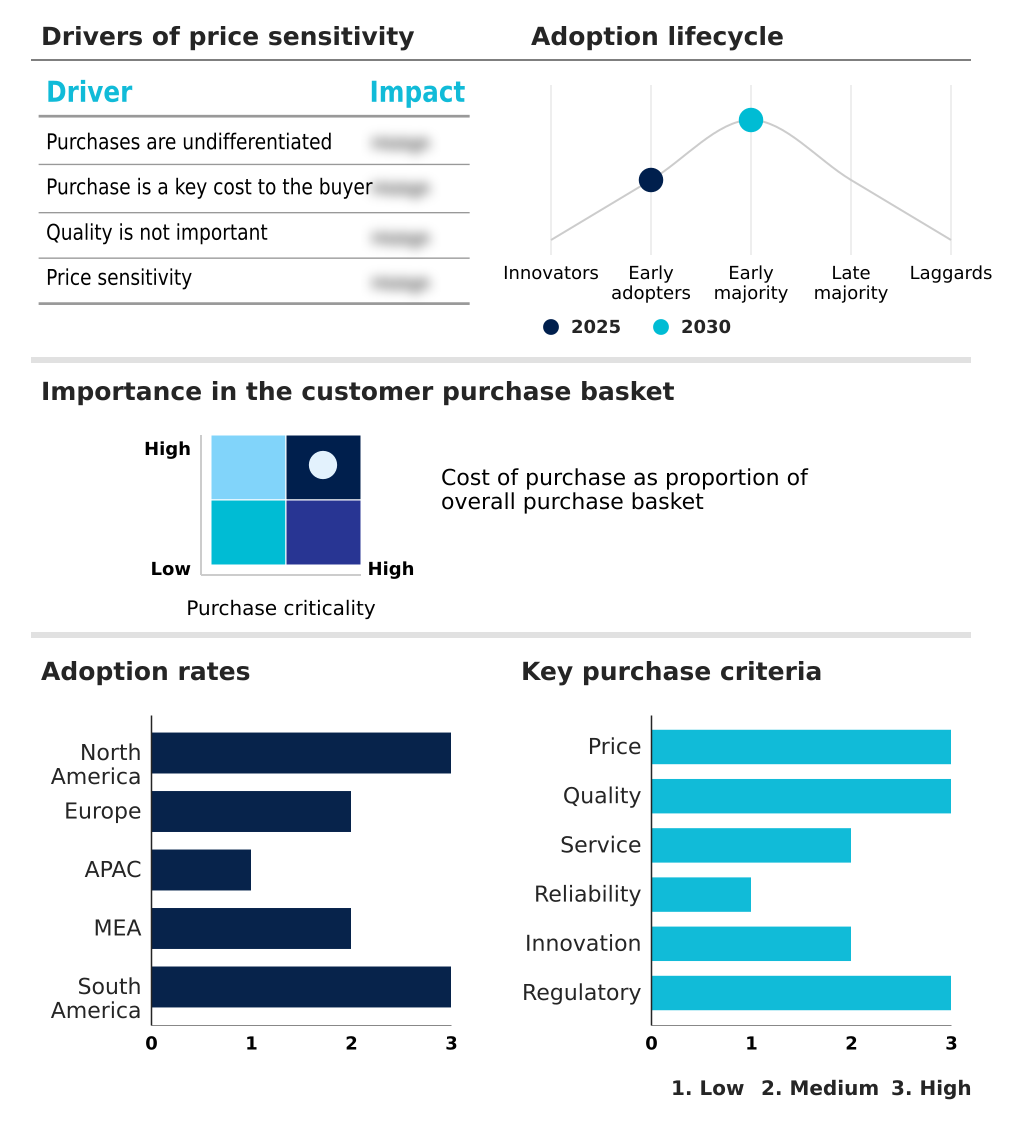
The freight audit and payment market forecasting report includes the adoption lifecycle of the market, covering from the innovator’s stage to the laggard’s stage. It focuses on adoption rates in different regions based on penetration. Furthermore, the freight audit and payment market report also includes key purchase criteria and drivers of price sensitivity to help companies evaluate and develop their market growth analysis strategies.

Customer Landscape of Freight Audit And Payment Industry

Competitive Landscape

Companies are implementing various strategies, such as strategic alliances, freight audit and payment market forecast, partnerships, mergers and acquisitions, geographical expansion, and product/service launches, to enhance their presence in the industry.

A3 Freight Payment - Provides integrated freight audit and payment capabilities within transportation management systems, automating invoice matching and optimizing spend for enhanced logistics efficiency and carrier compliance.

The industry research and growth report includes detailed analyses of the competitive landscape of the market and information about key companies, including:

  • A3 Freight Payment
  • Blue Yonder Group Inc.
  • Cass Information Systems Inc.
  • Continental Traffic Service Inc.
  • Data2Logistics LLC
  • Enveyo
  • Fortigo Inc.
  • IBM Corp.
  • Intelligent Audit
  • Kuehne Nagel Management AG
  • LCC Automation
  • National Traffic Services
  • nVision Global
  • RateLinx
  • SAP SE
  • Shipwell
  • Translogistics Inc
  • Trax Group
  • U.S. Bancorp
  • Uber Freight

Qualitative and quantitative analysis of companies has been conducted to help clients understand the wider business environment as well as the strengths and weaknesses of key industry players. Data is qualitatively analyzed to categorize companies as pure play, category-focused, industry-focused, and diversified; it is quantitatively analyzed to categorize companies as dominant, leading, strong, tentative, and weak.

Recent Development and News in Freight audit and payment market

  • In November 2025, a global trade facilitation group introduced a digital portal to assist companies in reconciling value-added tax and import duties across diverse jurisdictions during the freight payment process.
  • In September 2025, an influential environmental protection agency in Europe enacted a new regulation requiring all large corporations to include verified carbon emission data in the annual financial disclosures of the firm for every logistics transaction.
  • In August 2025, a financial technology consortium launched a pilot program for a decentralized payment gateway that automatically triggers carrier settlements once an audit is verified by smart contracts.
  • In May 2025, a prominent maritime technology consortium in the Asia-Pacific region launched a digital portal that utilizes blockchain to facilitate near-instantaneous settlement for ocean freight transactions.

Dive into Technavio’s robust research methodology, blending expert interviews, extensive data synthesis, and validated models for unparalleled Freight Audit And Payment Market insights. See full methodology.

Market Scope
Page number 299
Base year 2025
Historic period 2020-2024
Forecast period 2026-2030
Growth momentum & CAGR Accelerate at a CAGR of 11.2%
Market growth 2026-2030 USD 651.2 million
Market structure Fragmented
YoY growth 2025-2026(%) 10.4%
Key countries US, Canada, Mexico, Germany, UK, France, Italy, The Netherlands, Spain, China, Japan, India, South Korea, Australia, Indonesia, Saudi Arabia, UAE, South Africa, Israel, Turkey, Brazil, Argentina and Colombia
Competitive landscape Leading Companies, Market Positioning of Companies, Competitive Strategies, and Industry Risks

Request Free Sample

Research Analyst Overview

  • The Freight Audit and Payment market has evolved from a transactional service to a strategic component of supply chain financial management. The core function of freight invoice auditing, which includes duplicate billing detection and bill of lading reconciliation, is now enhanced by advanced technologies. Leading platforms now achieve over 99% accuracy in automated invoice validation.
  • This shift is driven by the need for granular transportation spend management and real-time visibility. The integration of predictive cost analytics and procurement data analytics allows organizations to move beyond simple discrepancy reporting. Modern freight settlement platforms offer robust payment automation and integrate seamlessly with transportation management systems, providing detailed general ledger coding.
  • Boardroom-level decisions are increasingly influenced by the insights derived from carrier performance benchmarking and landed cost calculation, as these metrics directly impact profitability and operational efficiency. The ability to perform carbon emission auditing and manage dispute resolution workflows effectively are also becoming standard expectations.

What are the Key Data Covered in this Freight Audit And Payment Market Research and Growth Report?

  • What is the expected growth of the Freight Audit And Payment Market between 2026 and 2030?

    • USD 651.2 million, at a CAGR of 11.2%

  • What segmentation does the market report cover?

    • The report is segmented by Business Segment (Large enterprises, and Small and medium enterprises), Application (Road freight, Ocean freight, Air freight, and Rail freight), End-user (Retail and e-commerce, Manufacturing, Food and beverage, Healthcare, and Others) and Geography (North America, Europe, APAC, Middle East and Africa, South America)

  • Which regions are analyzed in the report?

    • North America, Europe, APAC, Middle East and Africa and South America

  • What are the key growth drivers and market challenges?

    • Increasing complexity of global supply chains and multi-modal logistics., Fragmentation of data formats and interoperability hurdles

  • Who are the major players in the Freight Audit And Payment Market?

    • A3 Freight Payment, Blue Yonder Group Inc., Cass Information Systems Inc., Continental Traffic Service Inc., Data2Logistics LLC, Enveyo, Fortigo Inc., IBM Corp., Intelligent Audit, Kuehne Nagel Management AG, LCC Automation, National Traffic Services, nVision Global, RateLinx, SAP SE, Shipwell, Translogistics Inc, Trax Group, U.S. Bancorp and Uber Freight

Market Research Insights

  • The market's dynamics are shaped by a strong focus on operational efficiency and financial control. The adoption of automated freight settlement systems has been shown to reduce invoice discrepancies by up to 30%, a significant improvement over manual processes. Furthermore, leveraging business intelligence for logistics spend can lower overall transportation costs by 5-10% through better carrier negotiation and route optimization.
  • The implementation of AI in freight auditing further enhances these outcomes by identifying complex error patterns that traditional rule-based systems miss. As ESG reporting in freight audit becomes standard, companies are gaining dual benefits: compliance and cost savings.
  • This shift transforms transportation invoice reconciliation from a back-office task into a strategic tool for supply chain payment optimization, improving data accuracy and financial visibility across the enterprise.

We can help! Our analysts can customize this freight audit and payment market research report to meet your requirements.

Get in touch

1. Executive Summary

1.1 Market overview

Executive Summary - Chart on Market Overview
Executive Summary - Data Table on Market Overview
Executive Summary - Chart on Global Market Characteristics
Executive Summary - Chart on Market by Geography
Executive Summary - Chart on Market Segmentation by Business Segment
Executive Summary - Chart on Market Segmentation by Application
Executive Summary - Chart on Market Segmentation by End-user
Executive Summary - Chart on Incremental Growth
Executive Summary - Data Table on Incremental Growth
Executive Summary - Chart on Company Market Positioning

2. Technavio Analysis

2.1 Analysis of price sensitivity, lifecycle, customer purchase basket, adoption rates, and purchase criteria

2.2 Criticality of inputs and Factors of differentiation

Chart on Overview on criticality of inputs and factors of differentiation

2.3 Factors of disruption

Chart on Overview on factors of disruption

2.4 Impact of drivers and challenges

Chart on Impact of drivers and challenges in 2025 and 2030

3. Market Landscape

3.1 Market ecosystem

Chart on Parent Market
Data Table on - Parent Market

3.2 Market characteristics

Chart on Market characteristics analysis

3.3 Value chain analysis

Chart on Value chain analysis

4. Market Sizing

4.1 Market definition

Data Table on Offerings of companies included in the market definition

4.2 Market segment analysis

Market segments

4.3 Market size 2025

4.4 Market outlook: Forecast for 2025-2030

Chart on Global - Market size and forecast 2025-2030 ($ million)
Data Table on Global - Market size and forecast 2025-2030 ($ million)
Chart on Global Market: Year-over-year growth 2025-2030 (%)
Data Table on Global Market: Year-over-year growth 2025-2030 (%)

5. Historic Market Size

5.1 Global Freight Audit And Payment Market 2020 - 2024

Historic Market Size - Data Table on Global Freight Audit And Payment Market 2020 - 2024 ($ million)

5.2 Business segment analysis 2020 - 2024

Historic Market Size - Business Segment 2020 - 2024 ($ million)

5.3 Application segment analysis 2020 - 2024

Historic Market Size - Application Segment 2020 - 2024 ($ million)

5.4 End-user segment analysis 2020 - 2024

Historic Market Size - End-user Segment 2020 - 2024 ($ million)

5.5 Geography segment analysis 2020 - 2024

Historic Market Size - Geography Segment 2020 - 2024 ($ million)

5.6 Country segment analysis 2020 - 2024

Historic Market Size - Country Segment 2020 - 2024 ($ million)

6. Qualitative Analysis

6.1 The AI impact on Global Freight Audit and Payment Market

7. Five Forces Analysis

7.1 Five forces summary

Five forces analysis - Comparison between 2025 and 2030

7.2 Bargaining power of buyers

Bargaining power of buyers - Impact of key factors 2025 and 2030

7.3 Bargaining power of suppliers

Bargaining power of suppliers - Impact of key factors in 2025 and 2030

7.4 Threat of new entrants

Threat of new entrants - Impact of key factors in 2025 and 2030

7.5 Threat of substitutes

Threat of substitutes - Impact of key factors in 2025 and 2030

7.6 Threat of rivalry

Threat of rivalry - Impact of key factors in 2025 and 2030

7.7 Market condition

Chart on Market condition - Five forces 2025 and 2030

8. Market Segmentation by Business Segment

8.1 Market segments

Chart on Market Segmentation by Business Segment - Market share 2025-2030 (%)
Data Table on Market Segmentation by Business Segment - Market share 2025-2030 (%)

8.2 Comparison by Market Segmentation by Business Segment

Chart on Comparison by Market Segmentation by Business Segment
Data Table on Comparison by Market Segmentation by Business Segment

8.3 Large enterprises - Market size and forecast 2025-2030

Chart on Large enterprises - Market size and forecast 2025-2030 ($ million)
Data Table on Large enterprises - Market size and forecast 2025-2030 ($ million)
Chart on Large enterprises - Year-over-year growth 2025-2030 (%)
Data Table on Large enterprises - Year-over-year growth 2025-2030 (%)

8.4 Small and medium enterprises - Market size and forecast 2025-2030

Chart on Small and medium enterprises - Market size and forecast 2025-2030 ($ million)
Data Table on Small and medium enterprises - Market size and forecast 2025-2030 ($ million)
Chart on Small and medium enterprises - Year-over-year growth 2025-2030 (%)
Data Table on Small and medium enterprises - Year-over-year growth 2025-2030 (%)

8.5 Market opportunity by Market Segmentation by Business Segment

Market opportunity by Market Segmentation by Business Segment ($ million)
Data Table on Market opportunity by Market Segmentation by Business Segment ($ million)

9. Market Segmentation by Application

9.1 Market segments

Chart on Application - Market share 2025-2030 (%)
Data Table on Application - Market share 2025-2030 (%)

9.2 Comparison by Application

Chart on Comparison by Application
Data Table on Comparison by Application

9.3 Road freight - Market size and forecast 2025-2030

Chart on Road freight - Market size and forecast 2025-2030 ($ million)
Data Table on Road freight - Market size and forecast 2025-2030 ($ million)
Chart on Road freight - Year-over-year growth 2025-2030 (%)
Data Table on Road freight - Year-over-year growth 2025-2030 (%)

9.4 Ocean freight - Market size and forecast 2025-2030

Chart on Ocean freight - Market size and forecast 2025-2030 ($ million)
Data Table on Ocean freight - Market size and forecast 2025-2030 ($ million)
Chart on Ocean freight - Year-over-year growth 2025-2030 (%)
Data Table on Ocean freight - Year-over-year growth 2025-2030 (%)

9.5 Air freight - Market size and forecast 2025-2030

Chart on Air freight - Market size and forecast 2025-2030 ($ million)
Data Table on Air freight - Market size and forecast 2025-2030 ($ million)
Chart on Air freight - Year-over-year growth 2025-2030 (%)
Data Table on Air freight - Year-over-year growth 2025-2030 (%)

9.6 Rail freight - Market size and forecast 2025-2030

Chart on Rail freight - Market size and forecast 2025-2030 ($ million)
Data Table on Rail freight - Market size and forecast 2025-2030 ($ million)
Chart on Rail freight - Year-over-year growth 2025-2030 (%)
Data Table on Rail freight - Year-over-year growth 2025-2030 (%)

9.7 Market opportunity by Application

Market opportunity by Application ($ million)
Data Table on Market opportunity by Application ($ million)

10. Market Segmentation by End-user

10.1 Market segments

Chart on End-user - Market share 2025-2030 (%)
Data Table on End-user - Market share 2025-2030 (%)

10.2 Comparison by End-user

Chart on Comparison by End-user
Data Table on Comparison by End-user

10.3 Retail and e-commerce - Market size and forecast 2025-2030

Chart on Retail and e-commerce - Market size and forecast 2025-2030 ($ million)
Data Table on Retail and e-commerce - Market size and forecast 2025-2030 ($ million)
Chart on Retail and e-commerce - Year-over-year growth 2025-2030 (%)
Data Table on Retail and e-commerce - Year-over-year growth 2025-2030 (%)

10.4 Manufacturing - Market size and forecast 2025-2030

Chart on Manufacturing - Market size and forecast 2025-2030 ($ million)
Data Table on Manufacturing - Market size and forecast 2025-2030 ($ million)
Chart on Manufacturing - Year-over-year growth 2025-2030 (%)
Data Table on Manufacturing - Year-over-year growth 2025-2030 (%)

10.5 Food and beverage - Market size and forecast 2025-2030

Chart on Food and beverage - Market size and forecast 2025-2030 ($ million)
Data Table on Food and beverage - Market size and forecast 2025-2030 ($ million)
Chart on Food and beverage - Year-over-year growth 2025-2030 (%)
Data Table on Food and beverage - Year-over-year growth 2025-2030 (%)

10.6 Healthcare - Market size and forecast 2025-2030

Chart on Healthcare - Market size and forecast 2025-2030 ($ million)
Data Table on Healthcare - Market size and forecast 2025-2030 ($ million)
Chart on Healthcare - Year-over-year growth 2025-2030 (%)
Data Table on Healthcare - Year-over-year growth 2025-2030 (%)

10.7 Others - Market size and forecast 2025-2030

Chart on Others - Market size and forecast 2025-2030 ($ million)
Data Table on Others - Market size and forecast 2025-2030 ($ million)
Chart on Others - Year-over-year growth 2025-2030 (%)
Data Table on Others - Year-over-year growth 2025-2030 (%)

10.8 Market opportunity by End-user

Market opportunity by End-user ($ million)
Data Table on Market opportunity by End-user ($ million)

11. Customer Landscape

11.1 Customer landscape overview

Analysis of price sensitivity, lifecycle, customer purchase basket, adoption rates, and purchase criteria

12. Geographic Landscape

12.1 Geographic segmentation

Chart on Market share by geography 2025-2030 (%)
Data Table on Market share by geography 2025-2030 (%)

12.2 Geographic comparison

Chart on Geographic comparison
Data Table on Geographic comparison

12.3 North America - Market size and forecast 2025-2030

Chart on North America - Market size and forecast 2025-2030 ($ million)
Data Table on North America - Market size and forecast 2025-2030 ($ million)
Chart on North America - Year-over-year growth 2025-2030 (%)
Data Table on North America - Year-over-year growth 2025-2030 (%)
Chart on Regional Comparison - North America
Data Table on Regional Comparison - North America

12.3.1 US - Market size and forecast 2025-2030

Chart on US - Market size and forecast 2025-2030 ($ million)
Data Table on US - Market size and forecast 2025-2030 ($ million)
Chart on US - Year-over-year growth 2025-2030 (%)
Data Table on US - Year-over-year growth 2025-2030 (%)

12.3.2 Canada - Market size and forecast 2025-2030

Chart on Canada - Market size and forecast 2025-2030 ($ million)
Data Table on Canada - Market size and forecast 2025-2030 ($ million)
Chart on Canada - Year-over-year growth 2025-2030 (%)
Data Table on Canada - Year-over-year growth 2025-2030 (%)

12.3.3 Mexico - Market size and forecast 2025-2030

Chart on Mexico - Market size and forecast 2025-2030 ($ million)
Data Table on Mexico - Market size and forecast 2025-2030 ($ million)
Chart on Mexico - Year-over-year growth 2025-2030 (%)
Data Table on Mexico - Year-over-year growth 2025-2030 (%)

12.4 Europe - Market size and forecast 2025-2030

Chart on Europe - Market size and forecast 2025-2030 ($ million)
Data Table on Europe - Market size and forecast 2025-2030 ($ million)
Chart on Europe - Year-over-year growth 2025-2030 (%)
Data Table on Europe - Year-over-year growth 2025-2030 (%)
Chart on Regional Comparison - Europe
Data Table on Regional Comparison - Europe

12.4.1 Germany - Market size and forecast 2025-2030

Chart on Germany - Market size and forecast 2025-2030 ($ million)
Data Table on Germany - Market size and forecast 2025-2030 ($ million)
Chart on Germany - Year-over-year growth 2025-2030 (%)
Data Table on Germany - Year-over-year growth 2025-2030 (%)

12.4.2 UK - Market size and forecast 2025-2030

Chart on UK - Market size and forecast 2025-2030 ($ million)
Data Table on UK - Market size and forecast 2025-2030 ($ million)
Chart on UK - Year-over-year growth 2025-2030 (%)
Data Table on UK - Year-over-year growth 2025-2030 (%)

12.4.3 France - Market size and forecast 2025-2030

Chart on France - Market size and forecast 2025-2030 ($ million)
Data Table on France - Market size and forecast 2025-2030 ($ million)
Chart on France - Year-over-year growth 2025-2030 (%)
Data Table on France - Year-over-year growth 2025-2030 (%)

12.4.4 Italy - Market size and forecast 2025-2030

Chart on Italy - Market size and forecast 2025-2030 ($ million)
Data Table on Italy - Market size and forecast 2025-2030 ($ million)
Chart on Italy - Year-over-year growth 2025-2030 (%)
Data Table on Italy - Year-over-year growth 2025-2030 (%)

12.4.5 The Netherlands - Market size and forecast 2025-2030

Chart on The Netherlands - Market size and forecast 2025-2030 ($ million)
Data Table on The Netherlands - Market size and forecast 2025-2030 ($ million)
Chart on The Netherlands - Year-over-year growth 2025-2030 (%)
Data Table on The Netherlands - Year-over-year growth 2025-2030 (%)

12.4.6 Spain - Market size and forecast 2025-2030

Chart on Spain - Market size and forecast 2025-2030 ($ million)
Data Table on Spain - Market size and forecast 2025-2030 ($ million)
Chart on Spain - Year-over-year growth 2025-2030 (%)
Data Table on Spain - Year-over-year growth 2025-2030 (%)

12.5 APAC - Market size and forecast 2025-2030

Chart on APAC - Market size and forecast 2025-2030 ($ million)
Data Table on APAC - Market size and forecast 2025-2030 ($ million)
Chart on APAC - Year-over-year growth 2025-2030 (%)
Data Table on APAC - Year-over-year growth 2025-2030 (%)
Chart on Regional Comparison - APAC
Data Table on Regional Comparison - APAC

12.5.1 China - Market size and forecast 2025-2030

Chart on China - Market size and forecast 2025-2030 ($ million)
Data Table on China - Market size and forecast 2025-2030 ($ million)
Chart on China - Year-over-year growth 2025-2030 (%)
Data Table on China - Year-over-year growth 2025-2030 (%)

12.5.2 Japan - Market size and forecast 2025-2030

Chart on Japan - Market size and forecast 2025-2030 ($ million)
Data Table on Japan - Market size and forecast 2025-2030 ($ million)
Chart on Japan - Year-over-year growth 2025-2030 (%)
Data Table on Japan - Year-over-year growth 2025-2030 (%)

12.5.3 India - Market size and forecast 2025-2030

Chart on India - Market size and forecast 2025-2030 ($ million)
Data Table on India - Market size and forecast 2025-2030 ($ million)
Chart on India - Year-over-year growth 2025-2030 (%)
Data Table on India - Year-over-year growth 2025-2030 (%)

12.5.4 South Korea - Market size and forecast 2025-2030

Chart on South Korea - Market size and forecast 2025-2030 ($ million)
Data Table on South Korea - Market size and forecast 2025-2030 ($ million)
Chart on South Korea - Year-over-year growth 2025-2030 (%)
Data Table on South Korea - Year-over-year growth 2025-2030 (%)

12.5.5 Australia - Market size and forecast 2025-2030

Chart on Australia - Market size and forecast 2025-2030 ($ million)
Data Table on Australia - Market size and forecast 2025-2030 ($ million)
Chart on Australia - Year-over-year growth 2025-2030 (%)
Data Table on Australia - Year-over-year growth 2025-2030 (%)

12.5.6 Indonesia - Market size and forecast 2025-2030

Chart on Indonesia - Market size and forecast 2025-2030 ($ million)
Data Table on Indonesia - Market size and forecast 2025-2030 ($ million)
Chart on Indonesia - Year-over-year growth 2025-2030 (%)
Data Table on Indonesia - Year-over-year growth 2025-2030 (%)

12.6 Middle East and Africa - Market size and forecast 2025-2030

Chart on Middle East and Africa - Market size and forecast 2025-2030 ($ million)
Data Table on Middle East and Africa - Market size and forecast 2025-2030 ($ million)
Chart on Middle East and Africa - Year-over-year growth 2025-2030 (%)
Data Table on Middle East and Africa - Year-over-year growth 2025-2030 (%)
Chart on Regional Comparison - Middle East and Africa
Data Table on Regional Comparison - Middle East and Africa

12.6.1 Saudi Arabia - Market size and forecast 2025-2030

Chart on Saudi Arabia - Market size and forecast 2025-2030 ($ million)
Data Table on Saudi Arabia - Market size and forecast 2025-2030 ($ million)
Chart on Saudi Arabia - Year-over-year growth 2025-2030 (%)
Data Table on Saudi Arabia - Year-over-year growth 2025-2030 (%)

12.6.2 UAE - Market size and forecast 2025-2030

Chart on UAE - Market size and forecast 2025-2030 ($ million)
Data Table on UAE - Market size and forecast 2025-2030 ($ million)
Chart on UAE - Year-over-year growth 2025-2030 (%)
Data Table on UAE - Year-over-year growth 2025-2030 (%)

12.6.3 South Africa - Market size and forecast 2025-2030

Chart on South Africa - Market size and forecast 2025-2030 ($ million)
Data Table on South Africa - Market size and forecast 2025-2030 ($ million)
Chart on South Africa - Year-over-year growth 2025-2030 (%)
Data Table on South Africa - Year-over-year growth 2025-2030 (%)

12.6.4 Israel - Market size and forecast 2025-2030

Chart on Israel - Market size and forecast 2025-2030 ($ million)
Data Table on Israel - Market size and forecast 2025-2030 ($ million)
Chart on Israel - Year-over-year growth 2025-2030 (%)
Data Table on Israel - Year-over-year growth 2025-2030 (%)

12.6.5 Turkey - Market size and forecast 2025-2030

Chart on Turkey - Market size and forecast 2025-2030 ($ million)
Data Table on Turkey - Market size and forecast 2025-2030 ($ million)
Chart on Turkey - Year-over-year growth 2025-2030 (%)
Data Table on Turkey - Year-over-year growth 2025-2030 (%)

12.7 South America - Market size and forecast 2025-2030

Chart on South America - Market size and forecast 2025-2030 ($ million)
Data Table on South America - Market size and forecast 2025-2030 ($ million)
Chart on South America - Year-over-year growth 2025-2030 (%)
Data Table on South America - Year-over-year growth 2025-2030 (%)
Chart on Regional Comparison - South America
Data Table on Regional Comparison - South America

12.7.1 Brazil - Market size and forecast 2025-2030

Chart on Brazil - Market size and forecast 2025-2030 ($ million)
Data Table on Brazil - Market size and forecast 2025-2030 ($ million)
Chart on Brazil - Year-over-year growth 2025-2030 (%)
Data Table on Brazil - Year-over-year growth 2025-2030 (%)

12.7.2 Argentina - Market size and forecast 2025-2030

Chart on Argentina - Market size and forecast 2025-2030 ($ million)
Data Table on Argentina - Market size and forecast 2025-2030 ($ million)
Chart on Argentina - Year-over-year growth 2025-2030 (%)
Data Table on Argentina - Year-over-year growth 2025-2030 (%)

12.7.3 Colombia - Market size and forecast 2025-2030

Chart on Colombia - Market size and forecast 2025-2030 ($ million)
Data Table on Colombia - Market size and forecast 2025-2030 ($ million)
Chart on Colombia - Year-over-year growth 2025-2030 (%)
Data Table on Colombia - Year-over-year growth 2025-2030 (%)

12.8 Market opportunity by geography

Market opportunity by geography ($ million)
Data Tables on Market opportunity by geography ($ million)

13. Drivers, Challenges, and Opportunity

13.1 Market drivers

Increasing complexity of global supply chains and multi-modal logistics.
Digital transformation and adoption of AI
Regulatory compliance and sustainability reporting mandates.

13.2 Market challenges

Fragmentation of data formats and interoperability hurdles
Intensifying cybersecurity threats and stringent data protection mandates.
Escalating Geo-political volatility and dynamic trade regulations

13.3 Impact of drivers and challenges

Impact of drivers and challenges in 2025 and 2030

13.4 Market opportunities

Integration of environmental metrics and carbon accounting within audit lifecycle
Adoption of blockchain technology and smart contracts for automated settlement
Expansion of predictive analytics and prescriptive logistics insights

14. Competitive Landscape

14.1 Overview

14.2

Overview on criticality of inputs and factors of differentiation

14.3 Landscape disruption

Overview on factors of disruption

14.4 Industry risks

Impact of key risks on business

15. Competitive Analysis

15.1 Companies profiled

Companies covered

15.2 Company ranking index

15.3 Market positioning of companies

Matrix on companies position and classification

15.4 Blue Yonder Group Inc.

Blue Yonder Group Inc. - Overview
Blue Yonder Group Inc. - Product / Service
Blue Yonder Group Inc. - Key offerings
SWOT

15.5 Cass Information Systems Inc.

Cass Information Systems Inc. - Overview
Cass Information Systems Inc. - Product / Service
Cass Information Systems Inc. - Key offerings
SWOT

15.6 Continental Traffic Service Inc.

Continental Traffic Service Inc. - Overview
Continental Traffic Service Inc. - Product / Service
Continental Traffic Service Inc. - Key offerings
SWOT

15.7 Data2Logistics LLC

Data2Logistics LLC - Overview
Data2Logistics LLC - Product / Service
Data2Logistics LLC - Key offerings
SWOT

15.8 Enveyo

Enveyo - Overview
Enveyo - Product / Service
Enveyo - Key offerings
SWOT

15.9 Fortigo Inc.

Fortigo Inc. - Overview
Fortigo Inc. - Product / Service
Fortigo Inc. - Key offerings
SWOT

15.10 IBM Corp.

IBM Corp. - Overview
IBM Corp. - Business segments
IBM Corp. - Key news
IBM Corp. - Key offerings
IBM Corp. - Segment focus
SWOT

15.11 Intelligent Audit

Intelligent Audit - Overview
Intelligent Audit - Product / Service
Intelligent Audit - Key offerings
SWOT

15.12 National Traffic Services

National Traffic Services - Overview
National Traffic Services - Product / Service
National Traffic Services - Key offerings
SWOT

15.13 nVision Global

nVision Global - Overview
nVision Global - Product / Service
nVision Global - Key offerings
SWOT

15.14 RateLinx

RateLinx - Overview
RateLinx - Product / Service
RateLinx - Key offerings
SWOT

15.15 SAP SE

SAP SE - Overview
SAP SE - Business segments
SAP SE - Key news
SAP SE - Key offerings
SAP SE - Segment focus
SWOT

15.16 Trax Group

Trax Group - Overview
Trax Group - Product / Service
Trax Group - Key offerings
SWOT

15.17 U.S. Bancorp

U.S. Bancorp - Overview
U.S. Bancorp - Business segments
U.S. Bancorp - Key offerings
U.S. Bancorp - Segment focus
SWOT

15.18 Uber Freight

Uber Freight - Overview
Uber Freight - Product / Service
Uber Freight - Key offerings
SWOT

16. Appendix

16.1 Scope of the report

Market definition
Objectives
Notes and caveats

16.2 Inclusions and exclusions checklist

Inclusions checklist
Exclusions checklist

16.3 Currency conversion rates for US$

16.4 Research methodology

16.5 Data procurement

Information sources

16.6 Data validation

16.7 Validation techniques employed for market sizing

16.8 Data synthesis

16.9 360 degree market analysis

16.10 List of abbreviations

Research Methodology

Technavio presents a detailed picture of the market by way of study, synthesis, and summation of data from multiple sources. The analysts have presented the various facets of the market with a particular focus on identifying the key industry influencers. The data thus presented is comprehensive, reliable, and the result of extensive research, both primary and secondary.

INFORMATION SOURCES

Primary sources

  • Manufacturers and suppliers
  • Channel partners
  • Industry experts
  • Strategic decision makers

Secondary sources

  • Industry journals and periodicals
  • Government data
  • Financial reports of key industry players
  • Historical data
  • Press releases

DATA ANALYSIS

Data Synthesis

  • Collation of data
  • Estimation of key figures
  • Analysis of derived insights

Data Validation

  • Triangulation with data models
  • Reference against proprietary databases
  • Corroboration with industry experts

REPORT WRITING

Qualitative

  • Market drivers
  • Market challenges
  • Market trends
  • Five forces analysis

Quantitative

  • Market size and forecast
  • Market segmentation
  • Geographical insights
  • Competitive landscape

Interested in this report?

Get your sample now to see our research methodology and insights!

Download Now

Frequently Asked Questions

Freight Audit And Payment market growth will increase by USD 651.2 million during 2026-2030.

The Freight Audit And Payment market is expected to grow at a CAGR of 11.2% during 2026-2030.

Freight Audit And Payment market is segmented by Business segment (Large enterprises, Small and medium enterprises) Application (Road freight, Ocean freight, Air freight, Rail freight) End-user (Retail and e-commerce, Manufacturing, Food and beverage, Healthcare, Others)

A3 Freight Payment, Blue Yonder Group Inc., Cass Information Systems Inc., Continental Traffic Service Inc., Data2Logistics LLC, Enveyo, Fortigo Inc., IBM Corp., Intelligent Audit, Kuehne Nagel Management AG, LCC Automation, National Traffic Services, nVision Global, RateLinx, SAP SE, Shipwell, Translogistics Inc, Trax Group, U.S. Bancorp, Uber Freight are a few of the key vendors in the Freight Audit And Payment market.

North America will register the highest growth rate of 38.4% among the other regions. Therefore, the Freight Audit And Payment market in North America is expected to garner significant business opportunities for the vendors during the forecast period.

US, Canada, Mexico, Germany, UK, France, Italy, The Netherlands, Spain, China, Japan, India, South Korea, Australia, Indonesia, Saudi Arabia, UAE, South Africa, Israel, Turkey, Brazil, Argentina, Colombia

  • Increasing complexity of global supply chains and multi-modal logistics. is the driving factor this market.

The Freight Audit And Payment market vendors should focus on grabbing business opportunities from the Business segment segment as it accounted for the largest market share in the base year.
RIA - Research AI Assistant
Ask RIA