Friction Products Market Analysis, Size, and Forecast 2026-2030: APAC (China, Japan, and India), Europe (Germany, UK, and France), North America (US, Canada, and Mexico), Middle East and Africa (Saudi Arabia, UAE, and South Africa), South America (Brazil and Argentina), and Rest of World (ROW)

Friction Products Market Analysis, Size, and Forecast 2026-2030:
APAC (China, Japan, and India), Europe (Germany, UK, and France), North America (US, Canada, and Mexico), Middle East and Africa (Saudi Arabia, UAE, and South Africa), South America (Brazil and Argentina), and Rest of World (ROW)

Published: Dec 2025 294 Pages SKU: IRTNTR44519

Market Overview at a Glance

$10.13 B
Market Opportunity
5.9%
CAGR 2025 - 2030
45.3%
APAC Growth
$16.08 B
Automotive segment 2024

Friction Products Market Size 2026-2030

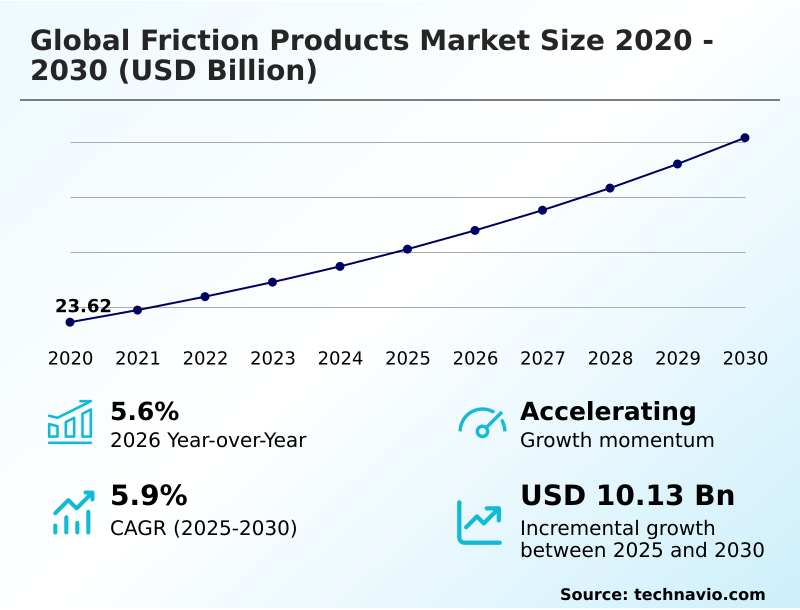
The friction products market size is valued to increase by USD 10.13 billion, at a CAGR of 5.9% from 2025 to 2030. Aging fleet of automobiles will drive the friction products market.

Major Market Trends & Insights

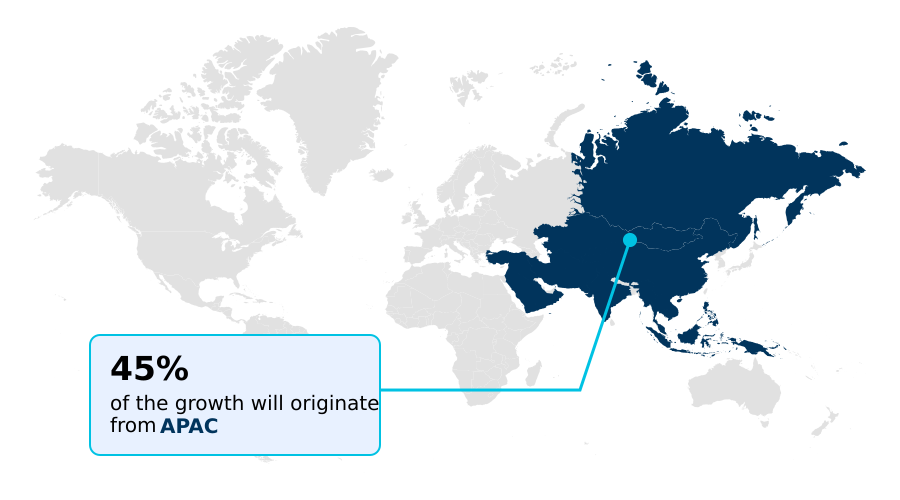
  • APAC dominated the market and accounted for a 45.3% growth during the forecast period.
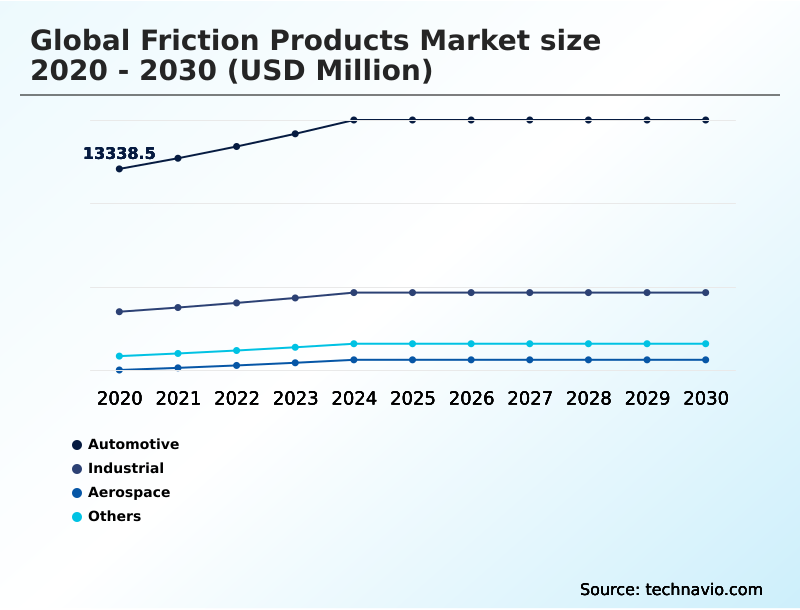
  • By Product - Automotive segment was valued at USD 16.08 billion in 2024
  • By Material Type - Organic segment accounted for the largest market revenue share in 2024

Market Size & Forecast

  • Market Opportunities: USD 16.77 billion
  • Market Future Opportunities: USD 10.13 billion
  • CAGR from 2025 to 2030 : 5.9%

Market Summary

  • The friction products market is integral to safety and operational efficiency across the automotive, aerospace, and industrial sectors. Growth is propelled by an aging global vehicle fleet, which sustains robust demand for aftermarket components, and the continuous procurement of new aircraft requiring advanced braking technologies.
  • A primary trend involves the shift toward lightweight and eco-friendly friction materials, including ceramic and non-asbestos organic formulations, to meet stringent environmental regulations and improve vehicle fuel efficiency. Innovations in material science are enhancing durability, thermal stability, and performance, addressing the demands of high-performance vehicles and electric powertrains with regenerative braking systems.
  • For instance, a logistics company can optimize its fleet's total cost of ownership by adopting advanced brake pads that extend service intervals, reducing vehicle downtime and maintenance expenses. However, the market faces challenges from the proliferation of counterfeit products, which threaten revenue streams and brand integrity, alongside slowdowns in manufacturing operations that can disrupt supply chains.

What will be the Size of the Friction Products Market during the forecast period?

Get Key Insights on Market Forecast (PDF) Request Free Sample

How is the Friction Products Market Segmented?

The friction products industry research report provides comprehensive data (region-wise segment analysis), with forecasts and estimates in "USD million" for the period 2026-2030, as well as historical data from 2020-2024 for the following segments.

  • Product
    • Automotive
    • Industrial
    • Aerospace
    • Others
  • Material type
    • Organic
    • Metallic
    • Ceramic
  • Distribution channel
    • Offline
    • Online
  • Geography
    • APAC
      • China
      • Japan
      • India
    • Europe
      • Germany
      • UK
      • France
    • North America
      • US
      • Canada
      • Mexico
    • Middle East and Africa
      • Saudi Arabia
      • UAE
      • South Africa
    • South America
      • Brazil
      • Argentina
    • Rest of World (ROW)

By Product Insights

The automotive segment is estimated to witness significant growth during the forecast period.

The automotive segment remains a critical application area, driven by the need for effective motion control systems in passenger and commercial vehicles.

Demand is reinforced by stringent safety regulations mandating advanced technologies and a robust aftermarket serving an aging global fleet.

The transition to electric and hybrid vehicles introduces new requirements for specialized friction materials that can withstand the unique thermal and mechanical stresses of regenerative braking compatibility.

Consequently, there is a focus on brake pad formulations and lightweight braking materials to enhance performance.

These advancements are critical as the automotive sector contributes over 45% of the market's incremental growth, compelling manufacturers to innovate with durable friction components that meet both performance and regulatory standards.

Request Free Sample

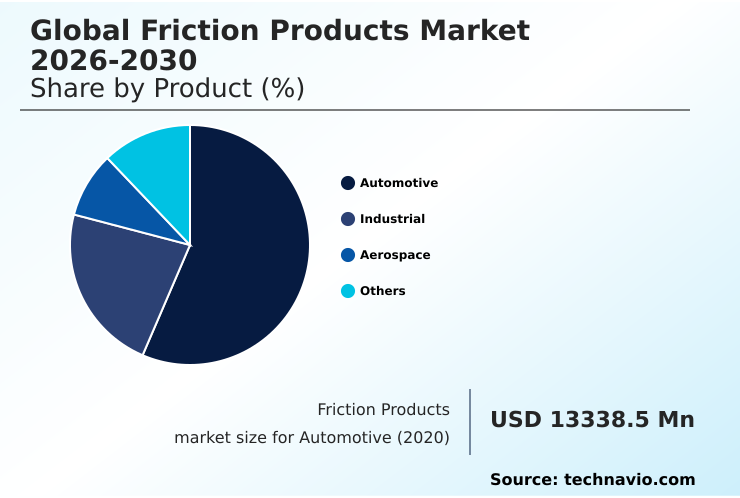
The Automotive segment was valued at USD 16.08 billion in 2024 and showed a gradual increase during the forecast period.

Request Free Sample

Regional Analysis

APAC is estimated to contribute 45.3% to the growth of the global market during the forecast period.Technavio’s analysts have elaborately explained the regional trends and drivers that shape the market during the forecast period.

See How Friction Products Market Demand is Rising in APAC Request Free Sample

The geographic landscape of the market is characterized by diverse regional growth dynamics. APAC is set to dominate, projected to account for over 45% of the market's incremental growth, driven by its expanding automotive manufacturing base and industrialization.

The region's market is expanding at a rate approximately 1% higher than Europe, which remains a key market due to its stringent regulatory standards and focus on aerospace braking technology and advanced material adoption.

North America is driven by a large vehicle parc and a strong aftermarket. The region's focus on high-performance clutches and commercial vehicle braking solutions ensures steady demand.

In contrast, emerging markets in South America and the Middle East and Africa show potential, fueled by infrastructure development and a growing need for industrial brake linings.

Market Dynamics

Our researchers analyzed the data with 2025 as the base year, along with the key drivers, trends, and challenges. A holistic analysis of drivers will help companies refine their marketing strategies to gain a competitive advantage.

  • Strategic decision-making in the friction products market requires a deep understanding of material science and application-specific performance. Evaluating the high temperature stability in ceramic brake pads is critical for luxury and performance vehicle segments, where minimizing brake fade is paramount.
  • Concurrently, manufacturers must address the impact of regenerative braking on friction material, a key challenge in the rapidly expanding electric vehicle sector. This has accelerated R&D into lightweight materials for automotive brake systems, which contributes to overall vehicle efficiency. A major industry-wide effort involves developing copper-free materials for environmental regulations, forcing a re-evaluation of traditional formulations.
  • Comparative analysis of the wear characteristics of metallic vs. organic pads continues to inform choices for both OEM and aftermarket segments. For heavy-duty applications, friction product solutions for industrial machinery must ensure reliability under extreme loads, while advanced friction materials for aerospace applications must meet unparalleled safety standards.
  • In the consumer-facing automotive sector, noise reduction techniques in automotive braking are a key differentiator. The push for sustainability is promoting eco-friendly friction materials for commercial vehicles, while durability testing for heavy-duty brake linings ensures operational safety in logistics. The performance of carbon-ceramic brakes in sports cars sets a benchmark, highlighting the importance of friction coefficient consistency under varying loads.
  • For the aftermarket, balancing brake pad quality vs. OEM specifications is a constant focus. Other niche areas include sintered metal brake pads for motorcycles and improving wet braking performance of NAO pads. The role of phenolic resins in brake pad formulation remains crucial for structural integrity, alongside innovations in thermal management in high-performance braking.
  • Finally, reducing brake dust from metallic pads and advancements in powder metallurgy for friction parts are key to meeting both consumer expectations and environmental mandates, including challenges in braking systems for electric aircraft.

What are the key market drivers leading to the rise in the adoption of Friction Products Industry?

  • A key market driver is the aging global fleet of automobiles, which fuels consistent demand for aftermarket friction products.

  • Key drivers propelling the market include the aging global vehicle fleet and increasing aircraft procurement, which sustain demand for both aftermarket brake components and advanced original equipment friction products.
  • The continuous need for brake system maintenance fuels a steady revenue stream. Innovations in brake lining composition are critical, with new formulations improving component lifespan by over 20% in certain applications.
  • This drive for longevity and performance is also seen in the development of materials with a stable friction coefficient and high wear resistance.
  • For instance, the use of aramid fiber reinforcement in non-asbestos organic materials has resulted in a 15% reduction in warranty claims for some manufacturers, underscoring the business impact of material science advancements.

What are the market trends shaping the Friction Products Industry?

  • The development of high-performance adaptive braking systems is an upcoming market trend. This innovation is setting new standards for future automotive braking technology.

  • The market is witnessing a significant trend toward the development of high-performance adaptive braking systems and the adoption of lightweight materials. Innovations in brake pad materials and clutch facing technology are central, with a focus on enhancing wet braking performance and brake fade resistance.
  • The integration of advanced composites has been shown to improve thermal dissipation by up to 25%, a critical factor for performance vehicles. Furthermore, the push for sustainability is accelerating the development of eco-friendly friction materials and copper-free brake pads.
  • These advancements in brake disc metallurgy and powder metallurgy processes are enabling manufacturers to create products with superior durability and reduced environmental impact, meeting both regulatory demands and consumer expectations for quieter, more efficient braking.

What challenges does the Friction Products Industry face during its growth?

  • The increasing availability of counterfeit products presents a significant challenge to market growth, impacting revenue and brand reputation for legitimate manufacturers.

  • The market grapples with significant challenges, including the proliferation of counterfeit products and slowdowns in manufacturing operations, which disrupt supply chains for automotive friction components and industrial brake linings. The need to comply with evolving regulations for heavy-duty friction materials adds complexity, often increasing production costs.
  • The integration of advanced features into motion control systems, such as brake system wear indicators, requires higher R&D investment. For example, ensuring regenerative braking compatibility in new brake pad formulations can extend development timelines by up to 30%.
  • Furthermore, managing the thermal stability of components under high-energy braking conditions while controlling noise, vibration, and harshness remains a persistent engineering challenge for railway brake blocks and marine clutch systems.

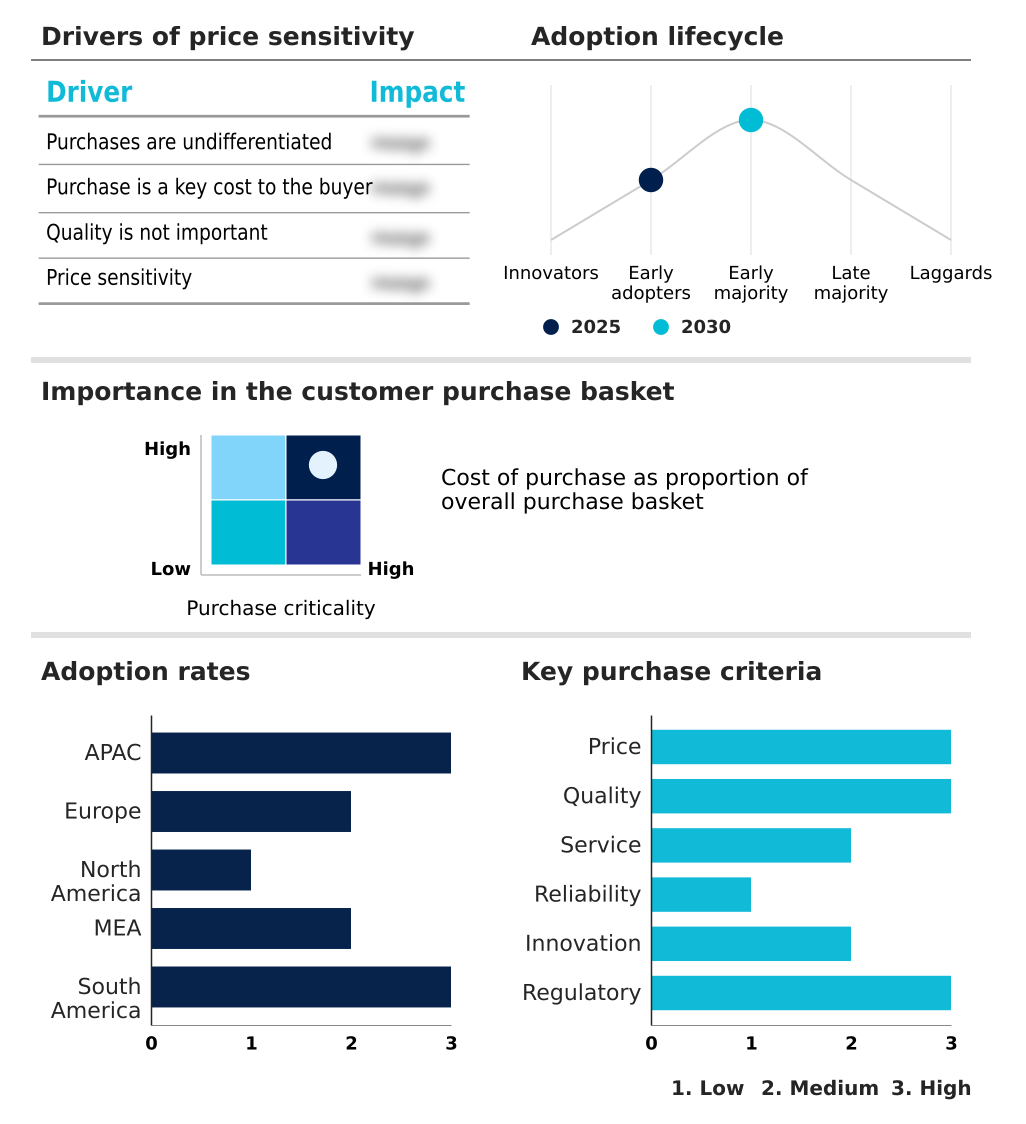
Exclusive Technavio Analysis on Customer Landscape

The friction products market forecasting report includes the adoption lifecycle of the market, covering from the innovator’s stage to the laggard’s stage. It focuses on adoption rates in different regions based on penetration. Furthermore, the friction products market report also includes key purchase criteria and drivers of price sensitivity to help companies evaluate and develop their market growth analysis strategies.

Customer Landscape of Friction Products Industry

Competitive Landscape

Companies are implementing various strategies, such as strategic alliances, friction products market forecast, partnerships, mergers and acquisitions, geographical expansion, and product/service launches, to enhance their presence in the industry.

ABS Friction Inc. - Key offerings include advanced friction solutions, such as high-performance brake pads and shoes, designed for diverse automotive applications.

The industry research and growth report includes detailed analyses of the competitive landscape of the market and information about key companies, including:

  • ABS Friction Inc.
  • AISIN Corp.
  • Akebono Brake Industry Co.
  • ANAND Group
  • ASK Automotive Ltd.
  • Brembo Spa
  • BREMSKERL Group
  • Carlisle Co. Inc.
  • EBC Brakes
  • General Metals Powder Co.
  • Hindustan Composites Ltd.
  • Honeywell International Inc.
  • Icer Brakes SA
  • ITT Inc.
  • Knorr Bremse AG
  • LUMAG Sp. z o.o.
  • Miba AG
  • Nisshinbo Holdings Inc.
  • Robert Bosch GmbH
  • Tenneco Inc.

Qualitative and quantitative analysis of companies has been conducted to help clients understand the wider business environment as well as the strengths and weaknesses of key industry players. Data is qualitatively analyzed to categorize companies as pure play, category-focused, industry-focused, and diversified; it is quantitatively analyzed to categorize companies as dominant, leading, strong, tentative, and weak.

Recent Development and News in Friction products market

  • In September 2024, Brembo Spa announced the launch of its new 'Greenance Kit,' a line of copper-free brake pads with advanced eco-friendly friction materials, designed to reduce particulate emissions by over 50% for both internal combustion and electric vehicles.
  • In November 2024, Robert Bosch GmbH revealed a strategic partnership with a leading European automaker to co-develop a next-generation high-performance adaptive braking system integrated with AI-driven predictive maintenance capabilities for improved safety and reliability.
  • In February 2025, ITT Inc. completed its acquisition of a specialized German firm known for its innovations in carbon-ceramic composites, aiming to expand its portfolio of lightweight, high-thermal-stability friction products for the aerospace and high-performance automotive sectors.
  • In May 2025, Akebono Brake Industry Co. announced a major expansion of its North American production facility to increase capacity for its advanced electric vehicle brake pads, which feature enhanced noise, vibration, and harshness (NVH) properties.

Dive into Technavio’s robust research methodology, blending expert interviews, extensive data synthesis, and validated models for unparalleled Friction Products Market insights. See full methodology.

Market Scope
Page number 294
Base year 2025
Historic period 2020-2024
Forecast period 2026-2030
Growth momentum & CAGR Accelerate at a CAGR of 5.9%
Market growth 2026-2030 USD 10130.3 million
Market structure Fragmented
YoY growth 2025-2026(%) 5.6%
Key countries China, Japan, India, South Korea, Australia, Indonesia, Germany, UK, France, Italy, Spain, The Netherlands, US, Canada, Mexico, Saudi Arabia, UAE, South Africa, Turkey, Israel, Brazil, Argentina and Chile
Competitive landscape Leading Companies, Market Positioning of Companies, Competitive Strategies, and Industry Risks

Request Free Sample

Research Analyst Overview

  • The friction products market is undergoing a significant transformation driven by advancements in material science and evolving end-user requirements. The emphasis is on developing components that offer superior wear resistance and thermal conductivity. For boardroom-level strategy, the push toward regenerative braking compatibility is a critical consideration, directly impacting R&D budgets and future product roadmaps.
  • This trend requires a pivot from traditional brake lining composition to advanced materials capable of withstanding different operational stresses. Innovations like high-performance adaptive braking and hydraulic dual-circuit systems are becoming standard. A key performance metric shows that advanced carbon-ceramic composites can improve brake fade resistance by up to 30% in high-demand scenarios compared to conventional materials.
  • The industry is also focused on improving wet braking performance and managing noise, vibration, and harshness. The adoption of eco-friendly friction materials, including copper-free brake pads and non-asbestos organic materials, is driven by regulations, while sintered brake pads and clutch facing technology are advancing in specialized applications.
  • The underlying science, from aramid fiber reinforcement and phenolic resin binders to brake disc metallurgy and powder metallurgy processes, continues to define the competitive landscape, emphasizing the need for materials with high thermal stability and consistent friction coefficient for high-energy braking scenarios.

What are the Key Data Covered in this Friction Products Market Research and Growth Report?

  • What is the expected growth of the Friction Products Market between 2026 and 2030?

    • USD 10.13 billion, at a CAGR of 5.9%

  • What segmentation does the market report cover?

    • The report is segmented by Product (Automotive, Industrial, Aerospace, and Others), Material Type (Organic, Metallic, and Ceramic), Distribution Channel (Offline, and Online) and Geography (APAC, Europe, North America, Middle East and Africa, South America)

  • Which regions are analyzed in the report?

    • APAC, Europe, North America, Middle East and Africa and South America

  • What are the key growth drivers and market challenges?

    • Aging fleet of automobiles, Increasing availability of counterfeit products

  • Who are the major players in the Friction Products Market?

    • ABS Friction Inc., AISIN Corp., Akebono Brake Industry Co., ANAND Group, ASK Automotive Ltd., Brembo Spa, BREMSKERL Group, Carlisle Co. Inc., EBC Brakes, General Metals Powder Co., Hindustan Composites Ltd., Honeywell International Inc., Icer Brakes SA, ITT Inc., Knorr Bremse AG, LUMAG Sp. z o.o., Miba AG, Nisshinbo Holdings Inc., Robert Bosch GmbH and Tenneco Inc.

Market Research Insights

  • Market dynamics are increasingly shaped by the demand for advanced composite brakes and high-performance clutches, particularly in performance vehicle braking and commercial vehicle braking solutions. The integration of brake system wear indicators is becoming standard, improving brake system maintenance protocols.
  • This shift toward higher-value original equipment friction products is evident, as their adoption has been shown to reduce component failure rates by up to 25%. Concurrently, the aftermarket brake components segment remains robust, driven by the need for cost-effective yet reliable replacements.
  • Suppliers that balance both OE and aftermarket demands are better positioned, especially as innovations tailored for electric vehicle brake pads now account for a growing share of R&D investment, with some advanced formulations reducing wear by 15% in urban driving cycles.

We can help! Our analysts can customize this friction products market research report to meet your requirements.

Get in touch

1. Executive Summary

1.1 Market overview

Executive Summary - Chart on Market Overview
Executive Summary - Data Table on Market Overview
Executive Summary - Chart on Global Market Characteristics
Executive Summary - Chart on Market by Geography
Executive Summary - Chart on Market Segmentation by Product
Executive Summary - Chart on Market Segmentation by Material Type
Executive Summary - Chart on Market Segmentation by Distribution Channel
Executive Summary - Chart on Incremental Growth
Executive Summary - Data Table on Incremental Growth
Executive Summary - Chart on Company Market Positioning

2. Technavio Analysis

2.1 Analysis of price sensitivity, lifecycle, customer purchase basket, adoption rates, and purchase criteria

2.2 Criticality of inputs and Factors of differentiation

Chart on Overview on criticality of inputs and factors of differentiation

2.3 Factors of disruption

Chart on Overview on factors of disruption

2.4 Impact of drivers and challenges

Chart on Impact of drivers and challenges in 2025 and 2030

3. Market Landscape

3.1 Market ecosystem

Chart on Parent Market
Data Table on - Parent Market

3.2 Market characteristics

Chart on Market characteristics analysis

3.3 Value chain analysis

Chart on Value chain analysis

4. Market Sizing

4.1 Market definition

Data Table on Offerings of companies included in the market definition

4.2 Market segment analysis

Market segments

4.3 Market size 2025

4.4 Market outlook: Forecast for 2025-2030

Chart on Global - Market size and forecast 2025-2030 ($ million)
Data Table on Global - Market size and forecast 2025-2030 ($ million)
Chart on Global Market: Year-over-year growth 2025-2030 (%)
Data Table on Global Market: Year-over-year growth 2025-2030 (%)

5. Historic Market Size

5.1 Global Friction Products Market 2020 - 2024

Historic Market Size - Data Table on Global Friction Products Market 2020 - 2024 ($ million)

5.2 Product segment analysis 2020 - 2024

Historic Market Size - Product Segment 2020 - 2024 ($ million)

5.3 Material Type segment analysis 2020 - 2024

Historic Market Size - Material Type Segment 2020 - 2024 ($ million)

5.4 Distribution Channel segment analysis 2020 - 2024

Historic Market Size - Distribution Channel Segment 2020 - 2024 ($ million)

5.5 Geography segment analysis 2020 - 2024

Historic Market Size - Geography Segment 2020 - 2024 ($ million)

5.6 Country segment analysis 2020 - 2024

Historic Market Size - Country Segment 2020 - 2024 ($ million)

6. Qualitative Analysis

6.1 The AI impact on Global Friction Products Market

7. Five Forces Analysis

7.1 Five forces summary

Five forces analysis - Comparison between 2025 and 2030

7.2 Bargaining power of buyers

Bargaining power of buyers - Impact of key factors 2025 and 2030

7.3 Bargaining power of suppliers

Bargaining power of suppliers - Impact of key factors in 2025 and 2030

7.4 Threat of new entrants

Threat of new entrants - Impact of key factors in 2025 and 2030

7.5 Threat of substitutes

Threat of substitutes - Impact of key factors in 2025 and 2030

7.6 Threat of rivalry

Threat of rivalry - Impact of key factors in 2025 and 2030

7.7 Market condition

Chart on Market condition - Five forces 2025 and 2030

8. Market Segmentation by Product

8.1 Market segments

Chart on Product - Market share 2025-2030 (%)
Data Table on Product - Market share 2025-2030 (%)

8.2 Comparison by Product

Chart on Comparison by Product
Data Table on Comparison by Product

8.3 Automotive - Market size and forecast 2025-2030

Chart on Automotive - Market size and forecast 2025-2030 ($ million)
Data Table on Automotive - Market size and forecast 2025-2030 ($ million)
Chart on Automotive - Year-over-year growth 2025-2030 (%)
Data Table on Automotive - Year-over-year growth 2025-2030 (%)

8.4 Industrial - Market size and forecast 2025-2030

Chart on Industrial - Market size and forecast 2025-2030 ($ million)
Data Table on Industrial - Market size and forecast 2025-2030 ($ million)
Chart on Industrial - Year-over-year growth 2025-2030 (%)
Data Table on Industrial - Year-over-year growth 2025-2030 (%)

8.5 Aerospace - Market size and forecast 2025-2030

Chart on Aerospace - Market size and forecast 2025-2030 ($ million)
Data Table on Aerospace - Market size and forecast 2025-2030 ($ million)
Chart on Aerospace - Year-over-year growth 2025-2030 (%)
Data Table on Aerospace - Year-over-year growth 2025-2030 (%)

8.6 Others - Market size and forecast 2025-2030

Chart on Others - Market size and forecast 2025-2030 ($ million)
Data Table on Others - Market size and forecast 2025-2030 ($ million)
Chart on Others - Year-over-year growth 2025-2030 (%)
Data Table on Others - Year-over-year growth 2025-2030 (%)

8.7 Market opportunity by Product

Market opportunity by Product ($ million)
Data Table on Market opportunity by Product ($ million)

9. Market Segmentation by Material Type

9.1 Market segments

Chart on Market Segmentation by Material Type - Market share 2025-2030 (%)
Data Table on Market Segmentation by Material Type - Market share 2025-2030 (%)

9.2 Comparison by Market Segmentation by Material Type

Chart on Comparison by Market Segmentation by Material Type
Data Table on Comparison by Market Segmentation by Material Type

9.3 Organic - Market size and forecast 2025-2030

Chart on Organic - Market size and forecast 2025-2030 ($ million)
Data Table on Organic - Market size and forecast 2025-2030 ($ million)
Chart on Organic - Year-over-year growth 2025-2030 (%)
Data Table on Organic - Year-over-year growth 2025-2030 (%)

9.4 Metallic - Market size and forecast 2025-2030

Chart on Metallic - Market size and forecast 2025-2030 ($ million)
Data Table on Metallic - Market size and forecast 2025-2030 ($ million)
Chart on Metallic - Year-over-year growth 2025-2030 (%)
Data Table on Metallic - Year-over-year growth 2025-2030 (%)

9.5 Ceramic - Market size and forecast 2025-2030

Chart on Ceramic - Market size and forecast 2025-2030 ($ million)
Data Table on Ceramic - Market size and forecast 2025-2030 ($ million)
Chart on Ceramic - Year-over-year growth 2025-2030 (%)
Data Table on Ceramic - Year-over-year growth 2025-2030 (%)

9.6 Market opportunity by Market Segmentation by Material Type

Market opportunity by Market Segmentation by Material Type ($ million)
Data Table on Market opportunity by Market Segmentation by Material Type ($ million)

10. Market Segmentation by Distribution Channel

10.1 Market segments

Chart on Distribution Channel - Market share 2025-2030 (%)
Data Table on Distribution Channel - Market share 2025-2030 (%)

10.2 Comparison by Distribution Channel

Chart on Comparison by Distribution Channel
Data Table on Comparison by Distribution Channel

10.3 Offline - Market size and forecast 2025-2030

Chart on Offline - Market size and forecast 2025-2030 ($ million)
Data Table on Offline - Market size and forecast 2025-2030 ($ million)
Chart on Offline - Year-over-year growth 2025-2030 (%)
Data Table on Offline - Year-over-year growth 2025-2030 (%)

10.4 Online - Market size and forecast 2025-2030

Chart on Online - Market size and forecast 2025-2030 ($ million)
Data Table on Online - Market size and forecast 2025-2030 ($ million)
Chart on Online - Year-over-year growth 2025-2030 (%)
Data Table on Online - Year-over-year growth 2025-2030 (%)

10.5 Market opportunity by Distribution Channel

Market opportunity by Distribution Channel ($ million)
Data Table on Market opportunity by Distribution Channel ($ million)

11. Customer Landscape

11.1 Customer landscape overview

Analysis of price sensitivity, lifecycle, customer purchase basket, adoption rates, and purchase criteria

12. Geographic Landscape

12.1 Geographic segmentation

Chart on Market share by geography 2025-2030 (%)
Data Table on Market share by geography 2025-2030 (%)

12.2 Geographic comparison

Chart on Geographic comparison
Data Table on Geographic comparison

12.3 APAC - Market size and forecast 2025-2030

Chart on APAC - Market size and forecast 2025-2030 ($ million)
Data Table on APAC - Market size and forecast 2025-2030 ($ million)
Chart on APAC - Year-over-year growth 2025-2030 (%)
Data Table on APAC - Year-over-year growth 2025-2030 (%)
Chart on Regional Comparison - APAC
Data Table on Regional Comparison - APAC

12.3.1 China - Market size and forecast 2025-2030

Chart on China - Market size and forecast 2025-2030 ($ million)
Data Table on China - Market size and forecast 2025-2030 ($ million)
Chart on China - Year-over-year growth 2025-2030 (%)
Data Table on China - Year-over-year growth 2025-2030 (%)

12.3.2 Japan - Market size and forecast 2025-2030

Chart on Japan - Market size and forecast 2025-2030 ($ million)
Data Table on Japan - Market size and forecast 2025-2030 ($ million)
Chart on Japan - Year-over-year growth 2025-2030 (%)
Data Table on Japan - Year-over-year growth 2025-2030 (%)

12.3.3 India - Market size and forecast 2025-2030

Chart on India - Market size and forecast 2025-2030 ($ million)
Data Table on India - Market size and forecast 2025-2030 ($ million)
Chart on India - Year-over-year growth 2025-2030 (%)
Data Table on India - Year-over-year growth 2025-2030 (%)

12.3.4 South Korea - Market size and forecast 2025-2030

Chart on South Korea - Market size and forecast 2025-2030 ($ million)
Data Table on South Korea - Market size and forecast 2025-2030 ($ million)
Chart on South Korea - Year-over-year growth 2025-2030 (%)
Data Table on South Korea - Year-over-year growth 2025-2030 (%)

12.3.5 Australia - Market size and forecast 2025-2030

Chart on Australia - Market size and forecast 2025-2030 ($ million)
Data Table on Australia - Market size and forecast 2025-2030 ($ million)
Chart on Australia - Year-over-year growth 2025-2030 (%)
Data Table on Australia - Year-over-year growth 2025-2030 (%)

12.3.6 Indonesia - Market size and forecast 2025-2030

Chart on Indonesia - Market size and forecast 2025-2030 ($ million)
Data Table on Indonesia - Market size and forecast 2025-2030 ($ million)
Chart on Indonesia - Year-over-year growth 2025-2030 (%)
Data Table on Indonesia - Year-over-year growth 2025-2030 (%)

12.4 Europe - Market size and forecast 2025-2030

Chart on Europe - Market size and forecast 2025-2030 ($ million)
Data Table on Europe - Market size and forecast 2025-2030 ($ million)
Chart on Europe - Year-over-year growth 2025-2030 (%)
Data Table on Europe - Year-over-year growth 2025-2030 (%)
Chart on Regional Comparison - Europe
Data Table on Regional Comparison - Europe

12.4.1 Germany - Market size and forecast 2025-2030

Chart on Germany - Market size and forecast 2025-2030 ($ million)
Data Table on Germany - Market size and forecast 2025-2030 ($ million)
Chart on Germany - Year-over-year growth 2025-2030 (%)
Data Table on Germany - Year-over-year growth 2025-2030 (%)

12.4.2 UK - Market size and forecast 2025-2030

Chart on UK - Market size and forecast 2025-2030 ($ million)
Data Table on UK - Market size and forecast 2025-2030 ($ million)
Chart on UK - Year-over-year growth 2025-2030 (%)
Data Table on UK - Year-over-year growth 2025-2030 (%)

12.4.3 France - Market size and forecast 2025-2030

Chart on France - Market size and forecast 2025-2030 ($ million)
Data Table on France - Market size and forecast 2025-2030 ($ million)
Chart on France - Year-over-year growth 2025-2030 (%)
Data Table on France - Year-over-year growth 2025-2030 (%)

12.4.4 Italy - Market size and forecast 2025-2030

Chart on Italy - Market size and forecast 2025-2030 ($ million)
Data Table on Italy - Market size and forecast 2025-2030 ($ million)
Chart on Italy - Year-over-year growth 2025-2030 (%)
Data Table on Italy - Year-over-year growth 2025-2030 (%)

12.4.5 Spain - Market size and forecast 2025-2030

Chart on Spain - Market size and forecast 2025-2030 ($ million)
Data Table on Spain - Market size and forecast 2025-2030 ($ million)
Chart on Spain - Year-over-year growth 2025-2030 (%)
Data Table on Spain - Year-over-year growth 2025-2030 (%)

12.4.6 The Netherlands - Market size and forecast 2025-2030

Chart on The Netherlands - Market size and forecast 2025-2030 ($ million)
Data Table on The Netherlands - Market size and forecast 2025-2030 ($ million)
Chart on The Netherlands - Year-over-year growth 2025-2030 (%)
Data Table on The Netherlands - Year-over-year growth 2025-2030 (%)

12.5 North America - Market size and forecast 2025-2030

Chart on North America - Market size and forecast 2025-2030 ($ million)
Data Table on North America - Market size and forecast 2025-2030 ($ million)
Chart on North America - Year-over-year growth 2025-2030 (%)
Data Table on North America - Year-over-year growth 2025-2030 (%)
Chart on Regional Comparison - North America
Data Table on Regional Comparison - North America

12.5.1 US - Market size and forecast 2025-2030

Chart on US - Market size and forecast 2025-2030 ($ million)
Data Table on US - Market size and forecast 2025-2030 ($ million)
Chart on US - Year-over-year growth 2025-2030 (%)
Data Table on US - Year-over-year growth 2025-2030 (%)

12.5.2 Canada - Market size and forecast 2025-2030

Chart on Canada - Market size and forecast 2025-2030 ($ million)
Data Table on Canada - Market size and forecast 2025-2030 ($ million)
Chart on Canada - Year-over-year growth 2025-2030 (%)
Data Table on Canada - Year-over-year growth 2025-2030 (%)

12.5.3 Mexico - Market size and forecast 2025-2030

Chart on Mexico - Market size and forecast 2025-2030 ($ million)
Data Table on Mexico - Market size and forecast 2025-2030 ($ million)
Chart on Mexico - Year-over-year growth 2025-2030 (%)
Data Table on Mexico - Year-over-year growth 2025-2030 (%)

12.6 Middle East and Africa - Market size and forecast 2025-2030

Chart on Middle East and Africa - Market size and forecast 2025-2030 ($ million)
Data Table on Middle East and Africa - Market size and forecast 2025-2030 ($ million)
Chart on Middle East and Africa - Year-over-year growth 2025-2030 (%)
Data Table on Middle East and Africa - Year-over-year growth 2025-2030 (%)
Chart on Regional Comparison - Middle East and Africa
Data Table on Regional Comparison - Middle East and Africa

12.6.1 Saudi Arabia - Market size and forecast 2025-2030

Chart on Saudi Arabia - Market size and forecast 2025-2030 ($ million)
Data Table on Saudi Arabia - Market size and forecast 2025-2030 ($ million)
Chart on Saudi Arabia - Year-over-year growth 2025-2030 (%)
Data Table on Saudi Arabia - Year-over-year growth 2025-2030 (%)

12.6.2 UAE - Market size and forecast 2025-2030

Chart on UAE - Market size and forecast 2025-2030 ($ million)
Data Table on UAE - Market size and forecast 2025-2030 ($ million)
Chart on UAE - Year-over-year growth 2025-2030 (%)
Data Table on UAE - Year-over-year growth 2025-2030 (%)

12.6.3 South Africa - Market size and forecast 2025-2030

Chart on South Africa - Market size and forecast 2025-2030 ($ million)
Data Table on South Africa - Market size and forecast 2025-2030 ($ million)
Chart on South Africa - Year-over-year growth 2025-2030 (%)
Data Table on South Africa - Year-over-year growth 2025-2030 (%)

12.6.4 Turkey - Market size and forecast 2025-2030

Chart on Turkey - Market size and forecast 2025-2030 ($ million)
Data Table on Turkey - Market size and forecast 2025-2030 ($ million)
Chart on Turkey - Year-over-year growth 2025-2030 (%)
Data Table on Turkey - Year-over-year growth 2025-2030 (%)

12.6.5 Israel - Market size and forecast 2025-2030

Chart on Israel - Market size and forecast 2025-2030 ($ million)
Data Table on Israel - Market size and forecast 2025-2030 ($ million)
Chart on Israel - Year-over-year growth 2025-2030 (%)
Data Table on Israel - Year-over-year growth 2025-2030 (%)

12.7 South America - Market size and forecast 2025-2030

Chart on South America - Market size and forecast 2025-2030 ($ million)
Data Table on South America - Market size and forecast 2025-2030 ($ million)
Chart on South America - Year-over-year growth 2025-2030 (%)
Data Table on South America - Year-over-year growth 2025-2030 (%)
Chart on Regional Comparison - South America
Data Table on Regional Comparison - South America

12.7.1 Brazil - Market size and forecast 2025-2030

Chart on Brazil - Market size and forecast 2025-2030 ($ million)
Data Table on Brazil - Market size and forecast 2025-2030 ($ million)
Chart on Brazil - Year-over-year growth 2025-2030 (%)
Data Table on Brazil - Year-over-year growth 2025-2030 (%)

12.7.2 Argentina - Market size and forecast 2025-2030

Chart on Argentina - Market size and forecast 2025-2030 ($ million)
Data Table on Argentina - Market size and forecast 2025-2030 ($ million)
Chart on Argentina - Year-over-year growth 2025-2030 (%)
Data Table on Argentina - Year-over-year growth 2025-2030 (%)

12.7.3 Chile - Market size and forecast 2025-2030

Chart on Chile - Market size and forecast 2025-2030 ($ million)
Data Table on Chile - Market size and forecast 2025-2030 ($ million)
Chart on Chile - Year-over-year growth 2025-2030 (%)
Data Table on Chile - Year-over-year growth 2025-2030 (%)

12.8 Market opportunity by geography

Market opportunity by geography ($ million)
Data Tables on Market opportunity by geography ($ million)

13. Drivers, Challenges, and Opportunity

13.1 Market drivers

Aging fleet of automobiles
Increasing procurement of new aircraft
Improvements in friction material performance

13.2 Market challenges

Increasing availability of counterfeit products
Slowdown in manufacturing operations
Frequent vehicle recalls due to brake-related issues

13.3 Impact of drivers and challenges

Impact of drivers and challenges in 2025 and 2030

13.4 Market opportunities

Development of high-performance adaptive braking systems
Shift toward lightweight braking materials in automotive industry
Growing use of ceramic fiber in manufacturing of friction products

14. Competitive Landscape

14.1 Overview

14.2

Overview on criticality of inputs and factors of differentiation

14.3 Landscape disruption

Overview on factors of disruption

14.4 Industry risks

Impact of key risks on business

15. Competitive Analysis

15.1 Companies profiled

Companies covered

15.2 Company ranking index

15.3 Market positioning of companies

Matrix on companies position and classification

15.4 ABS Friction Inc.

ABS Friction Inc. - Overview
ABS Friction Inc. - Product / Service
ABS Friction Inc. - Key offerings
SWOT

15.5 AISIN Corp.

AISIN Corp. - Overview
AISIN Corp. - Business segments
AISIN Corp. - Key news
AISIN Corp. - Key offerings
AISIN Corp. - Segment focus
SWOT

15.6 Akebono Brake Industry Co.

Akebono Brake Industry Co. - Overview
Akebono Brake Industry Co. - Business segments
Akebono Brake Industry Co. - Key offerings
Akebono Brake Industry Co. - Segment focus
SWOT

15.7 ASK Automotive Ltd.

ASK Automotive Ltd. - Overview
ASK Automotive Ltd. - Product / Service
ASK Automotive Ltd. - Key offerings
SWOT

15.8 Brembo Spa

Brembo Spa - Overview
Brembo Spa - Business segments
Brembo Spa - Key news
Brembo Spa - Key offerings
Brembo Spa - Segment focus
SWOT

15.9 BREMSKERL Group

BREMSKERL Group - Overview
BREMSKERL Group - Product / Service
BREMSKERL Group - Key offerings
SWOT

15.10 Carlisle Co. Inc.

Carlisle Co. Inc. - Overview
Carlisle Co. Inc. - Business segments
Carlisle Co. Inc. - Key news
Carlisle Co. Inc. - Key offerings
Carlisle Co. Inc. - Segment focus
SWOT

15.11 EBC Brakes

EBC Brakes - Overview
EBC Brakes - Product / Service
EBC Brakes - Key offerings
SWOT

15.12 General Metals Powder Co.

General Metals Powder Co. - Overview
General Metals Powder Co. - Product / Service
General Metals Powder Co. - Key offerings
SWOT

15.13 Hindustan Composites Ltd.

Hindustan Composites Ltd. - Overview
Hindustan Composites Ltd. - Product / Service
Hindustan Composites Ltd. - Key offerings
SWOT

15.14 Honeywell International Inc.

Honeywell International Inc. - Overview
Honeywell International Inc. - Business segments
Honeywell International Inc. - Key news
Honeywell International Inc. - Key offerings
Honeywell International Inc. - Segment focus
SWOT

15.15 Icer Brakes SA

Icer Brakes SA - Overview
Icer Brakes SA - Product / Service
Icer Brakes SA - Key offerings
SWOT

15.16 Knorr Bremse AG

Knorr Bremse AG - Overview
Knorr Bremse AG - Business segments
Knorr Bremse AG - Key offerings
Knorr Bremse AG - Segment focus
SWOT

15.17 LUMAG Sp. z o.o.

LUMAG Sp. z o.o. - Overview
LUMAG Sp. z o.o. - Product / Service
LUMAG Sp. z o.o. - Key offerings
SWOT

15.18 Nisshinbo Holdings Inc.

Nisshinbo Holdings Inc. - Overview
Nisshinbo Holdings Inc. - Business segments
Nisshinbo Holdings Inc. - Key offerings
Nisshinbo Holdings Inc. - Segment focus
SWOT

16. Appendix

16.1 Scope of the report

Market definition
Objectives
Notes and caveats

16.2 Inclusions and exclusions checklist

Inclusions checklist
Exclusions checklist

16.3 Currency conversion rates for US$

16.4 Research methodology

16.5 Data procurement

Information sources

16.6 Data validation

16.7 Validation techniques employed for market sizing

16.8 Data synthesis

16.9 360 degree market analysis

16.10 List of abbreviations

Research Methodology

Technavio presents a detailed picture of the market by way of study, synthesis, and summation of data from multiple sources. The analysts have presented the various facets of the market with a particular focus on identifying the key industry influencers. The data thus presented is comprehensive, reliable, and the result of extensive research, both primary and secondary.

INFORMATION SOURCES

Primary sources

  • Manufacturers and suppliers
  • Channel partners
  • Industry experts
  • Strategic decision makers

Secondary sources

  • Industry journals and periodicals
  • Government data
  • Financial reports of key industry players
  • Historical data
  • Press releases

DATA ANALYSIS

Data Synthesis

  • Collation of data
  • Estimation of key figures
  • Analysis of derived insights

Data Validation

  • Triangulation with data models
  • Reference against proprietary databases
  • Corroboration with industry experts

REPORT WRITING

Qualitative

  • Market drivers
  • Market challenges
  • Market trends
  • Five forces analysis

Quantitative

  • Market size and forecast
  • Market segmentation
  • Geographical insights
  • Competitive landscape

Interested in this report?

Get your sample now to see our research methodology and insights!

Download Now

Frequently Asked Questions

Friction Products market growth will increase by USD 10130.3 million during 2026-2030 .

The Friction Products market is expected to grow at a CAGR of 5.9% during 2026-2030 .

Friction Products market is segmented by Product (Automotive, Industrial, Aerospace, Others) Material type (Organic, Metallic, Ceramic) Distribution channel (Offline, Online)

ABS Friction Inc., AISIN Corp., Akebono Brake Industry Co., ANAND Group, ASK Automotive Ltd., Brembo Spa, BREMSKERL Group, Carlisle Co. Inc., EBC Brakes, General Metals Powder Co., Hindustan Composites Ltd., Honeywell International Inc., Icer Brakes SA, ITT Inc., Knorr Bremse AG, LUMAG Sp. z o.o., Miba AG, Nisshinbo Holdings Inc., Robert Bosch GmbH, Tenneco Inc. are a few of the key vendors in the Friction Products market.

APAC will register the highest growth rate of 45.3% among the other regions. Therefore, the Friction Products market in APAC is expected to garner significant business opportunities for the vendors during the forecast period.

China, Japan, India, South Korea, Australia, Indonesia, Germany, UK, France, Italy, Spain, The Netherlands, US, Canada, Mexico, Saudi Arabia, UAE, South Africa, Turkey, Israel, Brazil, Argentina, Chile

  • Aging fleet of automobiles is the driving factor this market.

The Friction Products market vendors should focus on grabbing business opportunities from the Product segment as it accounted for the largest market share in the base year.