Passenger Car Market Analysis APAC, Europe, North America, Middle East and Africa, South America - US, China, India, Japan, Germany - Size and Forecast 2024-2028

Passenger Car Market Analysis APAC, Europe, North America, Middle East and Africa, South America - US, China, India, Japan, Germany - Size and Forecast 2024-2028

Published: Feb 2024 184 Pages SKU: IRTNTR77433

Market Overview at a Glance

$873.26 B
Market Opportunity
7.96%
CAGR
6.34
YoY growth 2023-2024(%)

Passenger Car Market Size 2024-2028

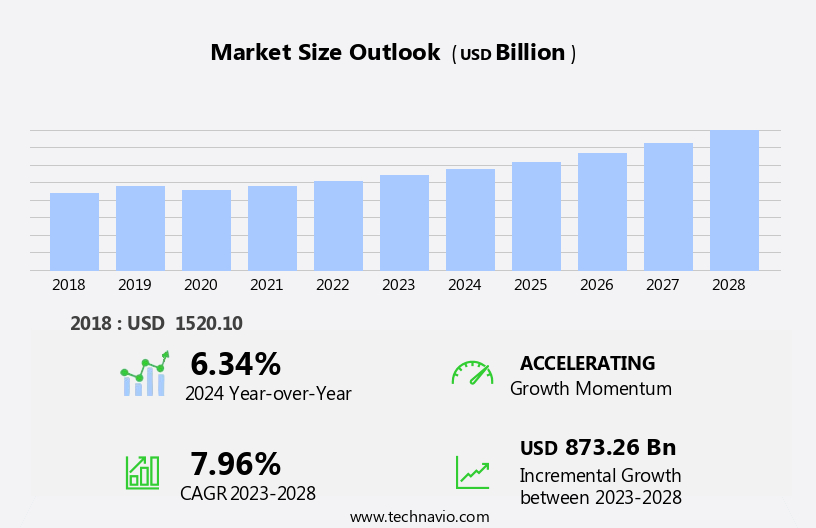
The passenger car market size is forecast to increase by USD 873.26 billion at a CAGR of 7.96% between 2023 and 2028.

  • The market is experiencing significant shifts, driven by the increasing acceptance of electric vehicles (EVs) and the integration of advanced technologies such as 3D printing. The growing preference for sustainable transportation solutions is propelling the adoption of EVs, with governments and consumers alike recognizing their environmental benefits. This trend is expected to continue, as advancements in battery technology and charging infrastructure make EVs increasingly practical and convenient for everyday use. However, the market's growth potential is not without challenges. Regulatory hurdles, including stringent emissions standards and safety regulations, impact adoption and increase production costs. Furthermore, the semiconductor shortage is causing supply chain inconsistencies, leading to production delays and higher prices for automakers.
  • To capitalize on market opportunities and navigate these challenges effectively, companies must stay informed of regulatory developments and invest in diversifying their semiconductor suppliers. Additionally, exploring collaborations with 3D printing technology providers can help streamline production processes and improve overall competitiveness in the market.

What will be the Size of the Passenger Car Market during the forecast period?

Passenger Car Market Size

 Request Free Sample

  • The passenger vehicles industry in the US is experiencing dynamic shifts, with electric propulsion gaining traction among consumers. Middle-income groups are increasingly opting for sustainable mobility solutions, such as electric hatchbacks and compact SUVs, as lifestyle changes and environmental concerns become more prominent. The shift towards electric vehicles (EVs) is driven by various factors, including advancements in technology, charging infrastructure, and applicable taxes. Fuel prices and regulations continue to influence vehicle choices, with the European Union (EU) leading the way in implementing stringent emission norms. Raw material prices for Internal Combustion Engine (ICE) vehicles and the availability of affordable EV batteries further impact market trends.
  • Sedans remain a popular choice, but their market share is dwindling as SUVs gain popularity. Technological developments, such as the Internet of Things (IoT) and EV charging stations, are transforming the industry. General Motors, Chrysler, Hyundai Kona Electric, and other companies are investing in R&D to cater to evolving consumer preferences. The US passenger vehicles industry is witnessing significant growth, particularly in the EV segment. Per capita income plays a crucial role in determining the affordability of various vehicle types. As sustainable practices become increasingly important, the industry is expected to continue adapting to meet the demands of the urban population.

How is this Passenger Car Industry segmented?

The passenger car industry research report provides comprehensive data (region-wise segment analysis), with forecasts and estimates in "USD billion" for the period 2024-2028, as well as historical data from 2018-2022 for the following segments.

  • Type
    • SUV
    • Hatchback
    • Sedan
    • MPV
  • Fuel Type
    • ICE Vehicles
    • Hybrid
    • Electric
  • Geography
    • North America
      • US
    • Europe
      • Germany
    • APAC
      • China
      • India
      • Japan
    • Rest of World (ROW)

By Type Insights

The SUV segment is estimated to witness significant growth during the forecast period.

The market in the US is experiencing dynamic interplay between various entities, shaping its evolution. Combustion engines continue to dominate, offering power and flexibility, while fuel-efficient alternatives, including hybrid and electric vehicles, gain traction due to fuel price volatility and growing environmental concerns. Chrysler and General Motors, among others, innovate with personalized transportation solutions and enhanced features, catering to diverse consumer preferences. Emerging nations' increasing per capita income fuels overall market expansion, with compact SUVs and sedans popular choices for middle-income groups. Technological developments, such as the Internet of Things and advanced safety measures, add value, while regulations and economic challenges pose hurdles.

Electric vehicles (EVs) and electric vehicle batteries are at the forefront of innovation, with Hyundai Kona electric and Volvo's EV leading the charge. Alternative-fuel options, including diesel engines, face competition from EVs and hybrid vehicles. Urban population growth drives sales, with SUVs, hatchbacks, and sedans catering to various lifestyle changes and sustainable practices. Raw material prices and charging infrastructure development are crucial factors influencing the market landscape. The upward trend in sustainable mobility and applicable taxes shape consumer vehicle choices, making the passenger vehicles industry a dynamic and thriving market.

Passenger Car Market Size

 Download Free Sample Report

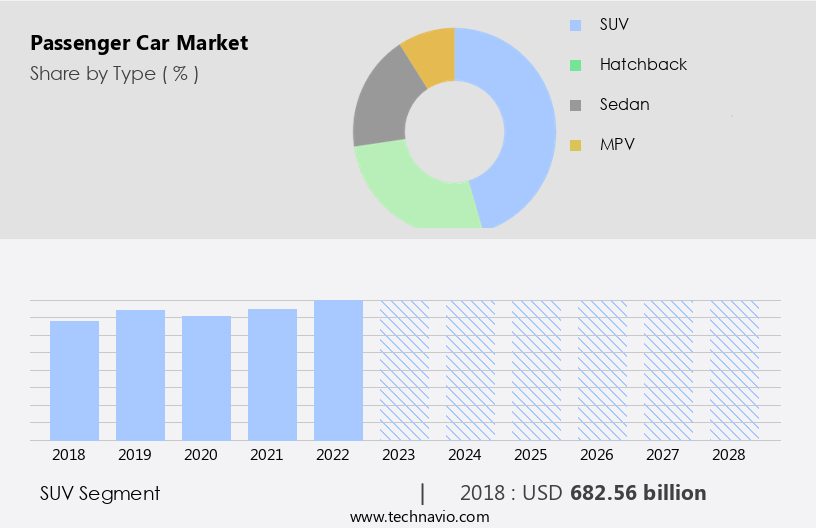
The SUV segment was valued at USD 682.56 billion in 2018 and showed a gradual increase during the forecast period.

Regional Analysis

APAC is estimated to contribute 55% to the growth of the global market during the forecast period.Technavio's analysts have elaborately explained the regional trends and drivers that shape the market during the forecast period.

Passenger Car Market Share by Geography

View Free PDF Sample

The market is experiencing significant growth, driven by various factors. In APAC, the region leads in automobile production and sales, primarily due to the high demand in countries like China, Japan, South Korea, India, and Thailand. China, in particular, dominates the regional market with its vast production and sales numbers. The increasing preference for luxury vehicles in China, Japan, and South Korea further fuels market expansion. Emerging nations, including India and Southeast Asian countries, are poised to contribute substantially to the market's growth in the forecast period. Fuel efficiency and innovation are key trends shaping the market.

Combustion engines continue to be popular, but fuel price volatility has led to the increasing adoption of alternative-fuel options such as hybrids, diesels, and electric vehicles (EVs). Chrysler, General Motors, Hyundai, and Volvo are among the manufacturers investing in EVs and enhancing their offerings with advanced safety measures, Internet of Things connectivity, and personalized transportation features. Environmental concerns have become a significant factor influencing consumer preferences. As a result, sustainable vehicles, including EVs and sustainable mobility solutions, are gaining popularity. Technological developments, such as electric vehicle batteries and automatic transmissions, are driving the upward trend in the EV segment.

Special utility vehicles, compact SUVs, and sedans remain popular vehicle choices for various consumer segments, including middle-income groups. The market landscape is dynamic and thriving, with competition intensifying due to the dynamic interplay of economic challenges, regulations, raw material prices, and charging infrastructure development. Urban population growth and applicable taxes further impact market trends. Despite these challenges, the passenger vehicles industry remains a dynamic and exciting space, with ongoing innovation and lifestyle changes driving sustainable practices.

Market Dynamics

Our researchers analyzed the data with 2023 as the base year, along with the key drivers, trends, and challenges. A holistic analysis of drivers will help companies refine their marketing strategies to gain a competitive advantage.

What are the Passenger Car market drivers leading to the rise in the adoption of Industry?

  • The increasing preference for electric vehicles (EVs) is the primary factor fueling market growth. 
  • The market is experiencing significant innovation, with a focus on fuel-efficient vehicles and advanced safety measures. Combustion engines are being replaced by electric passenger cars, driven by government initiatives to reduce air pollution and volatility in fuel prices. In emerging nations, incentives for electric vehicle (EV) manufacturing are boosting industry growth. EVs offer numerous benefits, including the absence of harmful emissions such as particulates, carbon monoxide, hydrocarbons, and volatile organic compounds.
  • The Internet of Things (IoT) is playing a pivotal role in enhancing vehicle features, offering personalized transportation solutions. Compact SUVs are also gaining popularity due to their fuel efficiency and versatility. Overall market expansion is expected as buyers increasingly demand advanced safety measures and eco-friendly transportation options.

What are the Passenger Car market trends shaping the Industry?

  • The increasing adoption of 3D printing technology in the automotive industry represents a significant market trend. Passenger cars are increasingly utilizing 3D printing for manufacturing components, leading to innovation and potential cost savings.
  • The market is a dynamic and thriving industry, with consumer preferences increasingly leaning towards alternative-fuel options, such as electric vehicles (EVs). This trend is driven by environmental concerns and technological developments. For instance, Hyundai Kona electric and Volvo's EV are gaining popularity. EV charging stations are becoming more common, making it more convenient for consumers to make the switch. Hybrid vehicles and the gradual phase-out of diesel engines are also contributing to this shift. The market landscape is characterized by economic challenges, requiring continuous innovation and cost reduction. 3D printing, with its potential for customization, rapid prototyping, and reduced production time, is poised to revolutionize the industry.
  • Personalized car components, such as custom dashboards and steering wheels, can be printed to cater to individual preferences. Complex geometries and intricate structures, previously difficult to manufacture, become feasible, leading to innovative car designs. On-demand manufacturing of spare parts using 3D printing reduces lead times and inventory costs.

How does Passenger Car market faces challenges face during its growth?

  • The semiconductor shortage poses a significant challenge to the growth of the market, as this essential technology component is in high demand and limited in supply. 
  • The market is currently grappling with the repercussions of the semiconductor shortage, a critical issue affecting the production of vehicles worldwide. This scarcity of microchips, essential for various in-vehicle functions, has compelled automakers to reduce production, leading to a decrease in available cars for sale. The European Union (EU) has been particularly impacted, with the Association of European Vehicle Logistics reporting over 11 million vehicles lost to production cuts due to this crisis in 2021. This situation translates to significant revenue losses and disappointed customers for manufacturers. The semiconductor shortage, which originated in late 2020, has disrupted numerous industries, including automotive manufacturing, due to the vital role semiconductors play in modern vehicles, such as automatic transmissions, charging infrastructure for sustainable vehicles like Electric Vehicles (EVs) and Electric vehicle batteries, and other advanced features.
  • The dynamic interplay between regulations, raw material prices, and technological challenges continues to shape the market, with competition intensifying as manufacturers strive to innovate and meet consumer demands for fuel efficiency, safety, and connectivity.

Exclusive Customer Landscape

The passenger car market forecasting report includes the adoption lifecycle of the market, covering from the innovator's stage to the laggard's stage. It focuses on adoption rates in different regions based on penetration. Furthermore, the passenger car market report also includes key purchase criteria and drivers of price sensitivity to help companies evaluate and develop their market growth analysis strategies.

Passenger Car Market Share by Geography

 Customer Landscape

Key Companies & Market Insights

Companies are implementing various strategies, such as strategic alliances, passenger car market forecast, partnerships, mergers and acquisitions, geographical expansion, and product/service launches, to enhance their presence in the industry.

Aston Martin Lagonda Ltd. - The luxury automobile manufacturer showcases an extensive range of passenger vehicles, including the DBX, DB12, DBS 770 Ultimate, DBS 770 Ultimate Volante, Vantage, and Valour models.

The industry research and growth report includes detailed analyses of the competitive landscape of the market and information about key companies, including:

  • Aston Martin Lagonda Ltd.
  • BMW AG
  • BYD Co. Ltd.
  • Ford Motor Co.
  • Geely Auto International Corp.
  • General Motors Co.
  • Great Wall Motor Co. Ltd.
  • Honda Motor Co. Ltd.
  • Hyundai Motor Co.
  • Mahindra and Mahindra Ltd.
  • Mazda Motor Corp.
  • Mercedes Benz Group AG
  • Renault SAS
  • SAIC Motor Corp. Ltd.
  • Stellantis NV
  • Suzuki Motor Corp.
  • Tata Motors Ltd.
  • Tesla Inc.
  • Toyota Motor Corp.
  • Volkswagen AG

Qualitative and quantitative analysis of companies has been conducted to help clients understand the wider business environment as well as the strengths and weaknesses of key industry players. Data is qualitatively analyzed to categorize companies as pure play, category-focused, industry-focused, and diversified; it is quantitatively analyzed to categorize companies as dominant, leading, strong, tentative, and weak.

Recent Development and News in Passenger Car Market

  • In February 2024, Volkswagen Group and Ford Motor Company announced a strategic partnership to develop commercial vehicles and autonomous vehicles together, aiming to save approximately USD3 billion in costs through the alliance (Volkswagen AG, 2024). This collaboration represents a significant shift in the market, as two major competitors join forces to improve their competitive positions in the rapidly evolving autonomous vehicle sector.
  • In May 2025, Tesla, Inc. launched its Model Y compact SUV, marking the electric vehicle manufacturer's entry into the popular SUV segment (Tesla, Inc., 2025). With record-breaking pre-orders and strong demand, the Model Y has become a key player in the market, demonstrating the growing importance of electric vehicles and Tesla's continued dominance in the sector.
  • In August 2024, Magna International, a leading automotive supplier, acquired a majority stake in Veoneer, a Swedish autonomous driving technology company, for approximately USD3.8 billion (Magna International, 2024). This strategic acquisition represents a significant investment in advanced technology and positions Magna as a key player in the development and deployment of autonomous driving systems in the market.
  • In December 2025, the European Union passed new regulations requiring all new passenger cars to be fitted with emission reduction technology, such as particulate filters, from 2025 onwards (European Parliament, 2025). This regulatory initiative represents a significant shift towards cleaner, more sustainable transportation and is expected to drive demand for advanced emission reduction technologies in the market.

Research Analyst Overview

The market continues to evolve, driven by a dynamic interplay of various factors. One significant influence is the ongoing innovation in fuel-efficient technologies, as consumers seek to mitigate the impact of fuel price volatility. Combustion engines are being replaced by more efficient alternatives, such as hybrids and electric vehicles (EVs), which offer enhanced features and improved fuel economy. Chrysler, like other automakers, is responding to these trends by expanding its lineup of fuel-efficient vehicles. Personalized transportation solutions are also gaining traction in emerging nations, where the urban population is on the rise and per capita income is increasing.

This market landscape is further shaped by economic challenges, regulations, and raw material prices, which can significantly impact sales and segment growth. Technological developments, such as the Internet of Things (IoT), are transforming the passenger car industry. Advanced safety measures and sustainable mobility are becoming increasingly important to consumers, as environmental concerns grow. The upward trend towards electric vehicles (EVs) and sustainable vehicles is evident, with companies like Volvo introducing their EV offerings and the proliferation of EV charging stations. Competition in the market is fierce, with automakers vying to offer the most advanced propulsion systems, from traditional internal combustion engines (ICE) to alternative-fuel options like hybrids and EVs.

Special utility vehicles, such as compact SUVs, remain popular choices due to their versatility and appeal to middle-income groups. The passenger vehicles industry is a dynamic and thriving market, with continuous innovation and adaptation to changing consumer preferences and economic conditions. Fuel prices, applicable taxes, and lifestyle changes are all factors that influence vehicle choices, as consumers seek sustainable practices and environmentally-friendly options. The European Union (EU) and other regulatory bodies play a crucial role in shaping industry dynamics, as they implement regulations aimed at reducing emissions and promoting sustainable mobility. Despite these challenges, the market remains optimistic, as technological advancements and economic growth continue to drive demand for passenger cars.

The ongoing evolution of the industry is a testament to its resilience and adaptability, as it navigates the complex interplay of various factors and shapes the future of personalized transportation.

Dive into Technavio's robust research methodology, blending expert interviews, extensive data synthesis, and validated models for unparalleled Passenger Car Market insights. See full methodology.

Market Scope

Report Coverage

Details

Page number

184

Base year

2023

Historic period

2018-2022

Forecast period

2024-2028

Growth momentum & CAGR

Accelerate at a CAGR of 7.96%

Market growth 2024-2028

USD 873.26 billion

Market structure

Fragmented

YoY growth 2023-2024(%)

6.34

Key countries

US, China, India, Japan, and Germany

Competitive landscape

Leading Companies, Market Positioning of Companies, Competitive Strategies, and Industry Risks

Request Free Sample

What are the Key Data Covered in this Passenger Car Market Research and Growth Report?

  • CAGR of the Passenger Car industry during the forecast period
  • Detailed information on factors that will drive the growth and forecasting between 2024 and 2028
  • Precise estimation of the size of the market and its contribution of the industry in focus to the parent market
  • Accurate predictions about upcoming growth and trends and changes in consumer behaviour
  • Growth of the market across APAC, Europe, North America, Middle East and Africa, and South America
  • Thorough analysis of the market's competitive landscape and detailed information about companies
  • Comprehensive analysis of factors that will challenge the passenger car market growth of industry companies

We can help! Our analysts can customize this passenger car market research report to meet your requirements.

Get in touch

1 Executive Summary

  • 1.1 Market overview
    • Exhibit 01: Executive Summary – Chart on Market Overview
    • Exhibit 02: Executive Summary – Data Table on Market Overview
    • Exhibit 03: Executive Summary – Chart on Global Market Characteristics
    • Exhibit 04: Executive Summary – Chart on Market by Geography
    • Exhibit 05: Executive Summary – Chart on Market Segmentation by Type
    • Exhibit 06: Executive Summary – Chart on Market Segmentation by Fuel Type
    • Exhibit 07: Executive Summary – Chart on Incremental Growth
    • Exhibit 08: Executive Summary – Data Table on Incremental Growth
    • Exhibit 09: Executive Summary – Chart on Vendor Market Positioning

2 Market Landscape

  • 2.1 Market ecosystem
    • Exhibit 10: Parent market
    • Exhibit 11: Market Characteristics

3 Market Sizing

  • 3.1 Market definition
    • Exhibit 12: Offerings of vendors included in the market definition
  • 3.2 Market segment analysis
    • Exhibit 13: Market segments
  • 3.3 Market size 2023
    • 3.4 Market outlook: Forecast for 2023-2028
      • Exhibit 14: Chart on Global - Market size and forecast 2023-2028 ($ billion)
      • Exhibit 15: Data Table on Global - Market size and forecast 2023-2028 ($ billion)
      • Exhibit 16: Chart on Global Market: Year-over-year growth 2023-2028 (%)
      • Exhibit 17: Data Table on Global Market: Year-over-year growth 2023-2028 (%)

    4 Historic Market Size

    • 4.1 Global passenger car market 2018 - 2022
      • Exhibit 18: Historic Market Size – Data Table on global passenger car market 2018 - 2022 ($ billion)
    • 4.2 Type Segment Analysis 2018 - 2022
      • Exhibit 19: Historic Market Size – Type Segment 2018 - 2022 ($ billion)
    • 4.3 Fuel type Segment Analysis 2018 - 2022
      • Exhibit 20: Historic Market Size – Fuel type Segment 2018 - 2022 ($ billion)
    • 4.4 Geography Segment Analysis 2018 - 2022
      • Exhibit 21: Historic Market Size – Geography Segment 2018 - 2022 ($ billion)
    • 4.5 Country Segment Analysis 2018 - 2022
      • Exhibit 22: Historic Market Size – Country Segment 2018 - 2022 ($ billion)

    5 Five Forces Analysis

    • 5.1 Five forces summary
      • Exhibit 23: Five forces analysis - Comparison between 2023 and 2028
    • 5.2 Bargaining power of buyers
      • Exhibit 24: Chart on Bargaining power of buyers – Impact of key factors 2023 and 2028
    • 5.3 Bargaining power of suppliers
      • Exhibit 25: Bargaining power of suppliers – Impact of key factors in 2023 and 2028
    • 5.4 Threat of new entrants
      • Exhibit 26: Threat of new entrants – Impact of key factors in 2023 and 2028
    • 5.5 Threat of substitutes
      • Exhibit 27: Threat of substitutes – Impact of key factors in 2023 and 2028
    • 5.6 Threat of rivalry
      • Exhibit 28: Threat of rivalry – Impact of key factors in 2023 and 2028
    • 5.7 Market condition
      • Exhibit 29: Chart on Market condition - Five forces 2023 and 2028

    6 Market Segmentation by Type

    • 6.1 Market segments
      • Exhibit 30: Chart on Type - Market share 2023-2028 (%)
      • Exhibit 31: Data Table on Type - Market share 2023-2028 (%)
    • 6.2 Comparison by Type
      • Exhibit 32: Chart on Comparison by Type
      • Exhibit 33: Data Table on Comparison by Type
    • 6.3 SUV - Market size and forecast 2023-2028
      • Exhibit 34: Chart on SUV - Market size and forecast 2023-2028 ($ billion)
      • Exhibit 35: Data Table on SUV - Market size and forecast 2023-2028 ($ billion)
      • Exhibit 36: Chart on SUV - Year-over-year growth 2023-2028 (%)
      • Exhibit 37: Data Table on SUV - Year-over-year growth 2023-2028 (%)
    • 6.4 Hatchback - Market size and forecast 2023-2028
      • Exhibit 38: Chart on Hatchback - Market size and forecast 2023-2028 ($ billion)
      • Exhibit 39: Data Table on Hatchback - Market size and forecast 2023-2028 ($ billion)
      • Exhibit 40: Chart on Hatchback - Year-over-year growth 2023-2028 (%)
      • Exhibit 41: Data Table on Hatchback - Year-over-year growth 2023-2028 (%)
    • 6.5 Sedan - Market size and forecast 2023-2028
      • Exhibit 42: Chart on Sedan - Market size and forecast 2023-2028 ($ billion)
      • Exhibit 43: Data Table on Sedan - Market size and forecast 2023-2028 ($ billion)
      • Exhibit 44: Chart on Sedan - Year-over-year growth 2023-2028 (%)
      • Exhibit 45: Data Table on Sedan - Year-over-year growth 2023-2028 (%)
    • 6.6 MPV - Market size and forecast 2023-2028
      • Exhibit 46: Chart on MPV - Market size and forecast 2023-2028 ($ billion)
      • Exhibit 47: Data Table on MPV - Market size and forecast 2023-2028 ($ billion)
      • Exhibit 48: Chart on MPV - Year-over-year growth 2023-2028 (%)
      • Exhibit 49: Data Table on MPV - Year-over-year growth 2023-2028 (%)
    • 6.7 Market opportunity by Type
      • Exhibit 50: Market opportunity by Type ($ billion)
      • Exhibit 51: Data Table on Market opportunity by Type ($ billion)

    7 Market Segmentation by Fuel Type

    • 7.1 Market segments
      • Exhibit 52: Chart on Fuel Type - Market share 2023-2028 (%)
      • Exhibit 53: Data Table on Fuel Type - Market share 2023-2028 (%)
    • 7.2 Comparison by Fuel Type
      • Exhibit 54: Chart on Comparison by Fuel Type
      • Exhibit 55: Data Table on Comparison by Fuel Type
    • 7.3 ICE Vehicles - Market size and forecast 2023-2028
      • Exhibit 56: Chart on ICE Vehicles - Market size and forecast 2023-2028 ($ billion)
      • Exhibit 57: Data Table on ICE Vehicles - Market size and forecast 2023-2028 ($ billion)
      • Exhibit 58: Chart on ICE Vehicles - Year-over-year growth 2023-2028 (%)
      • Exhibit 59: Data Table on ICE Vehicles - Year-over-year growth 2023-2028 (%)
    • 7.4 Hybrid - Market size and forecast 2023-2028
      • Exhibit 60: Chart on Hybrid - Market size and forecast 2023-2028 ($ billion)
      • Exhibit 61: Data Table on Hybrid - Market size and forecast 2023-2028 ($ billion)
      • Exhibit 62: Chart on Hybrid - Year-over-year growth 2023-2028 (%)
      • Exhibit 63: Data Table on Hybrid - Year-over-year growth 2023-2028 (%)
    • 7.5 Electric - Market size and forecast 2023-2028
      • Exhibit 64: Chart on Electric - Market size and forecast 2023-2028 ($ billion)
      • Exhibit 65: Data Table on Electric - Market size and forecast 2023-2028 ($ billion)
      • Exhibit 66: Chart on Electric - Year-over-year growth 2023-2028 (%)
      • Exhibit 67: Data Table on Electric - Year-over-year growth 2023-2028 (%)
    • 7.6 Market opportunity by Fuel Type
      • Exhibit 68: Market opportunity by Fuel Type ($ billion)
      • Exhibit 69: Data Table on Market opportunity by Fuel Type ($ billion)

    8 Customer Landscape

    • 8.1 Customer landscape overview
      • Exhibit 70: Analysis of price sensitivity, lifecycle, customer purchase basket, adoption rates, and purchase criteria

    9 Geographic Landscape

    • 9.1 Geographic segmentation
      • Exhibit 71: Chart on Market share by geography 2023-2028 (%)
      • Exhibit 72: Data Table on Market share by geography 2023-2028 (%)
    • 9.2 Geographic comparison
      • Exhibit 73: Chart on Geographic comparison
      • Exhibit 74: Data Table on Geographic comparison
    • 9.3 APAC - Market size and forecast 2023-2028
      • Exhibit 75: Chart on APAC - Market size and forecast 2023-2028 ($ billion)
      • Exhibit 76: Data Table on APAC - Market size and forecast 2023-2028 ($ billion)
      • Exhibit 77: Chart on APAC - Year-over-year growth 2023-2028 (%)
      • Exhibit 78: Data Table on APAC - Year-over-year growth 2023-2028 (%)
    • 9.4 Europe - Market size and forecast 2023-2028
      • Exhibit 79: Chart on Europe - Market size and forecast 2023-2028 ($ billion)
      • Exhibit 80: Data Table on Europe - Market size and forecast 2023-2028 ($ billion)
      • Exhibit 81: Chart on Europe - Year-over-year growth 2023-2028 (%)
      • Exhibit 82: Data Table on Europe - Year-over-year growth 2023-2028 (%)
    • 9.5 North America - Market size and forecast 2023-2028
      • Exhibit 83: Chart on North America - Market size and forecast 2023-2028 ($ billion)
      • Exhibit 84: Data Table on North America - Market size and forecast 2023-2028 ($ billion)
      • Exhibit 85: Chart on North America - Year-over-year growth 2023-2028 (%)
      • Exhibit 86: Data Table on North America - Year-over-year growth 2023-2028 (%)
    • 9.6 Middle East and Africa - Market size and forecast 2023-2028
      • Exhibit 87: Chart on Middle East and Africa - Market size and forecast 2023-2028 ($ billion)
      • Exhibit 88: Data Table on Middle East and Africa - Market size and forecast 2023-2028 ($ billion)
      • Exhibit 89: Chart on Middle East and Africa - Year-over-year growth 2023-2028 (%)
      • Exhibit 90: Data Table on Middle East and Africa - Year-over-year growth 2023-2028 (%)
    • 9.7 South America - Market size and forecast 2023-2028
      • Exhibit 91: Chart on South America - Market size and forecast 2023-2028 ($ billion)
      • Exhibit 92: Data Table on South America - Market size and forecast 2023-2028 ($ billion)
      • Exhibit 93: Chart on South America - Year-over-year growth 2023-2028 (%)
      • Exhibit 94: Data Table on South America - Year-over-year growth 2023-2028 (%)
    • 9.8 China - Market size and forecast 2023-2028
      • Exhibit 95: Chart on China - Market size and forecast 2023-2028 ($ billion)
      • Exhibit 96: Data Table on China - Market size and forecast 2023-2028 ($ billion)
      • Exhibit 97: Chart on China - Year-over-year growth 2023-2028 (%)
      • Exhibit 98: Data Table on China - Year-over-year growth 2023-2028 (%)
    • 9.9 India - Market size and forecast 2023-2028
      • Exhibit 99: Chart on India - Market size and forecast 2023-2028 ($ billion)
      • Exhibit 100: Data Table on India - Market size and forecast 2023-2028 ($ billion)
      • Exhibit 101: Chart on India - Year-over-year growth 2023-2028 (%)
      • Exhibit 102: Data Table on India - Year-over-year growth 2023-2028 (%)
    • 9.10 Japan - Market size and forecast 2023-2028
      • Exhibit 103: Chart on Japan - Market size and forecast 2023-2028 ($ billion)
      • Exhibit 104: Data Table on Japan - Market size and forecast 2023-2028 ($ billion)
      • Exhibit 105: Chart on Japan - Year-over-year growth 2023-2028 (%)
      • Exhibit 106: Data Table on Japan - Year-over-year growth 2023-2028 (%)
    • 9.11 US - Market size and forecast 2023-2028
      • Exhibit 107: Chart on US - Market size and forecast 2023-2028 ($ billion)
      • Exhibit 108: Data Table on US - Market size and forecast 2023-2028 ($ billion)
      • Exhibit 109: Chart on US - Year-over-year growth 2023-2028 (%)
      • Exhibit 110: Data Table on US - Year-over-year growth 2023-2028 (%)
    • 9.12 Germany - Market size and forecast 2023-2028
      • Exhibit 111: Chart on Germany - Market size and forecast 2023-2028 ($ billion)
      • Exhibit 112: Data Table on Germany - Market size and forecast 2023-2028 ($ billion)
      • Exhibit 113: Chart on Germany - Year-over-year growth 2023-2028 (%)
      • Exhibit 114: Data Table on Germany - Year-over-year growth 2023-2028 (%)
    • 9.13 Market opportunity by geography
      • Exhibit 115: Market opportunity by geography ($ billion)
      • Exhibit 116: Data Tables on Market opportunity by geography ($ billion)

    10 Drivers, Challenges, and Trends

    • 10.1 Market drivers
      • 10.2 Market challenges
        • 10.3 Impact of drivers and challenges
          • Exhibit 117: Impact of drivers and challenges in 2023 and 2028
        • 10.4 Market trends

          11 Vendor Landscape

          • 11.1 Overview
            • 11.2 Vendor landscape
              • Exhibit 118: Overview on Criticality of inputs and Factors of differentiation
            • 11.3 Landscape disruption
              • Exhibit 119: Overview on factors of disruption
            • 11.4 Industry risks
              • Exhibit 120: Impact of key risks on business

            12 Vendor Analysis

            • 12.1 Vendors covered
              • Exhibit 121: Vendors covered
            • 12.2 Market positioning of vendors
              • Exhibit 122: Matrix on vendor position and classification
            • 12.3 Aston Martin Lagonda Ltd.
              • Exhibit 123: Aston Martin Lagonda Ltd. - Overview
              • Exhibit 124: Aston Martin Lagonda Ltd. - Product / Service
              • Exhibit 125: Aston Martin Lagonda Ltd. - Key offerings
            • 12.4 BYD Co. Ltd.
              • Exhibit 126: BYD Co. Ltd. - Overview
              • Exhibit 127: BYD Co. Ltd. - Business segments
              • Exhibit 128: BYD Co. Ltd. - Key news
              • Exhibit 129: BYD Co. Ltd. - Key offerings
              • Exhibit 130: BYD Co. Ltd. - Segment focus
            • 12.5 Ford Motor Co.
              • Exhibit 131: Ford Motor Co. - Overview
              • Exhibit 132: Ford Motor Co. - Business segments
              • Exhibit 133: Ford Motor Co. - Key news
              • Exhibit 134: Ford Motor Co. - Key offerings
              • Exhibit 135: Ford Motor Co. - Segment focus
            • 12.6 Geely Auto International Corp.
              • Exhibit 136: Geely Auto International Corp. - Overview
              • Exhibit 137: Geely Auto International Corp. - Product / Service
              • Exhibit 138: Geely Auto International Corp. - Key offerings
            • 12.7 General Motors Co.
              • Exhibit 139: General Motors Co. - Overview
              • Exhibit 140: General Motors Co. - Business segments
              • Exhibit 141: General Motors Co. - Key news
              • Exhibit 142: General Motors Co. - Key offerings
              • Exhibit 143: General Motors Co. - Segment focus
            • 12.8 Honda Motor Co. Ltd.
              • Exhibit 144: Honda Motor Co. Ltd. - Overview
              • Exhibit 145: Honda Motor Co. Ltd. - Business segments
              • Exhibit 146: Honda Motor Co. Ltd. - Key news
              • Exhibit 147: Honda Motor Co. Ltd. - Key offerings
              • Exhibit 148: Honda Motor Co. Ltd. - Segment focus
            • 12.9 Hyundai Motor Co.
              • Exhibit 149: Hyundai Motor Co. - Overview
              • Exhibit 150: Hyundai Motor Co. - Business segments
              • Exhibit 151: Hyundai Motor Co. - Key news
              • Exhibit 152: Hyundai Motor Co. - Key offerings
              • Exhibit 153: Hyundai Motor Co. - Segment focus
            • 12.10 Mercedes Benz Group AG
              • Exhibit 154: Mercedes Benz Group AG - Overview
              • Exhibit 155: Mercedes Benz Group AG - Business segments
              • Exhibit 156: Mercedes Benz Group AG - Key offerings
              • Exhibit 157: Mercedes Benz Group AG - Segment focus
            • 12.11 Renault SAS
              • Exhibit 158: Renault SAS - Overview
              • Exhibit 159: Renault SAS - Product / Service
              • Exhibit 160: Renault SAS - Key offerings
            • 12.12 Stellantis NV
              • Exhibit 161: Stellantis NV - Overview
              • Exhibit 162: Stellantis NV - Business segments
              • Exhibit 163: Stellantis NV - Key news
              • Exhibit 164: Stellantis NV - Key offerings
              • Exhibit 165: Stellantis NV - Segment focus
            • 12.13 Suzuki Motor Corp.
              • Exhibit 166: Suzuki Motor Corp. - Overview
              • Exhibit 167: Suzuki Motor Corp. - Business segments
              • Exhibit 168: Suzuki Motor Corp. - Key offerings
              • Exhibit 169: Suzuki Motor Corp. - Segment focus
            • 12.14 Tata Motors Ltd.
              • Exhibit 170: Tata Motors Ltd. - Overview
              • Exhibit 171: Tata Motors Ltd. - Business segments
              • Exhibit 172: Tata Motors Ltd. - Key news
              • Exhibit 173: Tata Motors Ltd. - Key offerings
              • Exhibit 174: Tata Motors Ltd. - Segment focus
            • 12.15 Tesla Inc.
              • Exhibit 175: Tesla Inc. - Overview
              • Exhibit 176: Tesla Inc. - Business segments
              • Exhibit 177: Tesla Inc. - Key news
              • Exhibit 178: Tesla Inc. - Key offerings
              • Exhibit 179: Tesla Inc. - Segment focus
            • 12.16 Toyota Motor Corp.
              • Exhibit 180: Toyota Motor Corp. - Overview
              • Exhibit 181: Toyota Motor Corp. - Business segments
              • Exhibit 182: Toyota Motor Corp. - Key offerings
              • Exhibit 183: Toyota Motor Corp. - Segment focus
            • 12.17 Volkswagen AG
              • Exhibit 184: Volkswagen AG - Overview
              • Exhibit 185: Volkswagen AG - Business segments
              • Exhibit 186: Volkswagen AG - Key offerings
              • Exhibit 187: Volkswagen AG - Segment focus

            13 Appendix

            • 13.1 Scope of the report
              • 13.2 Inclusions and exclusions checklist
                • Exhibit 188: Inclusions checklist
                • Exhibit 189: Exclusions checklist
              • 13.3 Currency conversion rates for US$
                • Exhibit 190: Currency conversion rates for US$
              • 13.4 Research methodology
                • Exhibit 191: Research methodology
                • Exhibit 192: Validation techniques employed for market sizing
                • Exhibit 193: Information sources
              • 13.5 List of abbreviations
                • Exhibit 194: List of abbreviations

              Research Methodology

              Technavio presents a detailed picture of the market by way of study, synthesis, and summation of data from multiple sources. The analysts have presented the various facets of the market with a particular focus on identifying the key industry influencers. The data thus presented is comprehensive, reliable, and the result of extensive research, both primary and secondary.

              INFORMATION SOURCES

              Primary sources

              • Manufacturers and suppliers
              • Channel partners
              • Industry experts
              • Strategic decision makers

              Secondary sources

              • Industry journals and periodicals
              • Government data
              • Financial reports of key industry players
              • Historical data
              • Press releases

              DATA ANALYSIS

              Data Synthesis

              • Collation of data
              • Estimation of key figures
              • Analysis of derived insights

              Data Validation

              • Triangulation with data models
              • Reference against proprietary databases
              • Corroboration with industry experts

              REPORT WRITING

              Qualitative

              • Market drivers
              • Market challenges
              • Market trends
              • Five forces analysis

              Quantitative

              • Market size and forecast
              • Market segmentation
              • Geographical insights
              • Competitive landscape

              Interested in this report?

              Get your sample now to see our research methodology and insights!

              Download Now

              Frequently Asked Questions

              Passenger Car market growth will increase by $ 873.26 bn during 2024-2028 .

              The Passenger Car market is expected to grow at a CAGR of 7.96% during 2024-2028 .

              Passenger Car market is segmented by Type( SUV, Hatchback, Sedan, MPV) Fuel Type( ICE Vehicles, Hybrid, Electric)

              Aston Martin Lagonda Ltd., BMW AG, BYD Co. Ltd., Ford Motor Co., Geely Auto International Corp., General Motors Co., Great Wall Motor Co. Ltd., Honda Motor Co. Ltd., Hyundai Motor Co., Mahindra and Mahindra Ltd., Mazda Motor Corp., Mercedes Benz Group AG, Renault SAS, SAIC Motor Corp. Ltd., Stellantis NV, Suzuki Motor Corp., Tata Motors Ltd., Tesla Inc., Toyota Motor Corp., Volkswagen AG are a few of the key vendors in the Passenger Car market.

              APAC will register the highest growth rate of 55% among the other regions. Therefore, the Passenger Car market in APAC is expected to garner significant business opportunities for the vendors during the forecast period.

              US, China, India, Japan, Germany

              • Growing popularity of EVsMost government bodies globally are taking several initiatives to promote the adoption of EVs. Unlike ICE-based vehicles is the driving factor this market.
              • EVs significantly reduce air pollution as they do not emit harmful pollutants such as particulates is the driving factor this market.
              • carbon monoxide is the driving factor this market.
              • hydrocarbons is the driving factor this market.
              • and volatile organic compounds. Additionally is the driving factor this market.
              • various benefits and rewards provided by governments is the driving factor this market.
              • an increase in participation from foreign as well as regional players in the development of EVs is the driving factor this market.
              • and increased buyers intent are becoming crucial drivers for the adoption of EVs.   In China is the driving factor this market.
              • the government provides subsidies to firms engaged in the manufacturing of EVs. Even foreign companies that have their EV manufacturing units in the country have the right to claim subsidies and benefits provided by the government. As per the data released by the China Electric Vehicle Charging Infrastructure Promotion Association is the driving factor this market.
              • as of April 2021 is the driving factor this market.
              • China had 8 is the driving factor this market.
              • 68 is the driving factor this market.
              • 000 public charging stations for EVs is the driving factor this market.
              • of which 5 is the driving factor this market.
              • 05 is the driving factor this market.
              • 000 were AC charging stations. These factors significantly increased the adoption of EVs in China is the driving factor this market.
              • making them prominent EV markets.  Emerging economies such as India are adopting the incentives route to gain traction in the adoption of EVs and are aggressively targeting EV adoption. For instance is the driving factor this market.
              • in December 2023 is the driving factor this market.
              • the Ministry of Heavy Industries sanctioned 7432 EV charging stations to 3 oil marketing companies (OMCs) under the Faster Adoption and Manufacturing of Electric Vehicles (FAME) India Scheme phase II. FAME attempts to encourage Indias use of EVs. There are two phases to the scheme: FAME India Phase I and FAME India Phase II. It was introduced in 2015.EVs need telematics services as a standard fitment to track the vehicles battery status. Advancements in telematics allow users to track the battery status through mobiles or laptops. Hence is the driving factor this market.
              • the adoption of EVs is a major driver for the growth of the global passenger car market.  Several OEMs are launching PHEV is the driving factor this market.
              • which combine the advantages of both EVs and gasoline engines. For instance is the driving factor this market.
              • in December 2023 is the driving factor this market.
              • Toyota announced the launch of an All-New Crown Sport-type PHEV model in Japan. The vehicle is fitted with a large-capacity lithium-ion battery and BEV-mode cruising range suitable for everyday use. Hybrid engines are equipped with advanced technologies such as regenerative braking is the driving factor this market.
              • automatic start and stop is the driving factor this market.
              • and electric motor assist. Concerns about the significant increase in greenhouse gas (GHG) emissions have led to an increase in the sales of plug-in hybrids and fully electric vehicles. Hence is the driving factor this market.
              • the adoption of EVs is a major driver for the growth of the global passenger car market during the forecast period.  is the driving factor this market.

              The Passenger Car market vendors should focus on grabbing business opportunities from the SUV segment as it accounted for the largest market share in the base year.