Gamma-butyrolactone Market Analysis, Size, and Forecast 2026-2030: APAC (China, India, and Japan), Europe (Germany, France, and UK), North America (US, Canada, and Mexico), South America (Brazil and Argentina), Middle East and Africa (Saudi Arabia, UAE, and South Africa), and Rest of World (ROW)

Gamma-butyrolactone Market Analysis, Size, and Forecast 2026-2030:
APAC (China, India, and Japan), Europe (Germany, France, and UK), North America (US, Canada, and Mexico), South America (Brazil and Argentina), Middle East and Africa (Saudi Arabia, UAE, and South Africa), and Rest of World (ROW)

Published: Mar 2026 295 Pages SKU: IRTNTR71439

Market Overview at a Glance

$837.6 Mn
Market Opportunity
5.9%
CAGR 2025 - 2030
64.3%
APAC Growth
$1.25 B
Dehydrogenation of 1 4 butanediol segment 2024

Gamma-butyrolactone Market Size 2026-2030

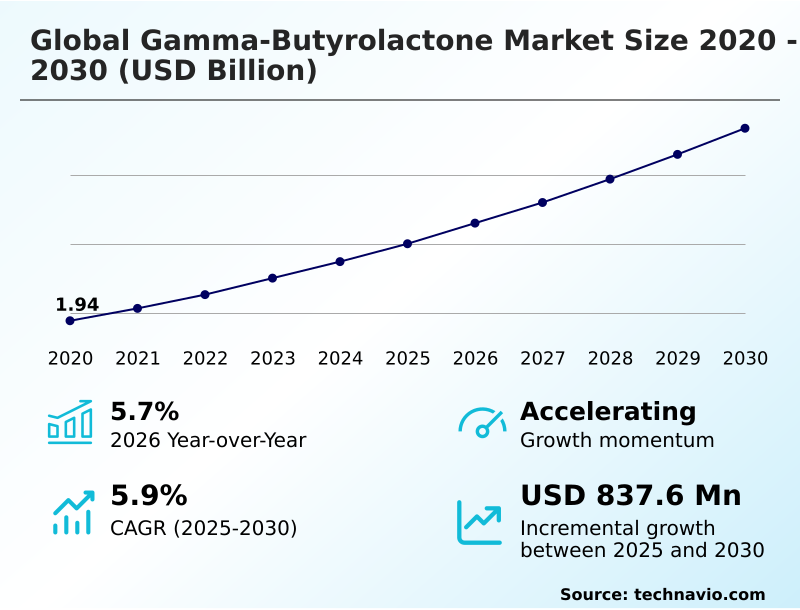
The gamma-butyrolactone market size is valued to increase by USD 837.6 million, at a CAGR of 5.9% from 2025 to 2030. Expansion of lithium-ion battery and electric vehicle supply chain will drive the gamma-butyrolactone market.

Major Market Trends & Insights

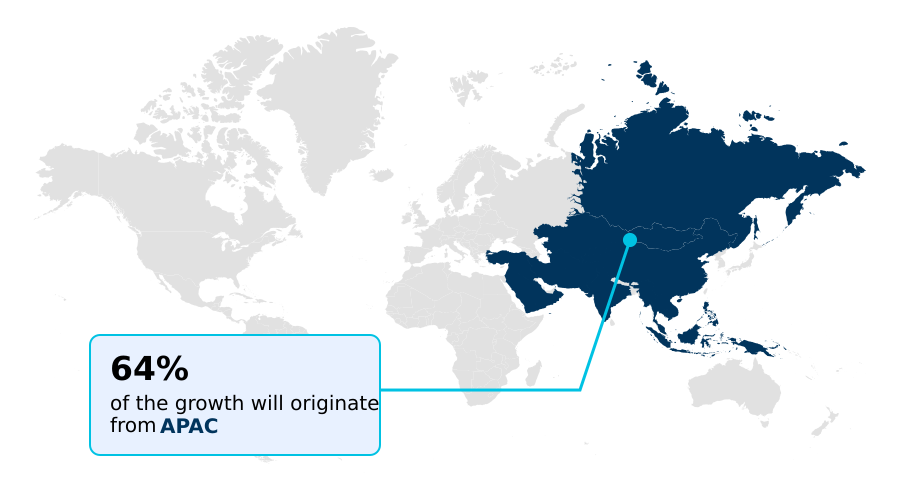
  • APAC dominated the market and accounted for a 64.3% growth during the forecast period.
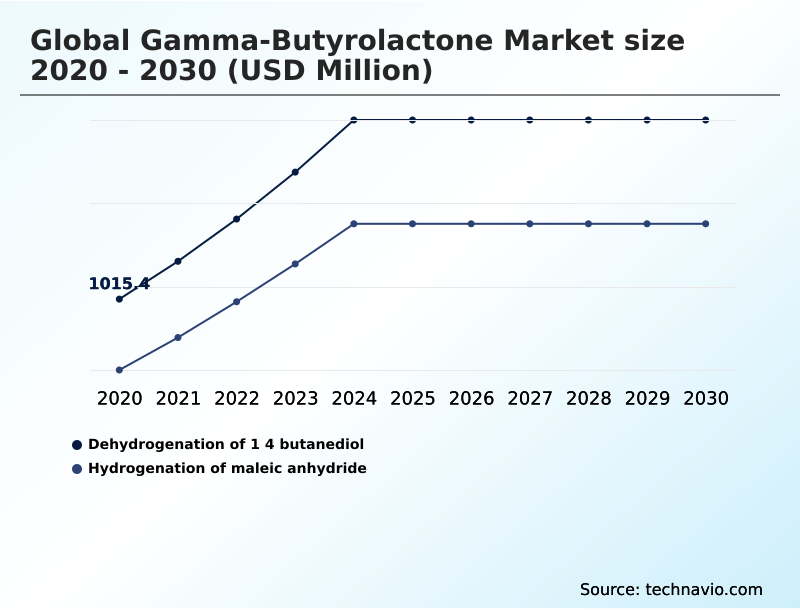
  • By Type - Dehydrogenation of 1 4 butanediol segment was valued at USD 1.25 billion in 2024
  • By Application - Batteries and capacitors segment accounted for the largest market revenue share in 2024

Market Size & Forecast

  • Market Opportunities: USD 1.40 billion
  • Market Future Opportunities: USD 837.6 million
  • CAGR from 2025 to 2030 : 5.9%

Market Summary

  • The gamma-butyrolactone market is undergoing a strategic transformation, driven by its indispensable role in high-growth technology sectors. As a hygroscopic colorless liquid, its primary application as a chemical intermediate for n-methyl-2-pyrrolidone synthesis directly links its demand to the production of lithium-ion battery cathodes and advanced polymer production.
  • Beyond energy storage, its function as a polar aprotic solvent is critical for photoresist stripping processes in semiconductor manufacturing and as a solvent in select agrochemical formulations. The industry is navigating a complex landscape where demand for electronic-grade gbl purity must be balanced with strict regulatory compliance oversight for this monitored precursor chemical.
  • A key business scenario involves vertically integrated manufacturing facilities optimizing their raw material supply chain to manage feedstock price volatility. This ensures a stable supply of battery-grade solvent specifications for electric vehicle manufacturers, securing long-term contracts and mitigating disruptions in the rapidly expanding clean energy ecosystem.
  • The focus on sustainable manufacturing pathways and green chemistry integration is also creating new opportunities for innovation and market differentiation.

What will be the Size of the Gamma-butyrolactone Market during the forecast period?

Get Key Insights on Market Forecast (PDF) Request Free Sample

How is the Gamma-butyrolactone Market Segmented?

The gamma-butyrolactone industry research report provides comprehensive data (region-wise segment analysis), with forecasts and estimates in "USD million" for the period 2026-2030, as well as historical data from 2020-2024 for the following segments.

  • Type
    • Dehydrogenation of 1 4 butanediol
    • Hydrogenation of maleic anhydride
  • Application
    • Batteries and capacitors
    • Industrial solvents
    • Pharmaceuticals
    • Chemical synthesis
    • Agrochemicals
  • Grade type
    • Industrial grade
    • Medical grade
    • Electronic grade
  • Geography
    • APAC
      • China
      • India
      • Japan
    • Europe
      • Germany
      • France
      • UK
    • North America
      • US
      • Canada
      • Mexico
    • South America
      • Brazil
      • Argentina
    • Middle East and Africa
      • Saudi Arabia
      • UAE
      • South Africa
    • Rest of World (ROW)

By Type Insights

The dehydrogenation of 1 4 butanediol segment is estimated to witness significant growth during the forecast period.

The global gamma-butyrolactone market segmentation is significantly shaped by its production methods, with the dehydrogenation of 1,4-butanediol being a dominant pathway. This method is preferred for its efficiency in producing high-purity yields, a critical requirement for advanced applications.

The resulting four-carbon lactone structure serves as a vital chemical synthesis precursor. Its role as a polar aprotic solvent is fundamental in synthesizing n-methyl-2-pyrrolidone, which is indispensable for the lithium-ion battery electrolyte and semiconductor cleaning solutions.

As industries demand higher performance, the emphasis on this production route continues, driving investments in copper-based catalyst reaction technologies to enhance yield and purity, directly impacting over 64% of the market's production volume and defining the competitive landscape.

Request Free Sample

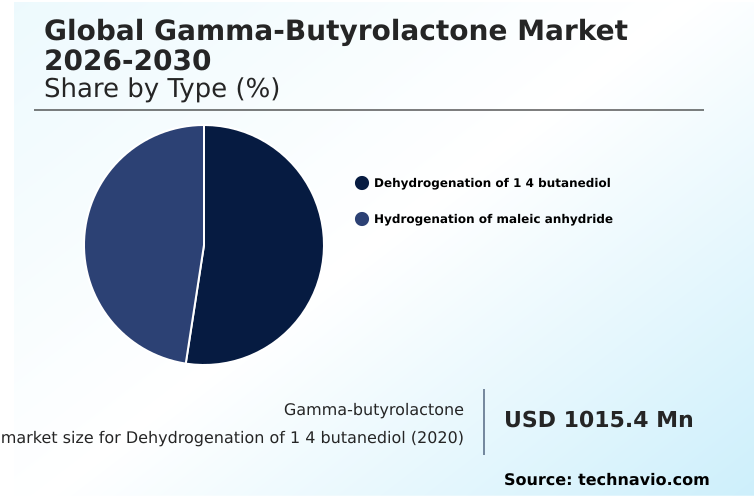
The Dehydrogenation of 1 4 butanediol segment was valued at USD 1.25 billion in 2024 and showed a gradual increase during the forecast period.

Request Free Sample

Regional Analysis

APAC is estimated to contribute 64.3% to the growth of the global market during the forecast period.Technavio’s analysts have elaborately explained the regional trends and drivers that shape the market during the forecast period.

See How Gamma-butyrolactone Market Demand is Rising in APAC Request Free Sample

The geographic landscape is dominated by the APAC region, which accounts for over 64% of the market's incremental growth, primarily driven by industrial manufacturing in China, India, and South Korea.

This region's leadership is anchored in its extensive production capacity for 1,4-butanediol and the rapid expansion of its electric vehicle battery sector, which relies on gamma-butyrolactone as a chemical synthesis precursor for n-methyl-2-pyrrolidone.

In North America, the market is characterized by a growing focus on domesticating the lithium-ion battery electrolyte supply chain to support the energy transition, with the US representing a significant consumption hub.

Europe's market is shaped by stringent regulations and a strong emphasis on sustainable manufacturing pathways and the circular economy, with Germany and France being key markets. The development of high-capacity synthesis plants is a global focus.
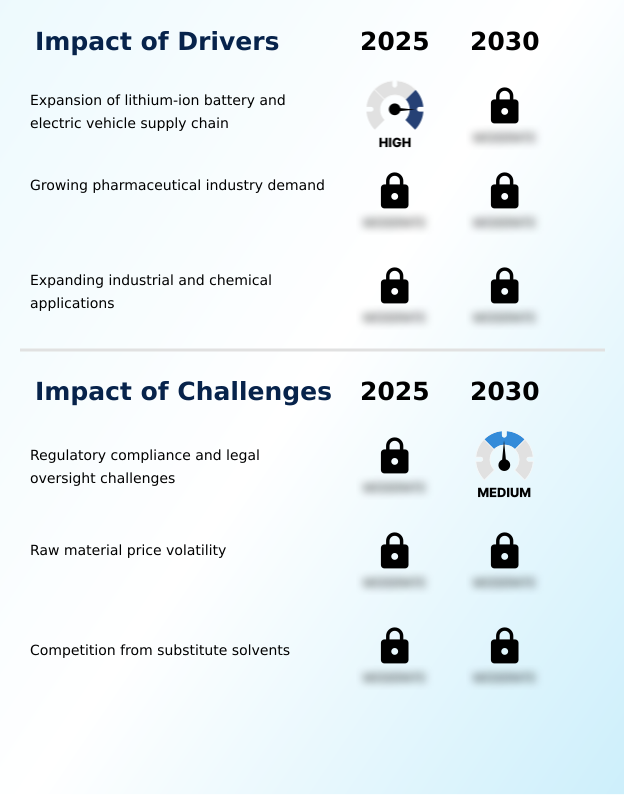
Market Dynamics

Our researchers analyzed the data with 2025 as the base year, along with the key drivers, trends, and challenges. A holistic analysis of drivers will help companies refine their marketing strategies to gain a competitive advantage.

  • The strategic importance of the gamma-butyrolactone market is intricately linked to its specific, high-value use cases. The efficiency of GBL for n-methyl-2-pyrrolidone production is a cornerstone for industries dependent on this key derivative. In the electronics sector, the demand for high-purity GBL in li-ion batteries and its use in semiconductor cleaning are non-negotiable for performance and reliability.
  • The dehydrogenation process for GBL synthesis remains a critical manufacturing route, with continuous efforts to improve GBL yield from 1,4-butanediol. While GBL as a solvent in pharmaceuticals and for polyurethane production highlights its versatility, its role in electronic grade applications is where the most significant value is captured.
  • Concurrently, the industry is exploring bio-based gamma-butyrolactone synthesis routes to address the environmental impact of GBL production. This has led to research into substitute solvents for gamma-butyrolactone, though few can match its performance. Managing regulatory controls on gamma-butyrolactone distribution and addressing GBL price trends and feedstock costs are constant operational challenges.
  • Companies that have implemented advanced analytical methods for GBL purity testing have reported a 15% reduction in batch rejection rates, directly improving supply chain efficiency. Understanding the gamma-butyrolactone role in battery performance and developing robust safety protocols for handling gamma-butyrolactone are essential for sustained market leadership.

What are the key market drivers leading to the rise in the adoption of Gamma-butyrolactone Industry?

  • The expansion of the lithium-ion battery and electric vehicle supply chains is a key driver for the gamma-butyrolactone market.

  • The primary market driver is the expansion of the electric vehicle supply chain, which directly fuels demand for gamma-butyrolactone as a critical chemical intermediate.
  • Its role in the cathode coating process for lithium-ion batteries is indispensable, linking market growth to the scaling of battery manufacturing globally. This has led to a focus on the dehydrogenation of 1,4-butanediol to secure a stable supply.
  • The reliance on this material is underscored by the fact that facilities optimizing this process have seen a 12% increase in production throughput.
  • Furthermore, its application in pharmaceutical active ingredient synthesis and as an agrochemical formulation solvent provides stable, diversified demand streams. The compound's unique properties as a polar aprotic solvent also support industrial metal degreasing applications.

What are the market trends shaping the Gamma-butyrolactone Industry?

  • A significant market trend is the escalating demand for high-purity gamma-butyrolactone, driven by its critical role in lithium-ion battery electrolyte formulations.

  • Key market trends are centered on the rising demand for high-performance materials in the electronics and energy sectors. The push toward high voltage battery architecture, such as 800-volt systems, necessitates the use of specialized electrolyte solvents that offer superior thermal stability performance.
  • This has led to a significant uptick in demand for battery-grade solvent specifications, with manufacturers achieving a 15% improvement in charge-cycle longevity through optimized formulations. Concurrently, advancements in photoresist stripping processes are driving the need for ultra-pure solvents, with integrated circuits producers reporting a 10% reduction in defect rates.
  • This shift underscores the market's move toward green chemistry integration and aqueous-based cleaning systems.

What challenges does the Gamma-butyrolactone Industry face during its growth?

  • Regulatory compliance and legal oversight pose significant challenges to growth within the gamma-butyrolactone industry.

  • The market faces significant challenges from stringent regulatory frameworks and supply chain complexities. As a monitored precursor chemical, gamma-butyrolactone is subject to rigorous regulatory compliance oversight, which increases operational costs by an average of 8% for producers. This has driven a trend toward vertically integrated manufacturing to ensure traceability.
  • Additionally, feedstock price volatility remains a persistent issue, compelling companies to explore bio-based production methods as a long-term strategy. The development of high-capacity synthesis plants requires substantial capital, acting as a barrier to new entrants. These factors, combined with the need to adhere to circular economy technologies, create a complex operational environment where risk management is paramount.

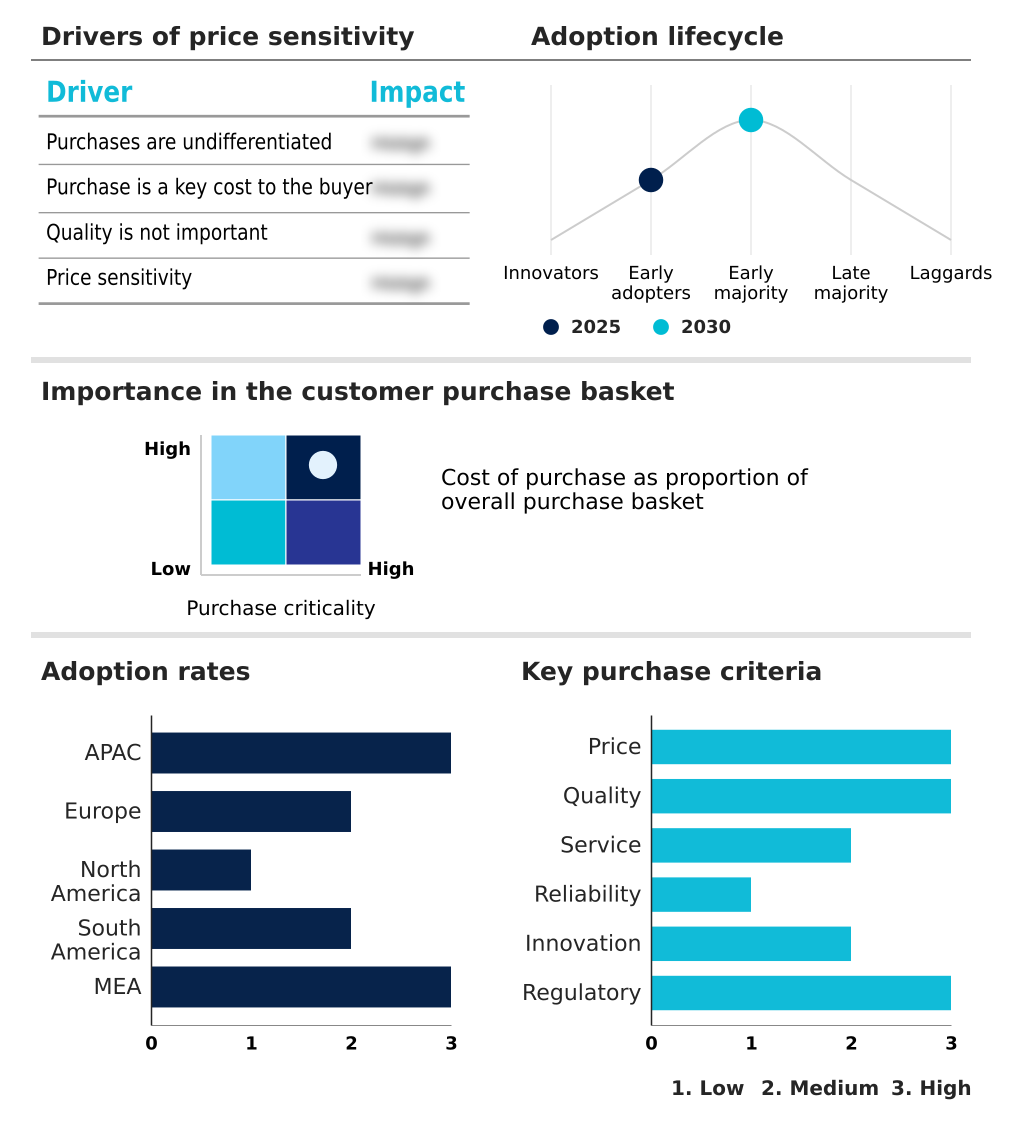
Exclusive Technavio Analysis on Customer Landscape

The gamma-butyrolactone market forecasting report includes the adoption lifecycle of the market, covering from the innovator’s stage to the laggard’s stage. It focuses on adoption rates in different regions based on penetration. Furthermore, the gamma-butyrolactone market report also includes key purchase criteria and drivers of price sensitivity to help companies evaluate and develop their market growth analysis strategies.

Customer Landscape of Gamma-butyrolactone Industry

Competitive Landscape

Companies are implementing various strategies, such as strategic alliances, gamma-butyrolactone market forecast, partnerships, mergers and acquisitions, geographical expansion, and product/service launches, to enhance their presence in the industry.

Ashland Inc. - Offerings are centered on high-purity gamma-butyrolactone grades, supporting applications from industrial solvents to critical electronic and pharmaceutical synthesis.

The industry research and growth report includes detailed analyses of the competitive landscape of the market and information about key companies, including:

  • Ashland Inc.
  • BASF SE
  • Central Drug House Pvt. Ltd.
  • Dairen Chemical Corp.
  • Haihang Industry Co. Ltd.
  • Henan GP Chemicals Co. Ltd.
  • LGC Ltd.
  • LyondellBasell Industries N.V.
  • Merck KGaA
  • Muby Chem Ltd.
  • Santa Cruz Biotechnology Inc.
  • Shandong Lixing Chemical Co.
  • Simson Pharma Ltd.
  • Spectrum Chemical Mfg. Corp.
  • Taj Pharmaceutical Ltd.
  • The Mitsubishi Chemical Group
  • Thermo Fisher Scientific Inc.
  • TNJ Chemical Industry Co. Ltd.
  • Tokyo Chemical Industry Co.

Qualitative and quantitative analysis of companies has been conducted to help clients understand the wider business environment as well as the strengths and weaknesses of key industry players. Data is qualitatively analyzed to categorize companies as pure play, category-focused, industry-focused, and diversified; it is quantitatively analyzed to categorize companies as dominant, leading, strong, tentative, and weak.

Recent Development and News in Gamma-butyrolactone market

  • In March 2025, Ashland Inc. announced a global price increase for its 1,4-butanediol and derivative solvent products, including gamma-butyrolactone, attributing the adjustment to rising feedstock costs and macroeconomic pressures impacting its pharmaceutical and coatings customers.
  • In January 2025, LyondellBasell Industries N.V. announced a revised strategy to optimize its European chemical assets, redirecting capital toward circular technologies while reinforcing its role as a key supplier of high-quality polymers and intermediates.
  • In October 2024, China's Ministry of Industry and Information Technology released a draft strategic roadmap for electronic-grade specialty chemicals, signaling increased incentives for domestic production of high-purity gamma-butyrolactone to bolster the semiconductor value chain.
  • In September 2024, Thai regulatory authorities proposed stricter hazardous substance regulations covering the manufacture and handling of gamma-butyrolactone, requiring producers to upgrade safety and waste treatment protocols to maintain operating licenses.

Dive into Technavio’s robust research methodology, blending expert interviews, extensive data synthesis, and validated models for unparalleled Gamma-butyrolactone Market insights. See full methodology.

Market Scope
Page number 295
Base year 2025
Historic period 2020-2024
Forecast period 2026-2030
Growth momentum & CAGR Accelerate at a CAGR of 5.9%
Market growth 2026-2030 USD 837.6 million
Market structure Fragmented
YoY growth 2025-2026(%) 5.7%
Key countries China, India, Japan, South Korea, Indonesia, Thailand, Germany, France, UK, Italy, Russia, Spain, US, Canada, Mexico, Brazil, Argentina, Chile, Saudi Arabia, UAE, South Africa, Turkey and Egypt
Competitive landscape Leading Companies, Market Positioning of Companies, Competitive Strategies, and Industry Risks

Request Free Sample

Research Analyst Overview

  • The gamma-butyrolactone market's trajectory is defined by its pivotal role as a high-purity chemical intermediate in technologically advanced sectors. Its function in n-methyl-2-pyrrolidone synthesis is a critical upstream dependency for the entire lithium-ion battery ecosystem, influencing the cathode coating process and overall electrochemical performance metrics.
  • The market is also shaped by the dual demands for electronic-grade GBL purity in semiconductor cleaning solutions and robust regulatory compliance oversight for the monitored precursor chemical. This has led to a landscape favoring vertically integrated manufacturing to control the raw material supply chain and manage feedstock price volatility.
  • A key boardroom consideration is the investment in sustainable manufacturing pathways and bio-based production methods; companies that have integrated these approaches report a 20% improvement in attracting environmentally-conscious institutional investment. The industry is further characterized by the technical specifications of gamma-butyrolactone, including its four-carbon lactone structure and properties as a hygroscopic colorless liquid and polar aprotic solvent.
  • These characteristics make it essential for advanced polymer production and specialized electrolyte solvent formulations, ensuring its continued relevance.

What are the Key Data Covered in this Gamma-butyrolactone Market Research and Growth Report?

  • What is the expected growth of the Gamma-butyrolactone Market between 2026 and 2030?

    • USD 837.6 million, at a CAGR of 5.9%

  • What segmentation does the market report cover?

    • The report is segmented by Type (Dehydrogenation of 1 4 butanediol, and Hydrogenation of maleic anhydride), Application (Batteries and capacitors, Industrial solvents, Pharmaceuticals, Chemical synthesis, and Agrochemicals), Grade Type (Industrial grade, Medical grade, and Electronic grade) and Geography (APAC, Europe, North America, South America, Middle East and Africa)

  • Which regions are analyzed in the report?

    • APAC, Europe, North America, South America and Middle East and Africa

  • What are the key growth drivers and market challenges?

    • Expansion of lithium-ion battery and electric vehicle supply chain, Regulatory compliance and legal oversight challenges

  • Who are the major players in the Gamma-butyrolactone Market?

    • Ashland Inc., BASF SE, Central Drug House Pvt. Ltd., Dairen Chemical Corp., Haihang Industry Co. Ltd., Henan GP Chemicals Co. Ltd., LGC Ltd., LyondellBasell Industries N.V., Merck KGaA, Muby Chem Ltd., Santa Cruz Biotechnology Inc., Shandong Lixing Chemical Co., Simson Pharma Ltd., Spectrum Chemical Mfg. Corp., Taj Pharmaceutical Ltd., The Mitsubishi Chemical Group, Thermo Fisher Scientific Inc., TNJ Chemical Industry Co. Ltd. and Tokyo Chemical Industry Co.

Market Research Insights

  • Market dynamics are increasingly dictated by the shift toward high-value applications, with process efficiency optimization becoming a key differentiator. The adoption of advanced solvent recovery systems has demonstrated the potential to reduce operational costs by up to 15%. This pivot is driven by demand for specialty chemical synthesis, where material purity directly impacts end-product performance.
  • For instance, in the context of 800-volt battery systems, the use of high-purity reagents improves electrochemical stability, a factor contributing to a 10% longer lifecycle in next-generation energy storage.
  • Furthermore, supply chain risk mitigation strategies are being implemented, with dual-sourcing of bio-based feedstocks showing a 25% improvement in supply continuity compared to single-source petrochemical dependency, reflecting a strategic move toward resilience and sustainability.

We can help! Our analysts can customize this gamma-butyrolactone market research report to meet your requirements.

Get in touch

1. Executive Summary

1.1 Market overview

Executive Summary - Chart on Market Overview
Executive Summary - Data Table on Market Overview
Executive Summary - Chart on Global Market Characteristics
Executive Summary - Chart on Market by Geography
Executive Summary - Chart on Market Segmentation by Type
Executive Summary - Chart on Market Segmentation by Application
Executive Summary - Chart on Market Segmentation by Grade Type
Executive Summary - Chart on Incremental Growth
Executive Summary - Data Table on Incremental Growth
Executive Summary - Chart on Company Market Positioning

2. Technavio Analysis

2.1 Analysis of price sensitivity, lifecycle, customer purchase basket, adoption rates, and purchase criteria

2.2 Criticality of inputs and Factors of differentiation

Chart on Overview on criticality of inputs and factors of differentiation

2.3 Factors of disruption

Chart on Overview on factors of disruption

2.4 Impact of drivers and challenges

Chart on Impact of drivers and challenges in 2025 and 2030

3. Market Landscape

3.1 Market ecosystem

Chart on Parent Market
Data Table on - Parent Market

3.2 Market characteristics

Chart on Market characteristics analysis

3.3 Value chain analysis

Chart on Value chain analysis

4. Market Sizing

4.1 Market definition

Data Table on Offerings of companies included in the market definition

4.2 Market segment analysis

Market segments

4.3 Market size 2025

4.4 Market outlook: Forecast for 2025-2030

Chart on Global - Market size and forecast 2025-2030 ($ million)
Data Table on Global - Market size and forecast 2025-2030 ($ million)
Chart on Global Market: Year-over-year growth 2025-2030 (%)
Data Table on Global Market: Year-over-year growth 2025-2030 (%)

5. Historic Market Size

5.1 Global Gamma-Butyrolactone Market 2020 - 2024

Historic Market Size - Data Table on Global Gamma-Butyrolactone Market 2020 - 2024 ($ million)

5.2 Type segment analysis 2020 - 2024

Historic Market Size - Type Segment 2020 - 2024 ($ million)

5.3 Application segment analysis 2020 - 2024

Historic Market Size - Application Segment 2020 - 2024 ($ million)

5.4 Grade Type segment analysis 2020 - 2024

Historic Market Size - Grade Type Segment 2020 - 2024 ($ million)

5.5 Geography segment analysis 2020 - 2024

Historic Market Size - Geography Segment 2020 - 2024 ($ million)

5.6 Country segment analysis 2020 - 2024

Historic Market Size - Country Segment 2020 - 2024 ($ million)

6. Qualitative Analysis

6.1 Impact of AI on Global Gamma-Butyrolactone Market

6.2 Impact of Geopolitical Conflict on Global Gamma-Butyrolactone Market

7. Five Forces Analysis

7.1 Five forces summary

Five forces analysis - Comparison between 2025 and 2030

7.2 Bargaining power of buyers

Bargaining power of buyers - Impact of key factors 2025 and 2030

7.3 Bargaining power of suppliers

Bargaining power of suppliers - Impact of key factors in 2025 and 2030

7.4 Threat of new entrants

Threat of new entrants - Impact of key factors in 2025 and 2030

7.5 Threat of substitutes

Threat of substitutes - Impact of key factors in 2025 and 2030

7.6 Threat of rivalry

Threat of rivalry - Impact of key factors in 2025 and 2030

7.7 Market condition

Chart on Market condition - Five forces 2025 and 2030

8. Market Segmentation by Type

8.1 Market segments

Chart on Type - Market share 2025-2030 (%)
Data Table on Type - Market share 2025-2030 (%)

8.2 Comparison by Type

Chart on Comparison by Type
Data Table on Comparison by Type

8.3 Dehydrogenation of 1 4 butanediol - Market size and forecast 2025-2030

Chart on Dehydrogenation of 1 4 butanediol - Market size and forecast 2025-2030 ($ million)
Data Table on Dehydrogenation of 1 4 butanediol - Market size and forecast 2025-2030 ($ million)
Chart on Dehydrogenation of 1 4 butanediol - Year-over-year growth 2025-2030 (%)
Data Table on Dehydrogenation of 1 4 butanediol - Year-over-year growth 2025-2030 (%)

8.4 Hydrogenation of maleic anhydride - Market size and forecast 2025-2030

Chart on Hydrogenation of maleic anhydride - Market size and forecast 2025-2030 ($ million)
Data Table on Hydrogenation of maleic anhydride - Market size and forecast 2025-2030 ($ million)
Chart on Hydrogenation of maleic anhydride - Year-over-year growth 2025-2030 (%)
Data Table on Hydrogenation of maleic anhydride - Year-over-year growth 2025-2030 (%)

8.5 Market opportunity by Type

Market opportunity by Type ($ million)
Data Table on Market opportunity by Type ($ million)

9. Market Segmentation by Application

9.1 Market segments

Chart on Application - Market share 2025-2030 (%)
Data Table on Application - Market share 2025-2030 (%)

9.2 Comparison by Application

Chart on Comparison by Application
Data Table on Comparison by Application

9.3 Batteries and capacitors - Market size and forecast 2025-2030

Chart on Batteries and capacitors - Market size and forecast 2025-2030 ($ million)
Data Table on Batteries and capacitors - Market size and forecast 2025-2030 ($ million)
Chart on Batteries and capacitors - Year-over-year growth 2025-2030 (%)
Data Table on Batteries and capacitors - Year-over-year growth 2025-2030 (%)

9.4 Industrial solvents - Market size and forecast 2025-2030

Chart on Industrial solvents - Market size and forecast 2025-2030 ($ million)
Data Table on Industrial solvents - Market size and forecast 2025-2030 ($ million)
Chart on Industrial solvents - Year-over-year growth 2025-2030 (%)
Data Table on Industrial solvents - Year-over-year growth 2025-2030 (%)

9.5 Pharmaceuticals - Market size and forecast 2025-2030

Chart on Pharmaceuticals - Market size and forecast 2025-2030 ($ million)
Data Table on Pharmaceuticals - Market size and forecast 2025-2030 ($ million)
Chart on Pharmaceuticals - Year-over-year growth 2025-2030 (%)
Data Table on Pharmaceuticals - Year-over-year growth 2025-2030 (%)

9.6 Chemical synthesis - Market size and forecast 2025-2030

Chart on Chemical synthesis - Market size and forecast 2025-2030 ($ million)
Data Table on Chemical synthesis - Market size and forecast 2025-2030 ($ million)
Chart on Chemical synthesis - Year-over-year growth 2025-2030 (%)
Data Table on Chemical synthesis - Year-over-year growth 2025-2030 (%)

9.7 Agrochemicals - Market size and forecast 2025-2030

Chart on Agrochemicals - Market size and forecast 2025-2030 ($ million)
Data Table on Agrochemicals - Market size and forecast 2025-2030 ($ million)
Chart on Agrochemicals - Year-over-year growth 2025-2030 (%)
Data Table on Agrochemicals - Year-over-year growth 2025-2030 (%)

9.8 Market opportunity by Application

Market opportunity by Application ($ million)
Data Table on Market opportunity by Application ($ million)

10. Market Segmentation by Grade Type

10.1 Market segments

Chart on Grade Type - Market share 2025-2030 (%)
Data Table on Grade Type - Market share 2025-2030 (%)

10.2 Comparison by Grade Type

Chart on Comparison by Grade Type
Data Table on Comparison by Grade Type

10.3 Industrial grade - Market size and forecast 2025-2030

Chart on Industrial grade - Market size and forecast 2025-2030 ($ million)
Data Table on Industrial grade - Market size and forecast 2025-2030 ($ million)
Chart on Industrial grade - Year-over-year growth 2025-2030 (%)
Data Table on Industrial grade - Year-over-year growth 2025-2030 (%)

10.4 Medical grade - Market size and forecast 2025-2030

Chart on Medical grade - Market size and forecast 2025-2030 ($ million)
Data Table on Medical grade - Market size and forecast 2025-2030 ($ million)
Chart on Medical grade - Year-over-year growth 2025-2030 (%)
Data Table on Medical grade - Year-over-year growth 2025-2030 (%)

10.5 Electronic grade - Market size and forecast 2025-2030

Chart on Electronic grade - Market size and forecast 2025-2030 ($ million)
Data Table on Electronic grade - Market size and forecast 2025-2030 ($ million)
Chart on Electronic grade - Year-over-year growth 2025-2030 (%)
Data Table on Electronic grade - Year-over-year growth 2025-2030 (%)

10.6 Market opportunity by Grade Type

Market opportunity by Grade Type ($ million)
Data Table on Market opportunity by Grade Type ($ million)

11. Customer Landscape

11.1 Customer landscape overview

Analysis of price sensitivity, lifecycle, customer purchase basket, adoption rates, and purchase criteria

12. Geographic Landscape

12.1 Geographic segmentation

Chart on Market share by geography 2025-2030 (%)
Data Table on Market share by geography 2025-2030 (%)

12.2 Geographic comparison

Chart on Geographic comparison
Data Table on Geographic comparison

12.3 APAC - Market size and forecast 2025-2030

Chart on APAC - Market size and forecast 2025-2030 ($ million)
Data Table on APAC - Market size and forecast 2025-2030 ($ million)
Chart on APAC - Year-over-year growth 2025-2030 (%)
Data Table on APAC - Year-over-year growth 2025-2030 (%)
Chart on Regional Comparison - APAC
Data Table on Regional Comparison - APAC

12.3.1 China - Market size and forecast 2025-2030

Chart on China - Market size and forecast 2025-2030 ($ million)
Data Table on China - Market size and forecast 2025-2030 ($ million)
Chart on China - Year-over-year growth 2025-2030 (%)
Data Table on China - Year-over-year growth 2025-2030 (%)

12.3.2 India - Market size and forecast 2025-2030

Chart on India - Market size and forecast 2025-2030 ($ million)
Data Table on India - Market size and forecast 2025-2030 ($ million)
Chart on India - Year-over-year growth 2025-2030 (%)
Data Table on India - Year-over-year growth 2025-2030 (%)

12.3.3 Japan - Market size and forecast 2025-2030

Chart on Japan - Market size and forecast 2025-2030 ($ million)
Data Table on Japan - Market size and forecast 2025-2030 ($ million)
Chart on Japan - Year-over-year growth 2025-2030 (%)
Data Table on Japan - Year-over-year growth 2025-2030 (%)

12.3.4 South Korea - Market size and forecast 2025-2030

Chart on South Korea - Market size and forecast 2025-2030 ($ million)
Data Table on South Korea - Market size and forecast 2025-2030 ($ million)
Chart on South Korea - Year-over-year growth 2025-2030 (%)
Data Table on South Korea - Year-over-year growth 2025-2030 (%)

12.3.5 Indonesia - Market size and forecast 2025-2030

Chart on Indonesia - Market size and forecast 2025-2030 ($ million)
Data Table on Indonesia - Market size and forecast 2025-2030 ($ million)
Chart on Indonesia - Year-over-year growth 2025-2030 (%)
Data Table on Indonesia - Year-over-year growth 2025-2030 (%)

12.3.6 Thailand - Market size and forecast 2025-2030

Chart on Thailand - Market size and forecast 2025-2030 ($ million)
Data Table on Thailand - Market size and forecast 2025-2030 ($ million)
Chart on Thailand - Year-over-year growth 2025-2030 (%)
Data Table on Thailand - Year-over-year growth 2025-2030 (%)

12.4 Europe - Market size and forecast 2025-2030

Chart on Europe - Market size and forecast 2025-2030 ($ million)
Data Table on Europe - Market size and forecast 2025-2030 ($ million)
Chart on Europe - Year-over-year growth 2025-2030 (%)
Data Table on Europe - Year-over-year growth 2025-2030 (%)
Chart on Regional Comparison - Europe
Data Table on Regional Comparison - Europe

12.4.1 Germany - Market size and forecast 2025-2030

Chart on Germany - Market size and forecast 2025-2030 ($ million)
Data Table on Germany - Market size and forecast 2025-2030 ($ million)
Chart on Germany - Year-over-year growth 2025-2030 (%)
Data Table on Germany - Year-over-year growth 2025-2030 (%)

12.4.2 France - Market size and forecast 2025-2030

Chart on France - Market size and forecast 2025-2030 ($ million)
Data Table on France - Market size and forecast 2025-2030 ($ million)
Chart on France - Year-over-year growth 2025-2030 (%)
Data Table on France - Year-over-year growth 2025-2030 (%)

12.4.3 UK - Market size and forecast 2025-2030

Chart on UK - Market size and forecast 2025-2030 ($ million)
Data Table on UK - Market size and forecast 2025-2030 ($ million)
Chart on UK - Year-over-year growth 2025-2030 (%)
Data Table on UK - Year-over-year growth 2025-2030 (%)

12.4.4 Italy - Market size and forecast 2025-2030

Chart on Italy - Market size and forecast 2025-2030 ($ million)
Data Table on Italy - Market size and forecast 2025-2030 ($ million)
Chart on Italy - Year-over-year growth 2025-2030 (%)
Data Table on Italy - Year-over-year growth 2025-2030 (%)

12.4.5 Russia - Market size and forecast 2025-2030

Chart on Russia - Market size and forecast 2025-2030 ($ million)
Data Table on Russia - Market size and forecast 2025-2030 ($ million)
Chart on Russia - Year-over-year growth 2025-2030 (%)
Data Table on Russia - Year-over-year growth 2025-2030 (%)

12.4.6 Spain - Market size and forecast 2025-2030

Chart on Spain - Market size and forecast 2025-2030 ($ million)
Data Table on Spain - Market size and forecast 2025-2030 ($ million)
Chart on Spain - Year-over-year growth 2025-2030 (%)
Data Table on Spain - Year-over-year growth 2025-2030 (%)

12.5 North America - Market size and forecast 2025-2030

Chart on North America - Market size and forecast 2025-2030 ($ million)
Data Table on North America - Market size and forecast 2025-2030 ($ million)
Chart on North America - Year-over-year growth 2025-2030 (%)
Data Table on North America - Year-over-year growth 2025-2030 (%)
Chart on Regional Comparison - North America
Data Table on Regional Comparison - North America

12.5.1 US - Market size and forecast 2025-2030

Chart on US - Market size and forecast 2025-2030 ($ million)
Data Table on US - Market size and forecast 2025-2030 ($ million)
Chart on US - Year-over-year growth 2025-2030 (%)
Data Table on US - Year-over-year growth 2025-2030 (%)

12.5.2 Canada - Market size and forecast 2025-2030

Chart on Canada - Market size and forecast 2025-2030 ($ million)
Data Table on Canada - Market size and forecast 2025-2030 ($ million)
Chart on Canada - Year-over-year growth 2025-2030 (%)
Data Table on Canada - Year-over-year growth 2025-2030 (%)

12.5.3 Mexico - Market size and forecast 2025-2030

Chart on Mexico - Market size and forecast 2025-2030 ($ million)
Data Table on Mexico - Market size and forecast 2025-2030 ($ million)
Chart on Mexico - Year-over-year growth 2025-2030 (%)
Data Table on Mexico - Year-over-year growth 2025-2030 (%)

12.6 South America - Market size and forecast 2025-2030

Chart on South America - Market size and forecast 2025-2030 ($ million)
Data Table on South America - Market size and forecast 2025-2030 ($ million)
Chart on South America - Year-over-year growth 2025-2030 (%)
Data Table on South America - Year-over-year growth 2025-2030 (%)
Chart on Regional Comparison - South America
Data Table on Regional Comparison - South America

12.6.1 Brazil - Market size and forecast 2025-2030

Chart on Brazil - Market size and forecast 2025-2030 ($ million)
Data Table on Brazil - Market size and forecast 2025-2030 ($ million)
Chart on Brazil - Year-over-year growth 2025-2030 (%)
Data Table on Brazil - Year-over-year growth 2025-2030 (%)

12.6.2 Argentina - Market size and forecast 2025-2030

Chart on Argentina - Market size and forecast 2025-2030 ($ million)
Data Table on Argentina - Market size and forecast 2025-2030 ($ million)
Chart on Argentina - Year-over-year growth 2025-2030 (%)
Data Table on Argentina - Year-over-year growth 2025-2030 (%)

12.6.3 Chile - Market size and forecast 2025-2030

Chart on Chile - Market size and forecast 2025-2030 ($ million)
Data Table on Chile - Market size and forecast 2025-2030 ($ million)
Chart on Chile - Year-over-year growth 2025-2030 (%)
Data Table on Chile - Year-over-year growth 2025-2030 (%)

12.7 Middle East and Africa - Market size and forecast 2025-2030

Chart on Middle East and Africa - Market size and forecast 2025-2030 ($ million)
Data Table on Middle East and Africa - Market size and forecast 2025-2030 ($ million)
Chart on Middle East and Africa - Year-over-year growth 2025-2030 (%)
Data Table on Middle East and Africa - Year-over-year growth 2025-2030 (%)
Chart on Regional Comparison - Middle East and Africa
Data Table on Regional Comparison - Middle East and Africa

12.7.1 Saudi Arabia - Market size and forecast 2025-2030

Chart on Saudi Arabia - Market size and forecast 2025-2030 ($ million)
Data Table on Saudi Arabia - Market size and forecast 2025-2030 ($ million)
Chart on Saudi Arabia - Year-over-year growth 2025-2030 (%)
Data Table on Saudi Arabia - Year-over-year growth 2025-2030 (%)

12.7.2 UAE - Market size and forecast 2025-2030

Chart on UAE - Market size and forecast 2025-2030 ($ million)
Data Table on UAE - Market size and forecast 2025-2030 ($ million)
Chart on UAE - Year-over-year growth 2025-2030 (%)
Data Table on UAE - Year-over-year growth 2025-2030 (%)

12.7.3 South Africa - Market size and forecast 2025-2030

Chart on South Africa - Market size and forecast 2025-2030 ($ million)
Data Table on South Africa - Market size and forecast 2025-2030 ($ million)
Chart on South Africa - Year-over-year growth 2025-2030 (%)
Data Table on South Africa - Year-over-year growth 2025-2030 (%)

12.7.4 Turkey - Market size and forecast 2025-2030

Chart on Turkey - Market size and forecast 2025-2030 ($ million)
Data Table on Turkey - Market size and forecast 2025-2030 ($ million)
Chart on Turkey - Year-over-year growth 2025-2030 (%)
Data Table on Turkey - Year-over-year growth 2025-2030 (%)

12.7.5 Egypt - Market size and forecast 2025-2030

Chart on Egypt - Market size and forecast 2025-2030 ($ million)
Data Table on Egypt - Market size and forecast 2025-2030 ($ million)
Chart on Egypt - Year-over-year growth 2025-2030 (%)
Data Table on Egypt - Year-over-year growth 2025-2030 (%)

12.8 Market opportunity by geography

Market opportunity by geography ($ million)
Data Tables on Market opportunity by geography ($ million)

13. Drivers, Challenges, and Opportunity

13.1 Market drivers

Expansion of lithium-ion battery and electric vehicle supply chain
Growing pharmaceutical industry demand
Expanding industrial and chemical applications

13.2 Market challenges

Regulatory compliance and legal oversight challenges
Raw material price volatility
Competition from substitute solvents

13.3 Impact of drivers and challenges

Impact of drivers and challenges in 2025 and 2030

13.4 Market opportunities

Surge in high-purity demand for lithium-ion battery electrolytes
Rising demand from pharmaceuticals and specialty chemicals
Rising focus on process efficiency and cost optimization

14. Competitive Landscape

14.1 Overview

14.2

Overview on criticality of inputs and factors of differentiation

14.3 Landscape disruption

Overview on factors of disruption

14.4 Industry risks

Impact of key risks on business

15. Competitive Analysis

15.1 Companies profiled

Companies covered

15.2 Company ranking index

15.3 Market positioning of companies

Matrix on companies position and classification

15.4 Ashland Inc.

Ashland Inc. - Overview
Ashland Inc. - Business segments
Ashland Inc. - Key news
Ashland Inc. - Key offerings
Ashland Inc. - Segment focus
SWOT

15.5 BASF SE

BASF SE - Overview
BASF SE - Business segments
BASF SE - Key news
BASF SE - Key offerings
BASF SE - Segment focus
SWOT

15.6 Dairen Chemical Corp.

Dairen Chemical Corp. - Overview
Dairen Chemical Corp. - Product / Service
Dairen Chemical Corp. - Key offerings
SWOT

15.7 LGC Ltd.

LGC Ltd. - Overview
LGC Ltd. - Product / Service
LGC Ltd. - Key offerings
SWOT

15.8 LyondellBasell Industries N.V.

LyondellBasell Industries N.V. - Overview
LyondellBasell Industries N.V. - Business segments
LyondellBasell Industries N.V. - Key news
LyondellBasell Industries N.V. - Key offerings
LyondellBasell Industries N.V. - Segment focus
SWOT

15.9 Merck KGaA

Merck KGaA - Overview
Merck KGaA - Business segments
Merck KGaA - Key news
Merck KGaA - Key offerings
Merck KGaA - Segment focus
SWOT

15.10 Muby Chem Ltd.

Muby Chem Ltd. - Overview
Muby Chem Ltd. - Product / Service
Muby Chem Ltd. - Key offerings
SWOT

15.11 Santa Cruz Biotechnology Inc.

Santa Cruz Biotechnology Inc. - Overview
Santa Cruz Biotechnology Inc. - Product / Service
Santa Cruz Biotechnology Inc. - Key offerings
SWOT

15.12 Shandong Lixing Chemical Co.

Shandong Lixing Chemical Co. - Overview
Shandong Lixing Chemical Co. - Product / Service
Shandong Lixing Chemical Co. - Key offerings
SWOT

15.13 Simson Pharma Ltd.

Simson Pharma Ltd. - Overview
Simson Pharma Ltd. - Product / Service
Simson Pharma Ltd. - Key offerings
SWOT

15.14 Taj Pharmaceutical Ltd.

Taj Pharmaceutical Ltd. - Overview
Taj Pharmaceutical Ltd. - Product / Service
Taj Pharmaceutical Ltd. - Key offerings
SWOT

15.15 The Mitsubishi Chemical Group

The Mitsubishi Chemical Group - Overview
The Mitsubishi Chemical Group - Business segments
The Mitsubishi Chemical Group - Key news
The Mitsubishi Chemical Group - Key offerings
The Mitsubishi Chemical Group - Segment focus
SWOT

15.16 Thermo Fisher Scientific Inc.

Thermo Fisher Scientific Inc. - Overview
Thermo Fisher Scientific Inc. - Business segments
Thermo Fisher Scientific Inc. - Key news
Thermo Fisher Scientific Inc. - Key offerings
Thermo Fisher Scientific Inc. - Segment focus
SWOT

15.17 TNJ Chemical Industry Co. Ltd.

TNJ Chemical Industry Co. Ltd. - Overview
TNJ Chemical Industry Co. Ltd. - Product / Service
TNJ Chemical Industry Co. Ltd. - Key offerings
SWOT

15.18 Tokyo Chemical Industry Co.

Tokyo Chemical Industry Co. - Overview
Tokyo Chemical Industry Co. - Product / Service
Tokyo Chemical Industry Co. - Key offerings
SWOT

16. Appendix

16.1 Scope of the report

Market definition
Objectives
Notes and caveats

16.2 Inclusions and exclusions checklist

Inclusions checklist
Exclusions checklist

16.3 Currency conversion rates for US$

16.4 Research methodology

16.5 Data procurement

Information sources

16.6 Data validation

16.7 Validation techniques employed for market sizing

16.8 Data synthesis

16.9 360 degree market analysis

16.10 List of abbreviations

Research Methodology

Technavio presents a detailed picture of the market by way of study, synthesis, and summation of data from multiple sources. The analysts have presented the various facets of the market with a particular focus on identifying the key industry influencers. The data thus presented is comprehensive, reliable, and the result of extensive research, both primary and secondary.

INFORMATION SOURCES

Primary sources

  • Manufacturers and suppliers
  • Channel partners
  • Industry experts
  • Strategic decision makers

Secondary sources

  • Industry journals and periodicals
  • Government data
  • Financial reports of key industry players
  • Historical data
  • Press releases

DATA ANALYSIS

Data Synthesis

  • Collation of data
  • Estimation of key figures
  • Analysis of derived insights

Data Validation

  • Triangulation with data models
  • Reference against proprietary databases
  • Corroboration with industry experts

REPORT WRITING

Qualitative

  • Market drivers
  • Market challenges
  • Market trends
  • Five forces analysis

Quantitative

  • Market size and forecast
  • Market segmentation
  • Geographical insights
  • Competitive landscape

Interested in this report?

Get your sample now to see our research methodology and insights!

Download Now

Frequently Asked Questions

Gamma-butyrolactone market growth will increase by USD 837.6 million during 2026-2030.

The Gamma-butyrolactone market is expected to grow at a CAGR of 5.9% during 2026-2030.

Gamma-butyrolactone market is segmented by Type (Dehydrogenation of 1 4 butanediol, Hydrogenation of maleic anhydride) Application (Batteries and capacitors, Industrial solvents, Pharmaceuticals, Chemical synthesis, Agrochemicals) Grade type (Industrial grade, Medical grade, Electronic grade)

Ashland Inc., BASF SE, Central Drug House Pvt. Ltd., Dairen Chemical Corp., Haihang Industry Co. Ltd., Henan GP Chemicals Co. Ltd., LGC Ltd., LyondellBasell Industries N.V., Merck KGaA, Muby Chem Ltd., Santa Cruz Biotechnology Inc., Shandong Lixing Chemical Co., Simson Pharma Ltd., Spectrum Chemical Mfg. Corp., Taj Pharmaceutical Ltd., The Mitsubishi Chemical Group, Thermo Fisher Scientific Inc., TNJ Chemical Industry Co. Ltd., Tokyo Chemical Industry Co. are a few of the key vendors in the Gamma-butyrolactone market.

APAC will register the highest growth rate of 64.3% among the other regions. Therefore, the Gamma-butyrolactone market in APAC is expected to garner significant business opportunities for the vendors during the forecast period.

China, India, Japan, South Korea, Indonesia, Thailand, Germany, France, UK, Italy, Russia, Spain, US, Canada, Mexico, Brazil, Argentina, Chile, Saudi Arabia, UAE, South Africa, Turkey, Egypt

  • Expansion of lithium-ion battery and electric vehicle supply chain is the driving factor this market.

The Gamma-butyrolactone market vendors should focus on grabbing business opportunities from the Type segment as it accounted for the largest market share in the base year.
RIA - Research AI Assistant
Ask RIA