Gas Chromatography (Gc) Market Analysis, Size, and Forecast 2024-2028: North America (US and Canada), Europe (France and Germany), Middle East and Africa (South Africa), APAC (China, India, Japan, and South Korea), and Rest of World (ROW)

Gas Chromatography (Gc) Market Analysis, Size, and Forecast 2024-2028:
North America (US and Canada), Europe (France and Germany), Middle East and Africa (South Africa), APAC (China, India, Japan, and South Korea), and Rest of World (ROW)

Published: Jul 2024 163 Pages SKU: IRTNTR75757

Market Overview at a Glance

$1.15 B
Market Opportunity
7.35%
CAGR
6.71
YoY growth 2023-2024(%)

Gas Chromatography (Gc) Market Size 2024-2028

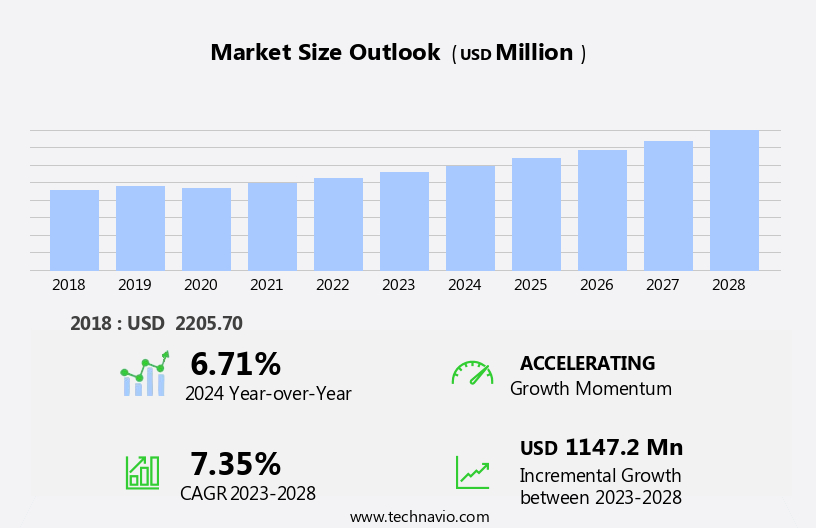
The gas chromatography (gc) market size is forecast to increase by USD 1.15 billion, at a CAGR of 7.35% between 2023 and 2028.

  • The market experiences robust growth, driven by expanding applications across various industries, including pharmaceuticals, food and beverage, and environmental analysis. Technological advancements in chromatography, such as improved separation efficiency, faster analysis times, and enhanced sensitivity, further fuel market expansion. However, the lack of skilled technicians poses a significant challenge, as the complex nature of GC analysis requires specialized expertise. Regulatory hurdles also impact adoption, with stringent regulations governing the use of GC in certain applications, such as pharmaceutical and food industries.
  • Supply chain inconsistencies, including raw material availability and price fluctuations, temper growth potential. Companies seeking to capitalize on market opportunities must invest in training and development programs to address the skills gap and navigate regulatory requirements effectively. Strategic partnerships and collaborations with academic institutions and industry associations can also help mitigate supply chain risks and ensure a steady supply of skilled labor.

What will be the Size of the Gas Chromatography (Gc) Market during the forecast period?

Gas Chromatography (Gc) Market Size

Explore in-depth regional segment analysis with market size data - historical 2018-2022 and forecasts 2024-2028 - in the full report.  
Request Free Sample

The market continues to evolve, driven by the diverse applications across various sectors. Chemical analysis and quantitative measurement remain at the core of GC's significance, with clinical chemistry and data processing playing essential roles in healthcare and research. Gas chromatography systems are integral to environmental monitoring, ensuring regulatory compliance and enabling the identification of pollutants. Injection techniques and chromatogram analysis are crucial components of GC, facilitating chromatographic separation and peak identification. Thermogravimetric analysis (TGA) complements GC, providing valuable information on material decomposition and property changes. The petrochemical industry relies on GC for process monitoring and compound identification.

Packed columns, calibration curves, and carrier gases are integral to GC, with sample preparation and chromatographic software optimizing the analytical process. GC finds applications in forensic science, scientific research, and materials science, contributing to quality assurance and quality control in laboratories. Capillary columns, analytical instruments, and mass spectrometry (MS) enhance GC's capabilities, enabling validation studies and method development. The biopharmaceutical industry, polymer science, and other sectors benefit from GC's ability to analyze analytical standards and identify compounds with high detector sensitivity. The continuous unfolding of market activities and evolving patterns in the GC market reflect the dynamic nature of this field, with ongoing research and development ensuring its relevance and importance in various industries.

How is this Gas Chromatography (Gc) Industry segmented?

The gas chromatography (gc) industry research report provides comprehensive data (region-wise segment analysis), with forecasts and estimates in "USD million" for the period 2024-2028, as well as historical data from 2018-2022 for the following segments.

  • Product
    • Consumables and accessories
    • Instruments
  • End-user
    • Pharmaceuticals and biotechnology
    • Food and beverages
    • Academic and research institutes
    • Others
  • Instruments
    • Systems
    • Detectors
  • Geography
    • North America
      • US
      • Canada
    • Europe
      • France
      • Germany
    • Middle East and Africa
      • South Africa
    • APAC
      • China
      • India
      • Japan
      • South Korea
    • Rest of World (ROW)

By Product Insights

The consumables and accessories segment is estimated to witness significant growth during the forecast period.

Gas chromatography (GC) is a widely used analytical technique for separating and identifying volatile and semi-volatile compounds. This method is integral to various industries, including pharmaceuticals, clinical chemistry, environmental monitoring, and scientific research. In the realm of pharmaceuticals, GC is employed for purity and contamination analysis, component testing, and compositional analysis of crude oils. In the field of clinical chemistry, GC plays a crucial role in the detection and quantification of metabolites and biomarkers. Environmental monitoring is another domain where GC shines, with applications ranging from air and water quality analysis to the identification of volatile organic compounds.

Regulatory compliance is a significant driver for the adoption of GC, as it enables organizations to meet stringent industry standards. Gas chromatography systems consist of several components, such as injection techniques, chromatographic separation, data processing, and detector systems. Injection techniques include split, splitless, and programmed temperature vaporization. Chromatographic separation is facilitated by packed or capillary columns, while data processing involves the analysis of chromatograms using chromatographic software. Thermogravimetric analysis (TGA) is a complementary technique to GC, used for the analysis of non-volatile samples. The petrochemical industry relies heavily on GC for the analysis of complex hydrocarbon mixtures.

Sample preparation is a critical aspect of GC, with various techniques used to ensure accurate and reliable results. Calibration curves and reference materials are essential for ensuring the accuracy and precision of quantitative analysis. Qualitative analysis is another application of GC, which involves the identification of compounds based on their retention times and detector responses. Mass spectrometry (MS) is often used in conjunction with GC for compound identification and confirmation. GC is also used extensively in forensic science for the analysis of illicit substances, and in materials science for the characterization of polymers and other materials.

Detector sensitivity is a critical factor in the selection of GC systems for various applications. In the biopharmaceutical industry, GC is used for the analysis of complex mixtures, such as those found in biological samples. Validation studies and method development are essential for ensuring the accuracy and reliability of GC methods in this industry. Gas chromatography consumables and accessories are essential for the effective operation of GC systems. These include items such as carrier gases, ferrules, nuts, tubing, inlet liners, syringes, and septa. Agilent Technologies Inc., is one of the companies that offers a wide range of gas chromatography supplies and consumables.

In conclusion, the market for gas chromatography consumables and accessories is driven by the diverse applications of GC in various industries. The need for accurate and reliable analysis, regulatory compliance, and the development of new applications continue to fuel the growth of this market.

Gas Chromatography (Gc) Market Size

Request Free Sample

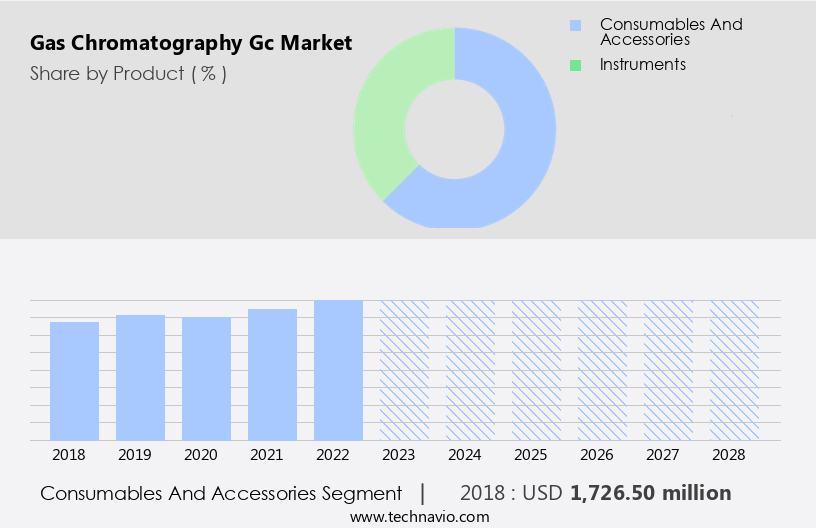
The Consumables and accessories segment was valued at USD 1.73 billion in 2018 and showed a gradual increase during the forecast period.

Regional Analysis

North America is estimated to contribute 48% to the growth of the global market during the forecast period.Technavio's analysts have elaborately explained the regional trends and drivers that shape the market during the forecast period.

Gas Chromatography (Gc) Market Share by Geography

 Request Free Sample

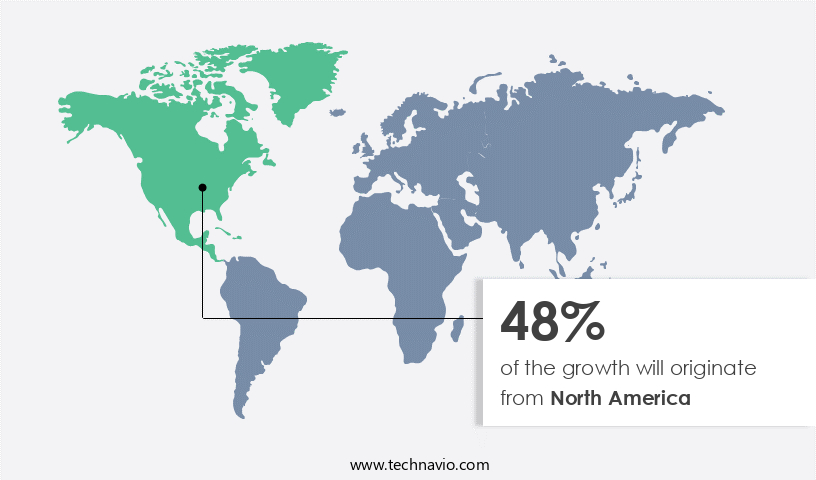
The North American market for gas chromatography (GC) systems experiences significant growth, driven by the increased adoption in end-user industries such as food and the biotechnology and pharmaceutical sectors. In the US, the market is propelled by the widespread use of GC for drug discovery and quantitative analysis. Portable GC systems are gaining popularity due to their convenience and ease of use, further fueling market expansion. Canada contributes to the market's growth as well, with research laboratories and government bodies like Defence Research and Development Canada (DRDC) advancing chromatographic techniques and approaches. In the realm of clinical chemistry, GC plays a pivotal role in diagnostic analysis, ensuring regulatory compliance.

Environmental monitoring applications continue to expand, with GC systems providing accurate and reliable data processing for air, water, and soil analysis. Injection techniques and chromatographic separation techniques have evolved, enabling efficient sample preparation and precise compound identification. Capillary columns and packed columns are widely used for GC analysis, offering advantages in terms of efficiency and resolution. Calibration curves and analytical standards are essential for ensuring accurate quantitative analysis. Thermogravimetric analysis (TGA) is a complementary technique used in materials science and polymer science for compound identification and detector sensitivity enhancement. Gas chromatography systems are integral to scientific research, forensic science, and process monitoring in various industries.

Chromatographic software and mass spectrometry (MS) are frequently used in conjunction with GC for enhanced data acquisition and compound identification. Quality assurance and quality control are crucial aspects of GC applications, with laboratories relying on GC systems for ensuring product consistency and compliance with regulatory standards. In the petrochemical industry, GC is used for process monitoring and compound identification, ensuring the quality and purity of petrochemical products. Validation studies and method development are essential for maintaining the accuracy and reliability of GC systems in various applications. The biopharmaceutical industry also benefits from GC systems, with GC-MS used for the identification and quantification of biomolecules and impurities in pharmaceutical products.

Market Dynamics

Our researchers analyzed the data with 2023 as the base year, along with the key drivers, trends, and challenges. A holistic analysis of drivers will help companies refine their marketing strategies to gain a competitive advantage.

The Gas Chromatography market size and forecast, highlighting B2B gas chromatography solutions for pharmaceuticals and food safety. Leverage AI-powered gas chromatography systems and GC-MS for pharmaceutical testing to ensure compliance. Gas chromatography for environmental monitoring and food safety testing with GC address regulatory needs. Explore cloud-based GC data analysis and portable gas chromatography solutions for flexibility. GC market growth opportunities 2025 include gas chromatography in petrochemical analysis and forensic applications of GC. Cost-effective GC systems for SMEs and automated gas chromatography instruments enhance efficiency. Gas chromatography market challenges like high costs are offset by GC adoption trends in biotech and green chemistry in gas chromatography.

What are the key market drivers leading to the rise in the adoption of Gas Chromatography (Gc) Industry?

  • The significant expansion of applications for gas chromatography is the primary driving force behind the market's growth. 
  • Gas chromatography (GC) is a widely used analytical technique in various industries, including the biopharmaceutical sector and materials science, for method development and compound identification. The integration of mass spectrometry (MS) with GC has significantly enhanced the capabilities of these analytical instruments. Capillary columns, a key component of GC, enable high-resolution separations and increased detector sensitivity. Validation studies are crucial in ensuring the accuracy and reliability of GC results. In the biopharmaceutical industry, GC-MS is employed for the analysis of complex mixtures, such as drug formulations and impurities. In materials science, GC is used to analyze polymers and identify their components.
  • The demand for GC in the industry is driven by the need for rapid compound identification and quantification. Portable GC instruments have gained popularity due to their compact size, making them suitable for on-site analysis in various applications, including environmental monitoring and polymer science research. The increasing focus on analytical standards and the need for precise and accurate results further boosts the market growth.

What are the market trends shaping the Gas Chromatography (Gc) Industry?

  • Chromatography, a field that has seen significant technological advances, is currently a prominent market trend. The ongoing innovation in this technique offers promising opportunities for industry growth.
  • The market for gas chromatography (GC) systems experiences significant growth due to the increasing demand for precise and efficient chemical analysis. This technology is crucial in various industries, including clinical chemistry, environmental monitoring, and the petrochemical industry, for quantitative analysis. The need for regulatory compliance and high-quality results drives the adoption of advanced and automated GC systems. Automated injection techniques and data processing capabilities enhance workflow solutions, ensuring accuracy and reducing costs. In sectors such as biotechnology and pharmaceuticals, the adoption of automated GC systems has been rapid, improving research efficiency and enabling applications in cancer research, drug screening, and cytotoxicity testing.
  • To maintain certification and meet industry standards, laboratories are increasingly turning to automation for their GC systems. Thermogravimetric analysis (TGA) is another application of GC that offers valuable insights into the thermal behavior of materials, further expanding its utility.

What challenges does the Gas Chromatography (Gc) Industry face during its growth?

  • The insufficient supply of competent technicians poses a significant obstacle to the expansion and growth of the industry. 
  • Gas chromatography (GC) is a widely used analytical technique in scientific research and various industries, including forensic science and environmental science. In this process, packed columns are utilized to separate complex mixtures of compounds based on their affinity to a stationary phase. The separated components are then detected through various detectors, such as flame ionization detectors or mass spectrometers. Sample preparation is a crucial step in GC analysis, ensuring accurate and reliable results. Calibration curves are generated to quantify the amount of each compound in a sample based on the peak area. Chromatographic software is employed to process and analyze the data obtained from GC analysis, facilitating peak identification and quantification.
  • The expertise of professionals, including gas chromatography technicians and chemists, is essential for the successful implementation of GC analysis. These professionals must possess a deep understanding of GC principles, as well as other analytical techniques like high-pressure liquid chromatography (HPLC) and titration methods. The limited pool of individuals with this knowledge restricts the market's growth potential. In summary, the application of gas chromatography in scientific research and various industries requires a skilled workforce and advanced tools to ensure accurate and reliable results. The expertise of professionals in GC analysis, coupled with the use of chromatographic software, plays a significant role in the successful implementation of this technique.

Exclusive Customer Landscape

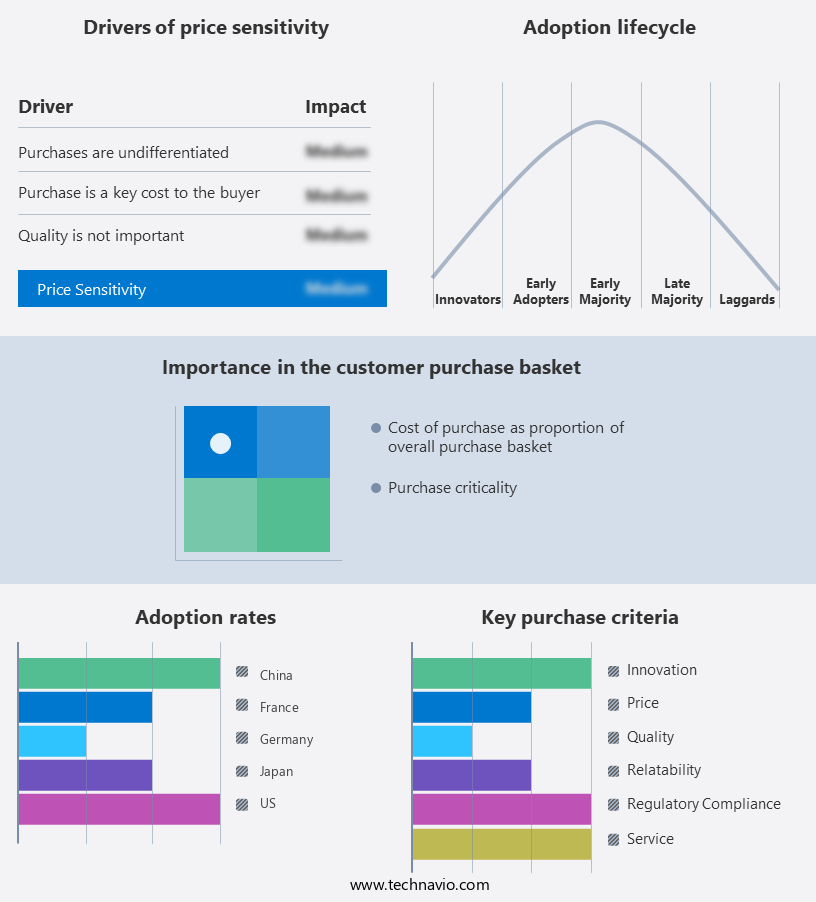
The gas chromatography (gc) market forecasting report includes the adoption lifecycle of the market, covering from the innovator's stage to the laggard's stage. It focuses on adoption rates in different regions based on penetration. Furthermore, the gas chromatography (gc) market report also includes key purchase criteria and drivers of price sensitivity to help companies evaluate and develop their market growth analysis strategies.

Gas Chromatography (Gc) Market Share by Geography

 Customer Landscape

Key Companies & Market Insights

Companies are implementing various strategies, such as strategic alliances, gas chromatography (gc) market forecast, partnerships, mergers and acquisitions, geographical expansion, and product/service launches, to enhance their presence in the industry.

Agilent Technologies Inc. - The company specializes in providing advanced gas chromatography solutions, featuring the Intuvo 9000 GC system, 8890 GC system, and 990 Micro GC system. These systems deliver high-performance and accuracy in separating and analyzing complex mixtures, enhancing research and development initiatives. 

The industry research and growth report includes detailed analyses of the competitive landscape of the market and information about key companies, including:

  • Agilent Technologies Inc.
  • Avantor Inc.
  • Bruker Corp.
  • Chromatec SDO JSC
  • Chromtech GmbH
  • DataApex Ltd.
  • Ellutia Ltd.
  • GERSTEL GmbH Co.KG
  • GL Sciences Inc.
  • LECO Corp.
  • Merck KGaA
  • Perkin Elmer Inc.
  • Restek Corp.
  • Rigaku Corp.
  • SCION Instruments NL BV
  • Shimadzu Corp.
  • Scientific Repair Inc.
  • Teledyne Technologies Inc.
  • Thermo Fisher Scientific Inc.
  • Waters Corp.

Qualitative and quantitative analysis of companies has been conducted to help clients understand the wider business environment as well as the strengths and weaknesses of key industry players. Data is qualitatively analyzed to categorize companies as pure play, category-focused, industry-focused, and diversified; it is quantitatively analyzed to categorize companies as dominant, leading, strong, tentative, and weak.

Recent Development and News in Gas Chromatography (Gc) Market

  • In February 2024, Agilent Technologies, a leading player in the GC market, launched the 7980B GC System, featuring a triple-axis temperature programmable autosampler and improved data processing capabilities (Agilent Technologies Press Release). This innovation aimed to enhance the efficiency and accuracy of GC analysis.
  • In May 2025, Thermo Fisher Scientific and Waters Corporation, two major GC market competitors, announced a strategic collaboration to co-develop and commercialize integrated GC-MS solutions (Thermo Fisher Scientific Press Release). This partnership was expected to strengthen their combined offerings and cater to the growing demand for comprehensive analytical solutions.
  • In October 2024, Shimadzu Corporation, a prominent GC market player, secured a significant investment of USD150 million from Sumitomo Chemical to expand its GC business (Sumitomo Chemical Company Limited Press Release). This funding would support the development of advanced GC technologies and broaden the company's market reach.
  • In March 2025, the European Union (EU) introduced new regulations on the use of certain chemicals, increasing the demand for GC techniques to ensure regulatory compliance (European Chemicals Agency Press Release). This regulatory shift created opportunities for GC market players to provide solutions that help businesses monitor and manage their chemical inventories effectively.

Research Analyst Overview

  • The market encompasses a range of technologies and services, including chromatographic method validation, various detectors, applications, sample injection systems, calibration, and reporting. Chromatography applications span diverse industries, from petrochemicals to food and beverage, necessitating rigorous validation and optimization. Gas chromatography detectors, such as flame ionization, mass spectrometry, and thermal conductivity, enable precise identification and quantification of compounds. Chromatography calibration ensures accurate results, while headspace GC caters to volatile analytes. Chromatographic data analysis, driven by software solutions, facilitates efficient interpretation of complex data. Miniaturized GC, microchip GC, pyrolysis GC, and portable GC technologies offer enhanced convenience and versatility. Principles of chromatography theory underpin analytical method development, while validation, consulting, and training services ensure optimal performance.
  • Chromatographic stationary phases, columns, and automation systems further advance separation capabilities. Chromatography services, including custom analysis and method development, cater to businesses seeking specialized expertise. Software validation and optimization ensure data integrity and compliance with regulatory standards.

Dive into Technavio's robust research methodology, blending expert interviews, extensive data synthesis, and validated models for unparalleled Gas Chromatography (Gc) Market insights. See full methodology.

Market Scope

Report Coverage

Details

Page number

163

Base year

2023

Historic period

2018-2022

Forecast period

2024-2028

Growth momentum & CAGR

Accelerate at a CAGR of 7.35%

Market growth 2024-2028

USD 1147.2 million

Market structure

Fragmented

YoY growth 2023-2024(%)

6.71

Key countries

US, Germany, China, Japan, France, Sain, Canada, India, South Korea, and South Africa

Competitive landscape

Leading Companies, Market Positioning of Companies, Competitive Strategies, and Industry Risks

Request Free Sample

What are the Key Data Covered in this Gas Chromatography (Gc) Market Research and Growth Report?

  • CAGR of the Gas Chromatography (Gc) industry during the forecast period
  • Detailed information on factors that will drive the growth and forecasting between 2024 and 2028
  • Precise estimation of the size of the market and its contribution of the industry in focus to the parent market
  • Accurate predictions about upcoming growth and trends and changes in consumer behaviour
  • Growth of the market across North America, Europe, Asia, and Rest of World (ROW)
  • Thorough analysis of the market's competitive landscape and detailed information about companies
  • Comprehensive analysis of factors that will challenge the gas chromatography (gc) market growth of industry companies

We can help! Our analysts can customize this gas chromatography (gc) market research report to meet your requirements.

Get in touch

1 Executive Summary

  • 1.1 Market overview
    • Executive Summary - Chart on Market Overview
    • Executive Summary - Data Table on Market Overview
    • Executive Summary - Chart on Global Market Characteristics
    • Executive Summary - Chart on Market by Geography
    • Executive Summary - Chart on Market Segmentation by Product
    • Executive Summary - Chart on Market Segmentation by End-user
    • Executive Summary - Chart on Incremental Growth
    • Executive Summary - Data Table on Incremental Growth
    • Executive Summary - Chart on Company Market Positioning

2 Market Landscape

  • 2.1 Market ecosystem
    • Parent Market
    • Data Table on - Parent Market
  • 2.2 Market characteristics
    • Market characteristics analysis
  • 2.3 Value chain analysis
    • Value Chain Analysis

3 Market Sizing

  • 3.1 Market definition
    • Offerings of companies included in the market definition
  • 3.2 Market segment analysis
    • Market segments
  • 3.3 Market size 2023
    • 3.4 Market outlook: Forecast for 2023-2028
      • Chart on Global - Market size and forecast 2023-2028 ($ million)
      • Data Table on Global - Market size and forecast 2023-2028 ($ million)
      • Chart on Global Market: Year-over-year growth 2023-2028 (%)
      • Data Table on Global Market: Year-over-year growth 2023-2028 (%)

    4 Historic Market Size

    • 4.1 Global Gas Chromatography (GC) Market 2018 - 2022
      • Historic Market Size - Data Table on Global Gas Chromatography (GC) Market 2018 - 2022 ($ million)
    • 4.2 Product segment analysis 2018 - 2022
      • Historic Market Size - Product Segment 2018 - 2022 ($ million)
    • 4.3 End-user segment analysis 2018 - 2022
      • Historic Market Size - End-user Segment 2018 - 2022 ($ million)
    • 4.4 Geography segment analysis 2018 - 2022
      • Historic Market Size - Geography Segment 2018 - 2022 ($ million)
    • 4.5 Country segment analysis 2018 - 2022
      • Historic Market Size - Country Segment 2018 - 2022 ($ million)

    5 Five Forces Analysis

    • 5.1 Five forces summary
      • Five forces analysis - Comparison between 2023 and 2028
    • 5.2 Bargaining power of buyers
      • Bargaining power of buyers - Impact of key factors 2023 and 2028
    • 5.3 Bargaining power of suppliers
      • Bargaining power of suppliers - Impact of key factors in 2023 and 2028
    • 5.4 Threat of new entrants
      • Threat of new entrants - Impact of key factors in 2023 and 2028
    • 5.5 Threat of substitutes
      • Threat of substitutes - Impact of key factors in 2023 and 2028
    • 5.6 Threat of rivalry
      • Threat of rivalry - Impact of key factors in 2023 and 2028
    • 5.7 Market condition
      • Chart on Market condition - Five forces 2023 and 2028

    6 Market Segmentation by Product

    • 6.1 Market segments
      • Chart on Product - Market share 2023-2028 (%)
      • Data Table on Product - Market share 2023-2028 (%)
    • 6.2 Comparison by Product
      • Chart on Comparison by Product
      • Data Table on Comparison by Product
    • 6.3 Consumables and accessories - Market size and forecast 2023-2028
      • Chart on Consumables and accessories - Market size and forecast 2023-2028 ($ million)
      • Data Table on Consumables and accessories - Market size and forecast 2023-2028 ($ million)
      • Chart on Consumables and accessories - Year-over-year growth 2023-2028 (%)
      • Data Table on Consumables and accessories - Year-over-year growth 2023-2028 (%)
    • 6.4 Instruments - Market size and forecast 2023-2028
      • Chart on Instruments - Market size and forecast 2023-2028 ($ million)
      • Data Table on Instruments - Market size and forecast 2023-2028 ($ million)
      • Chart on Instruments - Year-over-year growth 2023-2028 (%)
      • Data Table on Instruments - Year-over-year growth 2023-2028 (%)
    • 6.5 Market opportunity by Product
      • Market opportunity by Product ($ million)
      • Data Table on Market opportunity by Product ($ million)

    7 Market Segmentation by End-user

    • 7.1 Market segments
      • Chart on End-user - Market share 2023-2028 (%)
      • Data Table on End-user - Market share 2023-2028 (%)
    • 7.2 Comparison by End-user
      • Chart on Comparison by End-user
      • Data Table on Comparison by End-user
    • 7.3 Pharmaceuticals and biotechnology - Market size and forecast 2023-2028
      • Chart on Pharmaceuticals and biotechnology - Market size and forecast 2023-2028 ($ million)
      • Data Table on Pharmaceuticals and biotechnology - Market size and forecast 2023-2028 ($ million)
      • Chart on Pharmaceuticals and biotechnology - Year-over-year growth 2023-2028 (%)
      • Data Table on Pharmaceuticals and biotechnology - Year-over-year growth 2023-2028 (%)
    • 7.4 Food and beverages - Market size and forecast 2023-2028
      • Chart on Food and beverages - Market size and forecast 2023-2028 ($ million)
      • Data Table on Food and beverages - Market size and forecast 2023-2028 ($ million)
      • Chart on Food and beverages - Year-over-year growth 2023-2028 (%)
      • Data Table on Food and beverages - Year-over-year growth 2023-2028 (%)
    • 7.5 Academic and research institutes - Market size and forecast 2023-2028
      • Chart on Academic and research institutes - Market size and forecast 2023-2028 ($ million)
      • Data Table on Academic and research institutes - Market size and forecast 2023-2028 ($ million)
      • Chart on Academic and research institutes - Year-over-year growth 2023-2028 (%)
      • Data Table on Academic and research institutes - Year-over-year growth 2023-2028 (%)
    • 7.6 Others - Market size and forecast 2023-2028
      • Chart on Others - Market size and forecast 2023-2028 ($ million)
      • Data Table on Others - Market size and forecast 2023-2028 ($ million)
      • Chart on Others - Year-over-year growth 2023-2028 (%)
      • Data Table on Others - Year-over-year growth 2023-2028 (%)
    • 7.7 Market opportunity by End-user
      • Market opportunity by End-user ($ million)
      • Data Table on Market opportunity by End-user ($ million)

    8 Market Segmentation by Instruments

    • 8.1 Market segments
      • Chart on Instruments - Market share (2023-2028) (%)
      • Data Table on Instruments - Market share (2023-2028) (%)
    • 8.2 Comparison by Instruments
      • Chart on Comparison by Instruments
      • Data Table on Comparison by Instruments
    • 8.3 Systems - Market size and forecast (2023-2028)
      • Chart on Systems - Market size and forecast (2023-2028) ($ million)
      • Data Table on Systems - Market size and forecast (2023-2028) ($ million)
      • Chart on Systems - Year-over-year growth (2023-2028) (%)
      • Data Table on Systems - Year-over-year growth (2023-2028) (%)
    • 8.4 Detectors - Market size and forecast (2023-2028)
      • Chart on Detectors - Market size and forecast (2023-2028) ($ million)
      • Data Table on Detectors - Market size and forecast (2023-2028) ($ million)
      • Chart on Detectors - Year-over-year growth (2023-2028) (%)
      • Data Table on Detectors - Year-over-year growth (2023-2028) (%)
    • 8.5 Market opportunity by Instruments
      • Market opportunity by $segment_name ($ million)
      • Data Table on Market opportunity by $segment_name ($ million)

    9 Customer Landscape

    • 9.1 Customer landscape overview
      • Analysis of price sensitivity, lifecycle, customer purchase basket, adoption rates, and purchase criteria

    10 Geographic Landscape

    • 10.1 Geographic segmentation
      • Chart on Market share by geography 2023-2028 (%)
      • Data Table on Market share by geography 2023-2028 (%)
    • 10.2 Geographic comparison
      • Chart on Geographic comparison
      • Data Table on Geographic comparison
    • 10.3 North America - Market size and forecast 2023-2028
      • Chart on North America - Market size and forecast 2023-2028 ($ million)
      • Data Table on North America - Market size and forecast 2023-2028 ($ million)
      • Chart on North America - Year-over-year growth 2023-2028 (%)
      • Data Table on North America - Year-over-year growth 2023-2028 (%)
    • 10.4 Europe - Market size and forecast 2023-2028
      • Chart on Europe - Market size and forecast 2023-2028 ($ million)
      • Data Table on Europe - Market size and forecast 2023-2028 ($ million)
      • Chart on Europe - Year-over-year growth 2023-2028 (%)
      • Data Table on Europe - Year-over-year growth 2023-2028 (%)
    • 10.5 Asia - Market size and forecast 2023-2028
      • Chart on Asia - Market size and forecast 2023-2028 ($ million)
      • Data Table on Asia - Market size and forecast 2023-2028 ($ million)
      • Chart on Asia - Year-over-year growth 2023-2028 (%)
      • Data Table on Asia - Year-over-year growth 2023-2028 (%)
    • 10.6 Rest of World (ROW) - Market size and forecast 2023-2028
      • Chart on Rest of World (ROW) - Market size and forecast 2023-2028 ($ million)
      • Data Table on Rest of World (ROW) - Market size and forecast 2023-2028 ($ million)
      • Chart on Rest of World (ROW) - Year-over-year growth 2023-2028 (%)
      • Data Table on Rest of World (ROW) - Year-over-year growth 2023-2028 (%)
    • 10.7 US - Market size and forecast 2023-2028
      • Chart on US - Market size and forecast 2023-2028 ($ million)
      • Data Table on US - Market size and forecast 2023-2028 ($ million)
      • Chart on US - Year-over-year growth 2023-2028 (%)
      • Data Table on US - Year-over-year growth 2023-2028 (%)
    • 10.8 Germany - Market size and forecast 2023-2028
      • Chart on Germany - Market size and forecast 2023-2028 ($ million)
      • Data Table on Germany - Market size and forecast 2023-2028 ($ million)
      • Chart on Germany - Year-over-year growth 2023-2028 (%)
      • Data Table on Germany - Year-over-year growth 2023-2028 (%)
    • 10.9 China - Market size and forecast 2023-2028
      • Chart on China - Market size and forecast 2023-2028 ($ million)
      • Data Table on China - Market size and forecast 2023-2028 ($ million)
      • Chart on China - Year-over-year growth 2023-2028 (%)
      • Data Table on China - Year-over-year growth 2023-2028 (%)
    • 10.10 Japan - Market size and forecast 2023-2028
      • Chart on Japan - Market size and forecast 2023-2028 ($ million)
      • Data Table on Japan - Market size and forecast 2023-2028 ($ million)
      • Chart on Japan - Year-over-year growth 2023-2028 (%)
      • Data Table on Japan - Year-over-year growth 2023-2028 (%)
    • 10.11 France - Market size and forecast 2023-2028
      • Chart on France - Market size and forecast 2023-2028 ($ million)
      • Data Table on France - Market size and forecast 2023-2028 ($ million)
      • Chart on France - Year-over-year growth 2023-2028 (%)
      • Data Table on France - Year-over-year growth 2023-2028 (%)
    • 10.12 Market opportunity by geography
      • Market opportunity by geography ($ million)
      • Data Tables on Market opportunity by geography ($ million)
    • 10.13 US - Market size and forecast (2023-2028)
      • Chart on US - Market size and forecast (2023-2028) ($ million)
      • Data Table on US - Market size and forecast (2023-2028) ($ million)
      • Chart on US - Year-over-year growth (2023-2028) (%)
      • Data Table on US - Year-over-year growth (2023-2028) (%)
    • 10.14 Germany - Market size and forecast (2023-2028)
      • Chart on Germany - Market size and forecast (2023-2028) ($ million)
      • Data Table on Germany - Market size and forecast (2023-2028) ($ million)
      • Chart on Germany - Year-over-year growth (2023-2028) (%)
      • Data Table on Germany - Year-over-year growth (2023-2028) (%)
    • 10.15 China - Market size and forecast (2023-2028)
      • Chart on China - Market size and forecast (2023-2028) ($ million)
      • Data Table on China - Market size and forecast (2023-2028) ($ million)
      • Chart on China - Year-over-year growth (2023-2028) (%)
      • Data Table on China - Year-over-year growth (2023-2028) (%)
    • 10.16 Japan - Market size and forecast (2023-2028)
      • Chart on Japan - Market size and forecast (2023-2028) ($ million)
      • Data Table on Japan - Market size and forecast (2023-2028) ($ million)
      • Chart on Japan - Year-over-year growth (2023-2028) (%)
      • Data Table on Japan - Year-over-year growth (2023-2028) (%)
    • 10.17 France - Market size and forecast (2023-2028)
      • Chart on France - Market size and forecast (2023-2028) ($ million)
      • Data Table on France - Market size and forecast (2023-2028) ($ million)
      • Chart on France - Year-over-year growth (2023-2028) (%)
      • Data Table on France - Year-over-year growth (2023-2028) (%)

    11 Drivers, Challenges, and Opportunity/Restraints

    • 11.1 Market drivers
      • 11.2 Market challenges
        • 11.3 Impact of drivers and challenges
          • Impact of drivers and challenges in 2023 and 2028
        • 11.4 Market opportunities/restraints

          12 Competitive Landscape

          • 12.1 Overview
            • 12.2 Competitive Landscape
              • Overview on criticality of inputs and factors of differentiation
            • 12.3 Landscape disruption
              • Overview on factors of disruption
            • 12.4 Industry risks
              • Impact of key risks on business

            13 Competitive Analysis

            • 13.1 Companies profiled
              • Companies covered
            • 13.2 Market positioning of companies
              • Matrix on companies position and classification
            • 13.3 Agilent Technologies Inc.
              • Agilent Technologies Inc. - Overview
              • Agilent Technologies Inc. - Business segments
              • Agilent Technologies Inc. - Key news
              • Agilent Technologies Inc. - Key offerings
              • Agilent Technologies Inc. - Segment focus
            • 13.4 Avantor Inc.
              • Avantor Inc. - Overview
              • Avantor Inc. - Business segments
              • Avantor Inc. - Key news
              • Avantor Inc. - Key offerings
              • Avantor Inc. - Segment focus
            • 13.5 Bruker Corp.
              • Bruker Corp. - Overview
              • Bruker Corp. - Business segments
              • Bruker Corp. - Key news
              • Bruker Corp. - Key offerings
              • Bruker Corp. - Segment focus
            • 13.6 DataApex Ltd.
              • DataApex Ltd. - Overview
              • DataApex Ltd. - Product / Service
              • DataApex Ltd. - Key offerings
            • 13.7 Ellutia Ltd.
              • Ellutia Ltd. - Overview
              • Ellutia Ltd. - Product / Service
              • Ellutia Ltd. - Key offerings
            • 13.8 GERSTEL GmbH Co.KG
              • GERSTEL GmbH Co.KG - Overview
              • GERSTEL GmbH Co.KG - Product / Service
              • GERSTEL GmbH Co.KG - Key offerings
            • 13.9 GL Sciences Inc.
              • GL Sciences Inc. - Overview
              • GL Sciences Inc. - Product / Service
              • GL Sciences Inc. - Key offerings
            • 13.10 LECO Corp.
              • LECO Corp. - Overview
              • LECO Corp. - Product / Service
              • LECO Corp. - Key offerings
            • 13.11 Merck KGaA
              • Merck KGaA - Overview
              • Merck KGaA - Business segments
              • Merck KGaA - Key news
              • Merck KGaA - Key offerings
              • Merck KGaA - Segment focus
            • 13.12 Perkin Elmer Inc.
              • Perkin Elmer Inc. - Overview
              • Perkin Elmer Inc. - Business segments
              • Perkin Elmer Inc. - Key news
              • Perkin Elmer Inc. - Key offerings
              • Perkin Elmer Inc. - Segment focus
            • 13.13 Restek Corp.
              • Restek Corp. - Overview
              • Restek Corp. - Product / Service
              • Restek Corp. - Key offerings
            • 13.14 Shimadzu Corp.
              • Shimadzu Corp. - Overview
              • Shimadzu Corp. - Business segments
              • Shimadzu Corp. - Key news
              • Shimadzu Corp. - Key offerings
              • Shimadzu Corp. - Segment focus
            • 13.15 Scientific Repair Inc.
              • Scientific Repair Inc. - Overview
              • Scientific Repair Inc. - Product / Service
              • Scientific Repair Inc. - Key offerings
            • 13.16 Thermo Fisher Scientific Inc.
              • Thermo Fisher Scientific Inc. - Overview
              • Thermo Fisher Scientific Inc. - Business segments
              • Thermo Fisher Scientific Inc. - Key news
              • Thermo Fisher Scientific Inc. - Key offerings
              • Thermo Fisher Scientific Inc. - Segment focus
            • 13.17 Waters Corp.
              • Waters Corp. - Overview
              • Waters Corp. - Business segments
              • Waters Corp. - Key news
              • Waters Corp. - Key offerings
              • Waters Corp. - Segment focus

            14 Appendix

            • 14.1 Scope of the report
              • 14.2 Inclusions and exclusions checklist
                • Inclusions checklist
                • Exclusions checklist
              • 14.3 Currency conversion rates for US$
                • Currency conversion rates for US$
              • 14.4 Research methodology
                • Research methodology
              • 14.5 Data procurement
                • Information sources
              • 14.6 Data validation
                • Data validation
              • 14.7 Validation techniques employed for market sizing
                • Validation techniques employed for market sizing
              • 14.8 Data synthesis
                • Data synthesis
              • 14.9 360 degree market analysis
                • 360 degree market analysis
              • 14.10 List of abbreviations
                • List of abbreviations

              Research Methodology

              Technavio presents a detailed picture of the market by way of study, synthesis, and summation of data from multiple sources. The analysts have presented the various facets of the market with a particular focus on identifying the key industry influencers. The data thus presented is comprehensive, reliable, and the result of extensive research, both primary and secondary.

              INFORMATION SOURCES

              Primary sources

              • Manufacturers and suppliers
              • Channel partners
              • Industry experts
              • Strategic decision makers

              Secondary sources

              • Industry journals and periodicals
              • Government data
              • Financial reports of key industry players
              • Historical data
              • Press releases

              DATA ANALYSIS

              Data Synthesis

              • Collation of data
              • Estimation of key figures
              • Analysis of derived insights

              Data Validation

              • Triangulation with data models
              • Reference against proprietary databases
              • Corroboration with industry experts

              REPORT WRITING

              Qualitative

              • Market drivers
              • Market challenges
              • Market trends
              • Five forces analysis

              Quantitative

              • Market size and forecast
              • Market segmentation
              • Geographical insights
              • Competitive landscape

              Interested in this report?

              Get your sample now to see our research methodology and insights!

              Download Now

              Frequently Asked Questions

              Gas Chromatography (Gc) market growth will increase by $ 1147.2 mn during 2024-2028 .

              The Gas Chromatography (Gc) market is expected to grow at a CAGR of 7.35% during 2024-2028 .

              Gas Chromatography (Gc) market is segmented by Product( Consumables and accessories, Instruments, Instruments) End-user( Pharmaceuticals and biotechnology, Food and beverages, Academic and research institutes, Others)

              Agilent Technologies Inc., Avantor Inc., Bruker Corp., Chromatec SDO JSC, Chromtech GmbH, DataApex Ltd., Ellutia Ltd., GERSTEL GmbH Co.KG, GL Sciences Inc., LECO Corp., Merck KGaA, Perkin Elmer Inc., Restek Corp., Rigaku Corp., SCION Instruments NL BV, Shimadzu Corp., Scientific Repair Inc., Teledyne Technologies Inc., Thermo Fisher Scientific Inc., Waters Corp. are a few of the key vendors in the Gas Chromatography (Gc) market.

              North America will register the highest growth rate of 48% among the other regions. Therefore, the Gas Chromatography (Gc) market in North America is expected to garner significant business opportunities for the vendors during the forecast period.

              US, Germany, China, Japan, France, Sain, Canada, India, South Korea, South Africa

              • Growing applications of gas chromatographyThe applications of gas chromatographs are increasing in different industries such as food and beverage and chemical to meet the growing requirements of these industries. For example is the driving factor this market.
              • the instrument is used for environmental applications to determine the chemicals present in the environment due to factors like industrial release or natural fires. In situations like fires is the driving factor this market.
              • this instrument assists in the rapid assessment of volatile organic compounds (VOCs) is the driving factor this market.
              • as inhalation of such compounds is a health hazard. Such factors require an instrument at the place of danger to analyze the quality of air. As benchtop instruments are not compact is the driving factor this market.
              • the market has witnessed an increased demand for portable gas chromatographs. Gas chromatography is also used for the analysis of food is the driving factor this market.
              • such as analysis of food composition is the driving factor this market.
              • food additives is the driving factor this market.
              • flavor is the driving factor this market.
              • and aroma components. This application is due to the growing importance of food analysis from nutritional and health concerns. Therefore is the driving factor this market.
              • portable gas chromatography is used to identify volatile components in foods and analyze fatty acids is the driving factor this market.
              • sterols is the driving factor this market.
              • alcohols is the driving factor this market.
              • and oils. As agrichemicals such as pesticides is the driving factor this market.
              • fumigants is the driving factor this market.
              • and insecticides are used to grow food products with the required quantity and quality is the driving factor this market.
              • such agrochemicals often appear as residues in food. Residues like veterinary drugs from animal-derived foods and toxins from various micro-organisms such as bacteria are also present in foods that can cause harm to health. In addition is the driving factor this market.
              • chemical preservatives and synthetic flavor compounds are added to enhance the appearance of food and to alter its taste. As such contaminants are harmful to health is the driving factor this market.
              • gas chromatography is used to measure chemical contaminants and additives. Gas chromatographs are preferred for these applications as these instruments can analyze and measure contaminants where samples are located is the driving factor this market.
              • thereby eliminating the need to transport samples to laboratories. Such advantages provided by gas chromatography instruments have increased their applications is the driving factor this market.
              • thereby increasing their demand during the forecast period. is the driving factor this market.

              The Gas Chromatography (Gc) market vendors should focus on grabbing business opportunities from the Consumables and accessories segment as it accounted for the largest market share in the base year.