Thermometers Market Size 2024-2028
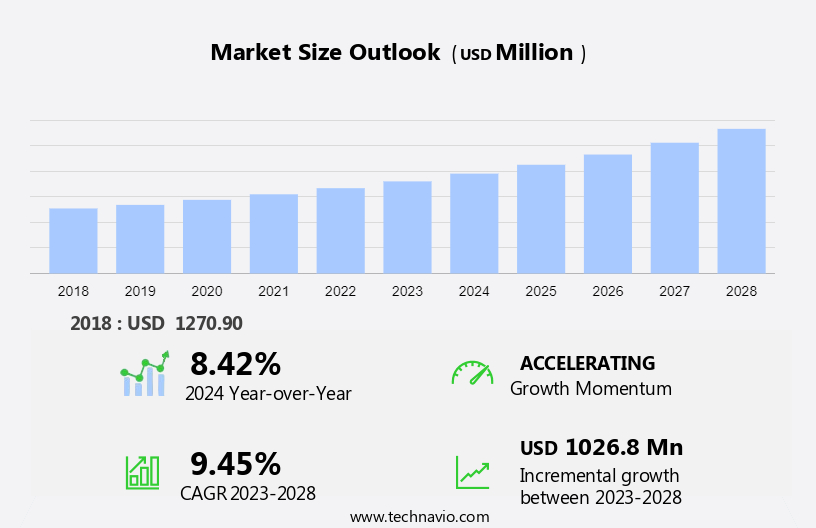
The thermometers market size is forecast to increase by USD 1.03 billion at a CAGR of 9.45% between 2023 and 2028. The market is experiencing significant growth due to the increasing prevalence of target diseases, particularly in the health industry. Medical purposes continue to be the primary driver of market growth, with thermal screening becoming increasingly common in workplaces, hospitals, and homecare products. The elderly population, a demographic with higher health risks, also contributes to market expansion. Market trends include increasing opportunities for growth in emerging economies and competitive pricing pressure. However, the presence of counterfeit products poses a challenge to market players, emphasizing the need for accurate temperature readings and regulatory compliance. Overall, the market is expected to continue its growth trajectory, driven by the importance of maintaining optimal health and preventing the spread of infectious diseases.
The market is witnessing significant growth due to the increasing prevalence of infectious diseases such as dengue and malaria, and various medical conditions that require constant body temperature monitoring. According to the World Health Organization, infectious diseases account for approximately 60% of all deaths worldwide. With the rise in public awareness regarding health challenges, temperature monitoring has become an essential part of healthcare practices. Temperature monitoring devices are used in various settings, including clinics, hospitals, and homes, to measure body temperature in adults and pediatrics. These devices use temperature sensors based on physical phenomena such as thermistors and infrared radiation.
Furthermore, the sensors can be found in various types of temperature monitoring devices, including ear thermometers, forehead thermometers, oral thermometers, ambient thermometers, and anal thermometers. Meteorology and science also utilize temperature sensors for measuring systems in cold climates. Temperature monitoring plays a crucial role in medicine and healthcare, ensuring accurate and timely diagnosis and treatment. In conclusion, the market for temperature monitoring devices is expected to grow due to the increasing need for body temperature monitoring in various settings and applications.
Market Segmentation
The market research report provides comprehensive data (region-wise segment analysis), with forecasts and estimates in "USD billion" for the period 2024-2028, as well as historical data from 2018-2022 for the following segments.
- Application
- Medical
- Industrial
- Laboratory
- Food
- Others
- Product
- Mercury-free thermometer
- Mercury-based thermometer
- Geography
- North America
- US
- Europe
- Germany
- France
- APAC
- China
- Japan
- South America
- Middle East and Africa
- North America
By Application Insights
The medical segment is estimated to witness significant growth during the forecast period. The market encompasses various types of temperature measurement instruments, including mercury thermometers, mercury-free thermometers, digital thermometers, and infrared radiation thermometers. These devices play a vital role in medical and industrial applications. In the medical segment, thermometers are indispensable tools for healthcare professionals to measure body core temperature, which is crucial for diagnosing and monitoring chronic diseases, particularly in the geriatric population and those with chronic illnesses.
Furthermore, mercury thermometers, though traditional, have been largely replaced by mercury-free thermometers due to safety concerns. Digital thermometers offer quick and accurate readings, while infrared radiation thermometers are used for non-contact temperature measurement, making them suitable for environmental hazard assessments. The integration of AI-based systems in thermometers is a recent trend, enhancing their functionality and precision. Both the medical and industrial segments are expected to drive the growth of the market.
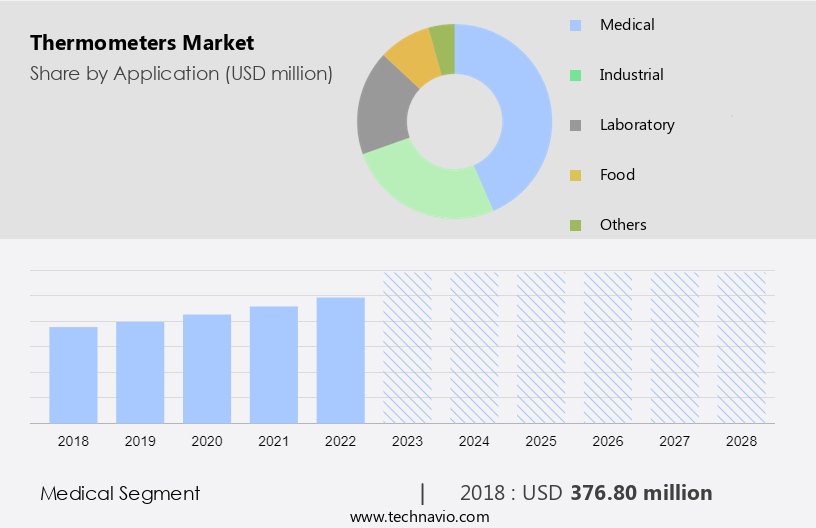
Get a glance at the market share of various segments Request Free Sample
The medical segment was valued at USD 376.80 million in 2018 and showed a gradual increase during the forecast period.
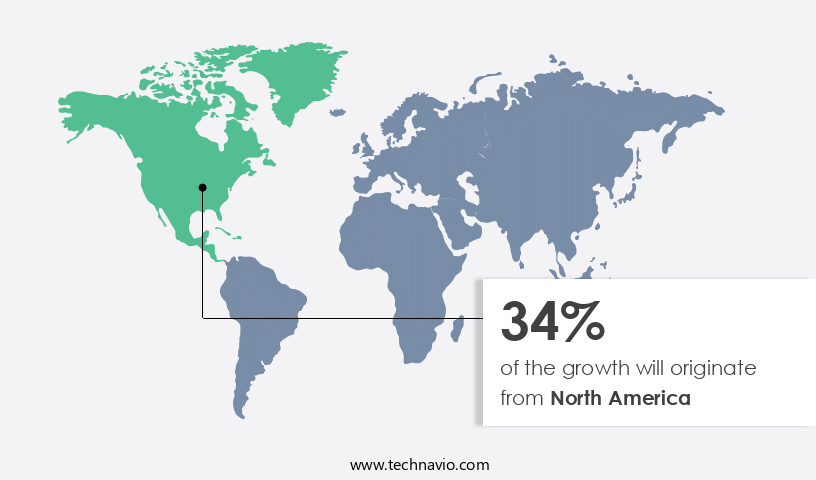
Regional Insights
North America is estimated to contribute 34% to the growth of the global market during the forecast period. Technavio's analysts have elaborately explained the regional trends and drivers that shape the market during the forecast period.
For more insights on the market share of various regions Request Free Sample
The market encompasses various types of thermometers, including Mercury thermometers, Mercury-free thermometers, Digital thermometers, and Infrared radiation thermometers. In 2022, North America emerged as the leading geographical segment in this market. The US and Canada were the major contributors to the regional revenue due to increasing industrial activities, a growing geriatric population, and a rising number of chronic illnesses. Key players in the region are driving market growth through new product launches and innovations. Furthermore, the medical and industrial segments are significant end-users of thermometers, with the medical segment witnessing significant growth due to the increasing prevalence of chronic diseases.
Furthermore, environmental hazards also contribute to the demand for thermometers in various industries. An emerging trend in the market is the integration of AI-based systems to enhance the accuracy and efficiency of thermometer technology.
Our researchers analyzed the data with 2023 as the base year, along with the key drivers, trends, and challenges. A holistic analysis of drivers will help companies refine their marketing strategies to gain a competitive advantage.
Market Driver
The growing prevalence of infectious diseases is the key driver of the market. The global market for temperature monitoring devices, including thermometers, has witnessed significant growth due to the increasing incidence of various medical conditions that necessitate body temperature monitoring. Infectious diseases such as dengue fever, malaria, and tuberculosis continue to pose health challenges around the world, requiring precise temperature readings for accurate diagnosis and treatment.
Furthermore, infrared thermometers have gained popularity due to their non-invasive and contactless features, making them ideal for public awareness campaigns and use by healthcare practitioners in diagnosing and monitoring these conditions. The importance of temperature monitoring in disease management cannot be overstated, making the market a vital segment in the healthcare industry.
Market Trends
Increasing opportunities for market growth in emerging economies is the upcoming trend in the market. The market holds significant potential for growth in emerging economies, particularly in regions such as Asia Pacific, South America, and the Middle East and Africa. These regions account for a large portion of the world population, with approximately 60-80%, yet their consumption of thermometers is currently lower than in developed regions. Governments in these regions are prioritizing infrastructure development and implementing initiatives to ensure proper temperature regulations. As a result, market players are expanding their businesses into emerging markets, including India, China, South Africa, Brazil, and Chile, to broaden their product and service offerings and capitalize on the cost advantages of lower manufacturing and labor costs.
Furthermore, in the context of global health challenges, such as infectious diseases like dengue and malaria, the importance of temperature monitoring devices in medical conditions is increasingly recognized by healthcare practitioners and the general public. The World Health Organization highlights the significance of accurate temperature measurement in diagnosing and treating various medical conditions. Consequently, the market for temperature monitoring devices is expected to witness substantial growth in the coming years.
Market Challenge
Competitive pricing pressure and presence of counterfeit products is a key challenge affecting the market growth. The market is significantly driven by the rising incidence of infectious diseases and medical conditions, such as Dengue and Malaria, which necessitate regular body temperature monitoring. The World Health Organization (WHO) highlights the importance of temperature monitoring devices in addressing health challenges and ensuring accurate diagnosis. Various temperature monitoring devices, including infrared thermometers, are widely used by healthcare practitioners to diagnose and monitor patients' health status.
Furthermore, with the increasing public awareness of health and wellness, the demand for advanced thermometers is on the rise. Numerous established and new companies compete in this market, offering a wide range of thermometers. Global companies invest in marketing, promotion, and product improvement to gain market share, leading to intense competition and price wars. Consequently, companies operate on low profit margins, providing discounts and competitive pricing to attract a high volume of sales.
Exclusive Customer Landscape
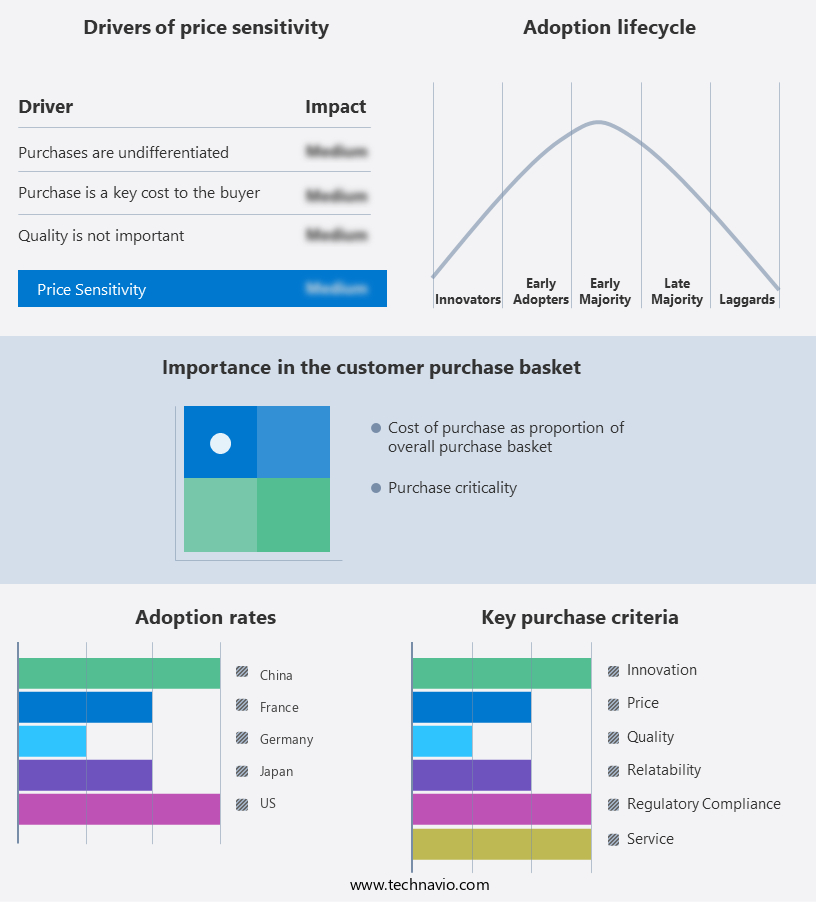
The market forecasting report includes the adoption lifecycle of the market, covering from the innovator's stage to the laggard's stage. It focuses on adoption rates in different regions based on penetration. Furthermore, the report also includes key purchase criteria and drivers of price sensitivity to help companies evaluate and develop their market growth analysis strategies.
Customer Landscape
Key Companies & Market Insights
Companies are implementing various strategies, such as strategic alliances, partnerships, mergers and acquisitions, geographical expansion, and product/service launches, to enhance their presence in the market.
3M Co.: The company offers thermometers such as the 3M Bair Hugger Temperature Monitoring Patient Sensor.
The market research and growth report includes detailed analyses of the competitive landscape of the market and information about key companies, including:
- 3M Co.
- A and D HOLON Holdings Co. Ltd.
- American Diagnostic Corp.
- AMETEK Inc.
- AViTA
- B.Braun SE
- Baxter International Inc.
- Dongguan Actherm Medical Corp.
- Easywell Biomedicals Inc.
- Exergen Corp.
- Fluke Corp.
- Hicks Thermometers India Ltd.
- Medline Industries LP
- Micro Epsilon Messtechnik GmbH and Co. KG
- Microlife Corp.
- Omega Engineering Inc.
- OMRON Corp.
- PCE Holding GmbH
- Radiant
- Testo SE and Co. KGaA
- Wuxi Exanovo Medical Instrument Co. Ltd.
Qualitative and quantitative analysis of companies has been conducted to help clients understand the wider business environment as well as the strengths and weaknesses of key market players. Data is qualitatively analyzed to categorize companies as pure play, category-focused, industry-focused, and diversified; it is quantitatively analyzed to categorize companies as dominant, leading, strong, tentative, and weak.
Research Analyst Overview
Body temperature monitoring is a crucial aspect of healthcare, especially in the context of various health challenges, including infectious diseases such as dengue and malaria, and chronic conditions like chronic illnesses and diseases affecting the geriatric population. Temperature monitoring devices have gained significant importance in medicine and science, as they help in measuring physical phenomena and ensuring accurate temperatures for various purposes. The market for temperature monitoring devices includes digital thermometers, mercury-free thermometers, and infrared radiation thermometers. Digital thermometers are commonly used for self healthcare management, while mercury thermometers, due to their mercury content, are being gradually phased out.
Furthermore, infrared radiation thermometers, also known as non-contact thermometers, are gaining popularity due to their convenience and contactless measurement. The market for temperature monitoring devices caters to various segments, including the medical segment for healthcare settings such as hospitals and clinics, and the industrial segment for environmental hazards and industrial purposes. These devices are used for measuring personal body temperature in adults and pediatrics, as well as for laboratory purposes, thermal screening in workplaces, and research purposes. Infrared radiation thermometers are widely used due to their non-invasive nature and ability to measure temperatures without physical contact. They are available in various forms, including ear, forehead, oral, ambient, anal, and non-contact models.
Moreover, some advanced models come with features like AI-based systems, LCDs, and temperature sensors for precise measurement. Temperature monitoring devices are essential in various industries, including meteorology, medicine, and science, for measuring temperatures in cold climates, water heaters, air conditioners, freezers, heaters, and other applications. They play a crucial role in detecting contagious diseases like swine flu and ensuring accurate temperatures for various purposes. In conclusion, the market for temperature monitoring devices is expected to grow significantly due to the increasing awareness of health challenges, the growing geriatric population, and the need for accurate temperature measurement in various industries and healthcare settings. The market is diverse, with various types of thermometers catering to different applications and user groups.
|
Market Scope |
|
|
Report Coverage |
Details |
|
Page number |
180 |
|
Base year |
2023 |
|
Historic period |
2018-2022 |
|
Forecast period |
2024-2028 |
|
Growth momentum & CAGR |
Accelerate at a CAGR of 9.45% |
|
Market growth 2024-2028 |
USD 1.02 billion |
|
Market structure |
Fragmented |
|
YoY growth 2023-2024(%) |
8.42 |
|
Regional analysis |
North America, Europe, APAC, South America, and Middle East and Africa |
|
Performing market contribution |
North America at 34% |
|
Key countries |
US, China, Germany, Japan, and France |
|
Competitive landscape |
Leading Companies, Market Positioning of Companies, Competitive Strategies, and Industry Risks |
|
Key companies profiled |
3M Co., A and D HOLON Holdings Co. Ltd., American Diagnostic Corp., AMETEK Inc., AViTA, B.Braun SE, Baxter International Inc., Dongguan Actherm Medical Corp., Easywell Biomedicals Inc., Exergen Corp., Fluke Corp., Hicks Thermometers India Ltd., Medline Industries LP, Micro Epsilon Messtechnik GmbH and Co. KG, Microlife Corp., Omega Engineering Inc., OMRON Corp., PCE Holding GmbH, Radiant, Testo SE and Co. KGaA, and Wuxi Exanovo Medical Instrument Co. Ltd. |
|
Market dynamics |
Parent market analysis, market growth inducers and obstacles, market forecast, fast-growing and slow-growing segment analysis, COVID-19 impact and recovery analysis and future consumer dynamics, market condition analysis for the forecast period |
|
Customization purview |
If our market report has not included the data that you are looking for, you can reach out to our analysts and get segments customized. |
What are the Key Data Covered in this Market Research and Growth Report?
- CAGR of the market during the forecast period
- Detailed information on factors that will drive the market growth and forecasting between 2024 and 2028
- Precise estimation of the size of the market and its contribution of the market in focus to the parent market
- Accurate predictions about upcoming market growth and trends and changes in consumer behaviour
- Growth of the market across North America, Europe, APAC, South America, and Middle East and Africa
- Thorough analysis of the market's competitive landscape and detailed information about companies
- Comprehensive analysis of factors that will challenge the growth of market companies
We can help! Our analysts can customize this market research report to meet your requirements. Get in touch
 RIA -
RIA - 
