Gasification Market Analysis APAC, Europe, North America, Middle East and Africa, South America - China, US, Germany, India, UK - Size and Forecast 2024-2028

Gasification Market Analysis APAC, Europe, North America, Middle East and Africa, South America - China, US, Germany, India, UK - Size and Forecast 2024-2028

Published: May 2024 187 Pages SKU: IRTNTR74855

Market Overview at a Glance

$116.6 B
Market Opportunity
4.36%
CAGR
4.1
YoY growth 2023-2024(%)

Gasification Market Size 2024-2028

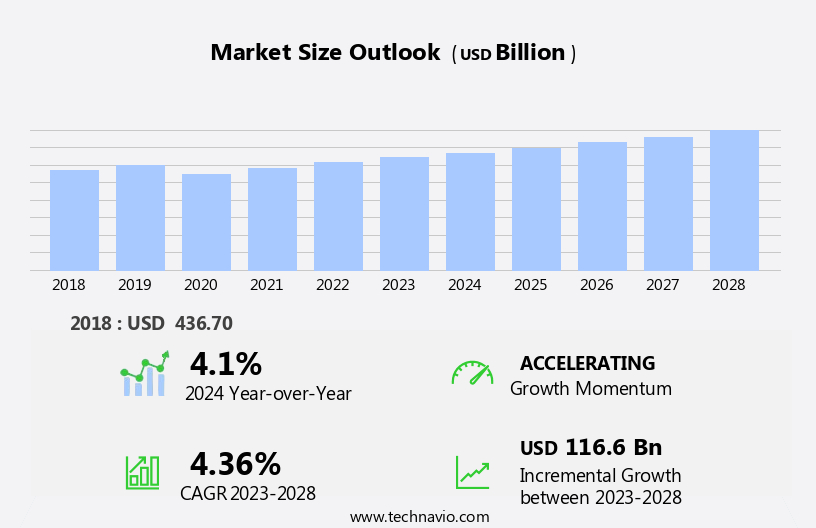
The gasification market size is forecast to increase by USD 116.6 billion at a CAGR of 4.36% between 2023 and 2028.

  • The gasification market is experiencing a surge in growth, propelled by the world's insatiable and ever-increasing energy demands, which necessitate diversified and alternative energy sources. The abundant global supply of coal provides a readily available and cost-effective feedstock for gasification processes, further fueling market expansion. While high operating and maintenance costs remain a significant challenge, they simultaneously present compelling opportunities for innovation and cost reduction strategies.This process is crucial for the chemical, liquid fuel, power, and gaseous fuel segments, as it enables the production of ammonia, methanol, electricity, and hydrogen.
  • Technological advancements are paramount, with improvements in efficiency and emission reduction crucial for long-term market success and sustainability. These advancements, coupled with the imperative for cost-effective and environmentally sound energy solutions, position the gasification market for continued and significant growth.

What will be the Size of the Gasification Market During the Forecast Period?

Gasification Market Size

 Request Free Sample

  • The market encompasses various types of gasifiers, including fixed bed, entrained-flow, and fluidized-bed gasifiers, which convert carbonaceous raw materials into syngas, a mixture of hydrogen, carbon monoxide, and other gases. The coal industry, petroleum, natural gas, biomass/waste, and water are primary feedstocks for gasification. Market dynamics are influenced by industrialization and urbanization, driving the demand for alternative energy sources and reducing reliance on traditional fossil fuels.
  • The BP Statistical Review indicates a growing trend towards thermochemical conversion, with gasification gaining traction as a viable solution for producing cleaner fuels and reducing greenhouse gas emissions. Carbon dioxide and water are by-products of the process, making gasification an environmentally friendly alternative to conventional fuel production methods.

How is this Gasification Industry segmented and which is the largest segment?

The gasification industry research report provides comprehensive data (region-wise segment analysis), with forecasts and estimates in "USD billion" for the period 2024-2028, as well as historical data from 2018-2022 for the following segments.

  • Feedstock
    • Coal
    • Biomass/waste
    • Natural gas
    • Petroleum
  • Application
    • Chemical
    • Liquid fuel
    • Gaseous fuel
    • Power
  • Gasifier Medium
    • Air
    • Oxygen
    • Vapor
  • Type
    • Fixed Bed
    • Fluidized Bed
    • Entrained Flow
    •  
  • Geography
    • APAC
      • China
      • India
    • Europe
      • Germany
      • UK
    • North America
      • US
    • Middle East and Africa
    • South America

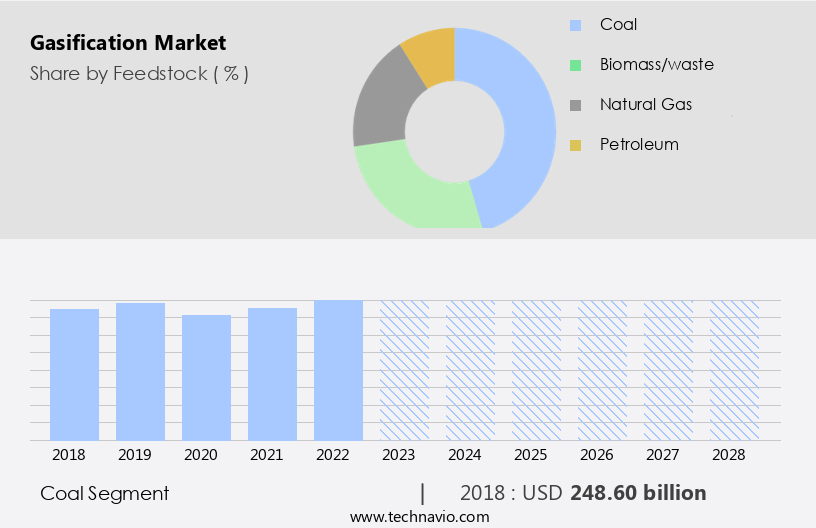
By Feedstock Insights

  • The coal segment is estimated to witness significant growth during the forecast period.

Coal gasification is a critical process In the global energy sector, particularly In the context of increasing coal demand and the push towards environmental sustainability. According to the International Energy Agency (IEA), global coal demand grew by over 1.4% in 2023 due to increase economic expansion, driving industrial output and electricity consumption. However, countries are focusing on net-zero emissions to mitigate environmental concerns. Coal gasification offers a solution by transforming coal into clean chemicals, liquid and gaseous fuels, power, and blends, utilizing indigenous carbonaceous feedstocks. This approach enables nations to meet their energy security and environmental objectives while using coal.

The gasification process involves thermochemical conversion, producing syngas, which is a mixture of hydrogen, carbon monoxide, and other impurities like sulfur and particulate matter. This syngas can be further processed to generate ammonia, methanol, electricity, and hydrogen. Coal, biomass, and municipal solid waste are common feedstocks. Gasifiers include fixed bed, fluidized bed, and entrained-flow types. The chemical segment includes Dimethyl ether, synthetic natural gas, and higher alcohols, while the liquid fuel segment encompasses urea, pet coke, and ash. The power segment utilizes carbon dioxide (CO2), steam, and oxygen for power generation. Gasification's environmental benefits include reduced greenhouse gas emissions and improved waste management through carbon capture technologies.

Companies like Larsen & Toubro are investing in coal gasification plants to meet the growing demand for cleaner energy sources.

Gasification Market Size

Get a glance at the  Gasification Industry report of share of various segments Request Free Sample

The Coal segment was valued at USD 248.60 billion in 2018 and showed a gradual increase during the forecast period.

Regional Analysis

  • APAC is estimated to contribute 48% to the growth of the global market during the forecast period.

Technavio's analysts have elaborately explained the regional trends and drivers that shape the market during the forecast period.

Gasification Market Share by Geography

For more insights on the market share of various regions, Request Free Sample

The coal industry continues to dominate energy production in APAC countries like China and India, which are the world's largest coal producers. However, the Paris Climate Agreement's emission limits have necessitated the adoption of advanced carbon capture technologies, leading to increased interest in coal gasification. This process, which can also utilize biomass as a feedstock, is gaining traction in China due to its potential to improve energy efficiency and reduce greenhouse gas emissions. Researchers propose the integration of coal and biomass energy to optimize the gasification process. In the global context, gasification is a crucial thermochemical conversion process for producing syngas (a mixture of hydrogen, carbon monoxide, and other impurities) from carbonaceous raw materials.

Syngas is further converted into various fuels and chemicals, including ammonia, methanol, electricity, and hydrogen. The power, chemical, and liquid fuel segments are the primary consumers of these gaseous fuels. Industrialization and urbanization have driven the demand for these fuels, necessitating feedstock diversification and waste management solutions. Environmental regulations, particularly those related to sulfur and particulate matter, have further fueled the growth of the market. Companies like Larsen & Toubro have invested in gasification technologies to produce urea and other chemicals, while coal, biomass, and municipal solid waste are common feedstocks. Gasifiers, including fixed bed, fluidized bed, and entrained-flow types, are used In thermal applications to produce syngas for various end-uses.

The global population's rapid growth and increasing industrialization have led to a increase in power demand and the need for sustainable energy solutions. Gasification, with its potential for energy efficiency and emission reductions, is an attractive alternative to conventional combustion technologies.

Market Dynamics

Our  researchers analyzed the data with 2023 as the base year, along with the key drivers, trends, and challenges. A holistic analysis of drivers will help companies refine their marketing strategies to gain a competitive advantage.

What are the key market drivers leading to the rise In the adoption of Gasification Industry?

Rise in global energy demand is the key driver of the market.

  • The global energy landscape has witnessed notable growth over the last decade, driven by industrialization and urbanization, resulting in a surge in demand for fuels and chemical feedstocks. According to the BP Statistical Review, the chemical segment, including ammonia, methanol, and hydrogen, accounted for approximately 12% of global energy consumption in 2020. In the power segment, electricity demand has more than doubled over the past two decades, with the gaseous fuel segment, including syngas from gasification, experiencing significant growth. Gasification, a thermochemical conversion process, converts carbonaceous raw materials, such as coal, biomass, and municipal solid waste, into syngas, a mixture of carbon monoxide and hydrogen.
  • Gasifiers, including fixed bed, fluidized bed, and entrained-flow types, are used in various industries for power generation, chemical manufacturing, and thermal applications. The coal industry continues to be a significant contributor to the global energy mix, but there is a growing emphasis on sustainability and emission reductions. Biomass and waste are increasingly being used as feedstocks in gasification processes to produce syngas for power generation, chemical feedstock, and fuels. Impurities, such as sulfur and particulate matter, must be carefully managed to meet environmental regulations. As global population growth and rapid industrialization continue, there is a need for energy efficiency and feedstock diversification in conventional combustion technologies.
  • Gasification offers a solution by producing syngas from a variety of feedstocks, reducing greenhouse gas emissions, and providing a more sustainable alternative to traditional combustion technology. The market includes various sub-segments, such as the coal sub-segment, which uses coal as a feedstock, and the waste sub-segment, which uses municipal solid waste. Other sub-segments include the liquid fuel segment, which produces synthetic natural gas and higher alcohols, and the chemicals sub-segment, which produces dimethyl ether, synthetic natural gas, and plastics. Installation and operational costs, as well as capital expenditure, are important considerations In the market. Carbon capture technologies are also being explored to mitigate the environmental impact of gasification.
  • Companies such as Larsen & Toubro are investing in gasification technology to produce urea and power from pet coke, reducing reliance on fossil fuels and promoting sustainability. In conclusion, the global energy market is experiencing significant growth, driven by the demand for chemical products and electricity. Gasification offers a sustainable solution by converting various feedstocks into syngas for power generation, chemical feedstock, and fuels. The market includes various sub-segments and considerations, such as feedstocks, installation and operational costs, and carbon capture technologies. As the world continues to industrialize and population grows, gasification will play an increasingly important role in meeting energy demands while reducing greenhouse gas emissions.

What are the market trends shaping the Gasification Industry?

Rise in global coal production is the upcoming market trend.

  • The market encompasses various types of gasifiers, including fixed bed, fluidized bed, and entrained-flow gasifiers, which convert carbonaceous raw materials, such as coal, biomass, and municipal solid waste, into Syngas (a mixture of hydrogen, carbon monoxide, and other impurities). This process is essential for power generation, industrial processes, and the production of chemicals, including Ammonia, Methanol, Hydrogen, and Dimethyl ether. The Chemical segment and Power segment are the major consumers of Syngas, while the Liquid fuel segment uses it for the production of fuels like Urea and Pet coke. The Gaseous fuel segment utilizes Syngas for thermal applications and the production of synthetic natural gas.
  • The Coal industry, with its vast reserves, dominates the market. However, the use of biomass and waste as feedstocks is increasing due to environmental awareness and sustainability concerns. The increasing global population growth, rapid industrialization, and urbanization necessitate the need for energy efficiency and feedstock diversification. The Gasification process generates impurities like sulfur and particulate matter, necessitating the use of Carbon capture technologies and stringent Environmental regulations. The installation and operational costs of gasification plants are higher than conventional combustion technologies, but the benefits of reduced emissions and increased energy efficiency make it a viable alternative. The market dynamics include factors like the availability of feedstocks, capital expenditure, and environmental regulations.
  • The Coal sub-segment, which includes Coal, Petcoke, and Biomass, is a significant contributor to the market. The Air sub-segment, which includes Oxygen, Steam, and Carbon dioxide (CO2), is crucial for the gasification process. The Chemicals sub-segment, which includes chemicals like Ammonia, Methanol, and higher alcohols, and Plastics, is a significant consumer of Syngas. The Fixed bed sub-segment, which includes Fluidized bed and Entrained flow gasifiers, is essential for the efficient conversion of various feedstocks into Syngas. The market is expected to grow due to the increasing demand for electricity, industrialization, and waste management. The waste management sector, including Municipal solid waste, is a significant contributor to the market due to the need for effective waste disposal and recycling.
  • The market is also expected to grow due to the increasing demand for cleaner fuels and the need for emission reductions. In conclusion, the market is a critical component of the global energy landscape, providing a cleaner and more efficient alternative to conventional combustion technologies. The market is driven by factors like the availability of feedstocks, environmental regulations, and the increasing demand for energy and chemicals. The market is expected to grow due to the increasing demand for electricity, industrialization, and waste management.

What challenges does the Gasification Industry face during its growth?

High operating and maintenance costs is a key challenge affecting the industry growth.

  • The market encompasses various types of gasifiers, including fixed bed, fluidized bed, and entrained-flow, which convert carbonaceous raw materials into Syngas. This process is utilized In the Chemical segment for producing fuels like Ammonia, Methanol, and Hydrogen, as well as In the Power segment for electricity generation. The Coal industry, Petroleum, and Natural Gas sectors also leverage Gasification for fuel production and power generation. Impurities such as sulfur and particulate matter are present In the Syngas, necessitating the use of Carbon capture technologies for emission reductions. Biomass/waste, including municipal solid waste, serves as a significant feedstock in Gasification.
  • The Chemicals sub-segment produces Dimethyl ether, Synthetic natural gas, and higher alcohols, while the Liquid fuel segment generates Urea and other chemicals. Thermochemical conversion of waste into Syngas offers environmental benefits, including reduced greenhouse gas emissions and improved waste management. Gasification's adoption is driven by industrialization, urbanization, and the need for energy efficiency. However, the high installation and operational costs hinder market growth. Factors like Capital expenditure, Environmental regulations, and feedstock diversification impact the market dynamics. In the Power segment, Gasification competes with conventional combustion technologies, offering advantages such as higher energy efficiency and lower pollutant emissions. The global population growth and rapid industrialization necessitate sustainable waste disposal and recycling solutions.
  • The municipal sector's increasing focus on thermal applications for waste management and the development of Carbon capture technologies contribute to the market's growth. The Fossil fuels sub-segment includes Coal, Petcoke, and waste, while the Gaseous fuel segment caters to the demand for cleaner fuels. The market's key drivers include the increasing demand for industrial processes, power generation, and chemical feedstock. The market's challenges include the high installation and operational costs, environmental regulations, and the presence of impurities like sulfur and particulate matter. The market's future growth is influenced by the increasing focus on sustainability, energy efficiency, and the need for waste management solutions.

Exclusive Customer Landscape

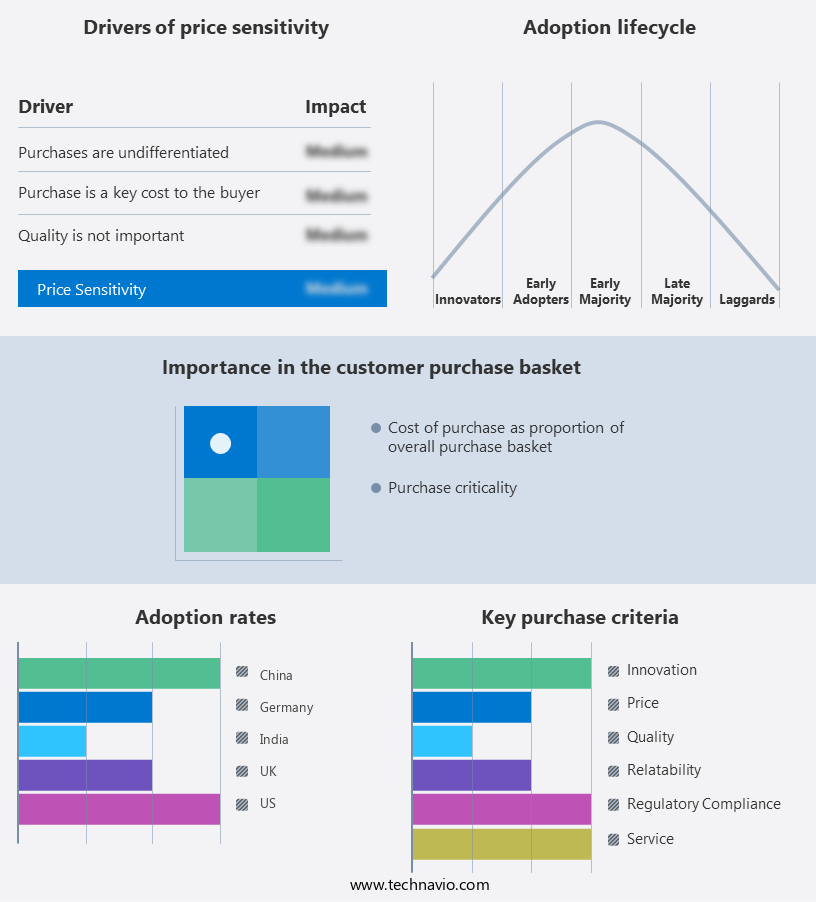
The gasification market forecasting report includes the adoption lifecycle of the market, covering from the innovator's stage to the laggard's stage. It focuses on adoption rates in different regions based on penetration. Furthermore, the gasification market report also includes key purchase criteria and drivers of price sensitivity to help companies evaluate and develop their market growth analysis strategies.

Gasification Market Share by Geography

 Customer Landscape

Key Companies & Market Insights

Companies are implementing various strategies, such as strategic alliances, gasification market forecast, partnerships, mergers and acquisitions, geographical expansion, and product/service launches, to enhance their presence In the industry.

Air Liquide SA - The company specializes in gasification technologies, including Lurgi FBDB, providing efficient and environmentally-friendly solutions for converting various feedstocks into synthesis gas for power generation and industrial applications. This process harnesses the energy potential of organic materials, enhancing energy security and reducing greenhouse gas emissions. By utilizing advanced gasification techniques, the company contributes to a sustainable energy future.

The industry research and growth report includes detailed analyses of the competitive landscape of the market and information about key companies, including:

  • Air Liquide SA
  • Air Products and Chemicals Inc.
  • Andritz AG
  • Basin Electric Power Cooperative
  • CASE GROUP
  • China National Chemical Engineering Co. Ltd.
  • Chiyoda Corp.
  • EQTEC Plc
  • General Electric Co.
  • KBR Inc.
  • Larsen and Toubro Ltd.
  • Linde Plc
  • McDermott International Ltd.
  • Mitsubishi Heavy Industries Ltd.
  • Oil and Natural Gas Corp. Ltd.
  • Shell plc
  • Siemens AG
  • Synthesis Energy Systems Inc.
  • ThermoChem Recovery International Inc.
  • thyssenkrupp AG

Qualitative and quantitative analysis of companies has been conducted to help clients understand the wider business environment as well as the strengths and weaknesses of key industry players. Data is qualitatively analyzed to categorize companies as pure play, category-focused, industry-focused, and diversified; it is quantitatively analyzed to categorize companies as dominant, leading, strong, tentative, and weak.

Research Analyst Overview

The market encompasses various types of gasifiers, including fixed bed, fluidized bed, and entrained-flow designs, each with unique characteristics and applications. These technologies convert carbonaceous fuels, such as coal, biomass, and municipal solid waste, into syngas (a mixture of carbon monoxide, hydrogen, and other gases) through thermochemical conversion. Gasification offers several advantages over conventional combustion technologies. It enables the production of multiple useful products, such as electricity, heat, chemicals, fuels, and hydrogen, from a single feedstock. Moreover, it offers higher energy efficiency and lower emissions, making it a more sustainable option for power generation and industrial processes. The global population's rapid growth and urbanization have led to increased industrialization and power demand.

This, in turn, has fueled the need for cleaner and more efficient energy sources. Gasification plays a crucial role in this context, as it enables the conversion of various feedstocks into valuable energy products while reducing greenhouse gas emissions and pollutants. The chemical segment is a significant consumer of gasification technologies, utilizing syngas as a feedstock for the production of chemicals such as ammonia, methanol, dimethyl ether, and synthetic natural gas. The power segment also relies on gasification for power generation, providing a more efficient and cleaner alternative to conventional coal-fired power plants. The gaseous fuel segment, including hydrogen and carbon monoxide gas, is another growing application area for gasification.

Hydrogen is used as a clean fuel in various industries, including transportation and energy storage, while carbon monoxide gas is used as a reducing agent In the production of metals and other chemicals. Impurities, such as sulfur and particulate matter, are present In the syngas produced through gasification. These impurities must be removed to meet the required specifications for various applications. The removal of these impurities is typically achieved through various post-processing techniques, such as pressure swing adsorption (PSA) and membrane separation. The market for gasification technologies is driven by several factors, including the increasing demand for cleaner and more efficient energy sources, the need for feedstock diversification, and the growing importance of waste management and recycling In the municipal sector.

Environmental regulations also play a significant role In the market's growth, as they push for the adoption of cleaner technologies and the reduction of greenhouse gas emissions. The cost of installing and operating gasification plants is a critical factor In their adoption. Capital expenditure and operational costs vary depending on the type of gasifier and the feedstock used. Coal and petcoke are commonly used feedstocks In the gasification industry, but biomass and municipal solid waste are gaining popularity due to their sustainability benefits. In conclusion, the market offers a cleaner, more efficient, and more sustainable alternative to conventional combustion technologies.

It enables the production of various valuable products from a single feedstock and offers significant environmental benefits. The market's growth is driven by various factors, including population growth, industrialization, and environmental regulations. The cost of installing and operating gasification plants remains a critical factor In their adoption, but the benefits they offer make them an attractive option for various industries.

Market Scope

Report Coverage

Details

Page number

187

Base year

2023

Historic period

2018-2022

Forecast period

2024-2028

Growth momentum & CAGR

Accelerate at a CAGR of 4.36%

Market growth 2024-2028

USD 116.6 billion

Market structure

Fragmented

YoY growth 2023-2024(%)

4.1

Key countries

China, US, Germany, India, and UK

Competitive landscape

Leading Companies, Market Positioning of Companies, Competitive Strategies, and Industry Risks

Request Free Sample

What are the Key Data Covered in this Gasification Market Research and Growth Report?

  • CAGR of the Gasification industry during the forecast period
  • Detailed information on factors that will drive the growth and forecasting between 2024 and 2028
  • Precise estimation of the size of the market and its contribution of the industry in focus to the parent market
  • Accurate predictions about upcoming growth and trends and changes in consumer behaviour
  • Growth of the market across APAC, Europe, North America, Middle East and Africa, and South America
  • Thorough analysis of the market's competitive landscape and detailed information about companies
  • Comprehensive analysis of factors that will challenge the gasification market growth of industry companies

We can help! Our analysts can customize this gasification market research report to meet your requirements.

Get in touch

1 Executive Summary

  • 1.1 Market overview
    • Executive Summary - Chart on Market Overview
    • Executive Summary - Data Table on Market Overview
    • Executive Summary - Chart on Global Market Characteristics
    • Executive Summary - Chart on Market by Geography
    • Executive Summary - Chart on Market Segmentation by Feedstock
    • Executive Summary - Chart on Market Segmentation by Application
    • Executive Summary - Chart on Incremental Growth
    • Executive Summary - Data Table on Incremental Growth
    • Executive Summary - Chart on Company Market Positioning

2 Market Landscape

  • 2.1 Market ecosystem
    • Parent Market
    • Data Table on - Parent Market
  • 2.2 Market characteristics
    • Market characteristics analysis
  • 2.3 Value chain analysis
    • Value Chain Analysis

3 Market Sizing

  • 3.1 Market definition
    • Offerings of companies included in the market definition
  • 3.2 Market segment analysis
    • Market segments
  • 3.3 Market size 2023
    • 3.4 Market outlook: Forecast for 2023-2028
      • Chart on Global - Market size and forecast 2023-2028 ($ billion)
      • Data Table on Global - Market size and forecast 2023-2028 ($ billion)
      • Chart on Global Market: Year-over-year growth 2023-2028 (%)
      • Data Table on Global Market: Year-over-year growth 2023-2028 (%)

    4 Historic Market Size

    • 4.1 Global Gasification Market 2018 - 2022
      • Historic Market Size - Data Table on Global Gasification Market 2018 - 2022 ($ billion)
    • 4.2 Feedstock segment analysis 2018 - 2022
      • Historic Market Size - Feedstock Segment 2018 - 2022 ($ billion)
    • 4.3 Application segment analysis 2018 - 2022
      • Historic Market Size - Application Segment 2018 - 2022 ($ billion)
    • 4.4 Geography segment analysis 2018 - 2022
      • Historic Market Size - Geography Segment 2018 - 2022 ($ billion)
    • 4.5 Country segment analysis 2018 - 2022
      • Historic Market Size - Country Segment 2018 - 2022 ($ billion)

    5 Five Forces Analysis

    • 5.1 Five forces summary
      • Five forces analysis - Comparison between 2023 and 2028
    • 5.2 Bargaining power of buyers
      • Bargaining power of buyers - Impact of key factors 2023 and 2028
    • 5.3 Bargaining power of suppliers
      • Bargaining power of suppliers - Impact of key factors in 2023 and 2028
    • 5.4 Threat of new entrants
      • Threat of new entrants - Impact of key factors in 2023 and 2028
    • 5.5 Threat of substitutes
      • Threat of substitutes - Impact of key factors in 2023 and 2028
    • 5.6 Threat of rivalry
      • Threat of rivalry - Impact of key factors in 2023 and 2028
    • 5.7 Market condition
      • Chart on Market condition - Five forces 2023 and 2028

    6 Market Segmentation by Feedstock

    • 6.1 Market segments
      • Chart on Feedstock - Market share 2023-2028 (%)
      • Data Table on Feedstock - Market share 2023-2028 (%)
    • 6.2 Comparison by Feedstock
      • Chart on Comparison by Feedstock
      • Data Table on Comparison by Feedstock
    • 6.3 Coal - Market size and forecast 2023-2028
      • Chart on Coal - Market size and forecast 2023-2028 ($ billion)
      • Data Table on Coal - Market size and forecast 2023-2028 ($ billion)
      • Chart on Coal - Year-over-year growth 2023-2028 (%)
      • Data Table on Coal - Year-over-year growth 2023-2028 (%)
    • 6.4 Biomass/waste - Market size and forecast 2023-2028
      • Chart on Biomass/waste - Market size and forecast 2023-2028 ($ billion)
      • Data Table on Biomass/waste - Market size and forecast 2023-2028 ($ billion)
      • Chart on Biomass/waste - Year-over-year growth 2023-2028 (%)
      • Data Table on Biomass/waste - Year-over-year growth 2023-2028 (%)
    • 6.5 Natural gas - Market size and forecast 2023-2028
      • Chart on Natural gas - Market size and forecast 2023-2028 ($ billion)
      • Data Table on Natural gas - Market size and forecast 2023-2028 ($ billion)
      • Chart on Natural gas - Year-over-year growth 2023-2028 (%)
      • Data Table on Natural gas - Year-over-year growth 2023-2028 (%)
    • 6.6 Petroleum - Market size and forecast 2023-2028
      • Chart on Petroleum - Market size and forecast 2023-2028 ($ billion)
      • Data Table on Petroleum - Market size and forecast 2023-2028 ($ billion)
      • Chart on Petroleum - Year-over-year growth 2023-2028 (%)
      • Data Table on Petroleum - Year-over-year growth 2023-2028 (%)
    • 6.7 Market opportunity by Feedstock
      • Market opportunity by Feedstock ($ billion)
      • Data Table on Market opportunity by Feedstock ($ billion)

    7 Market Segmentation by Application

    • 7.1 Market segments
      • Chart on Application - Market share 2023-2028 (%)
      • Data Table on Application - Market share 2023-2028 (%)
    • 7.2 Comparison by Application
      • Chart on Comparison by Application
      • Data Table on Comparison by Application
    • 7.3 Chemical - Market size and forecast 2023-2028
      • Chart on Chemical - Market size and forecast 2023-2028 ($ billion)
      • Data Table on Chemical - Market size and forecast 2023-2028 ($ billion)
      • Chart on Chemical - Year-over-year growth 2023-2028 (%)
      • Data Table on Chemical - Year-over-year growth 2023-2028 (%)
    • 7.4 Liquid fuel - Market size and forecast 2023-2028
      • Chart on Liquid fuel - Market size and forecast 2023-2028 ($ billion)
      • Data Table on Liquid fuel - Market size and forecast 2023-2028 ($ billion)
      • Chart on Liquid fuel - Year-over-year growth 2023-2028 (%)
      • Data Table on Liquid fuel - Year-over-year growth 2023-2028 (%)
    • 7.5 Gaseous fuel - Market size and forecast 2023-2028
      • Chart on Gaseous fuel - Market size and forecast 2023-2028 ($ billion)
      • Data Table on Gaseous fuel - Market size and forecast 2023-2028 ($ billion)
      • Chart on Gaseous fuel - Year-over-year growth 2023-2028 (%)
      • Data Table on Gaseous fuel - Year-over-year growth 2023-2028 (%)
    • 7.6 Power - Market size and forecast 2023-2028
      • Chart on Power - Market size and forecast 2023-2028 ($ billion)
      • Data Table on Power - Market size and forecast 2023-2028 ($ billion)
      • Chart on Power - Year-over-year growth 2023-2028 (%)
      • Data Table on Power - Year-over-year growth 2023-2028 (%)
    • 7.7 Market opportunity by Application
      • Market opportunity by Application ($ billion)
      • Data Table on Market opportunity by Application ($ billion)

    8 Market Segmentation by Gasifier Medium

    • 8.1 Market segments
      • Chart on Gasifier Medium - Market share (2023-2028) (%)
      • Data Table on Gasifier Medium - Market share (2023-2028) (%)
    • 8.2 Comparison by Gasifier Medium
      • Chart on Comparison by Gasifier Medium
      • Data Table on Comparison by Gasifier Medium
    • 8.3 Air - Market size and forecast (2023-2028)
      • Chart on Air - Market size and forecast (2023-2028) ($ million)
      • Data Table on Air - Market size and forecast (2023-2028) ($ million)
      • Chart on Air - Year-over-year growth (2023-2028) (%)
      • Data Table on Air - Year-over-year growth (2023-2028) (%)
    • 8.4 Oxygen - Market size and forecast (2023-2028)
      • Chart on Oxygen - Market size and forecast (2023-2028) ($ million)
      • Data Table on Oxygen - Market size and forecast (2023-2028) ($ million)
      • Chart on Oxygen - Year-over-year growth (2023-2028) (%)
      • Data Table on Oxygen - Year-over-year growth (2023-2028) (%)
    • 8.5 Vapor - Market size and forecast (2023-2028)
      • Chart on Vapor - Market size and forecast (2023-2028) ($ million)
      • Data Table on Vapor - Market size and forecast (2023-2028) ($ million)
      • Chart on Vapor - Year-over-year growth (2023-2028) (%)
      • Data Table on Vapor - Year-over-year growth (2023-2028) (%)
    • 8.6 Market opportunity by Gasifier Medium
      • Market opportunity by $segment_name ($ million)
      • Data Table on Market opportunity by $segment_name ($ million)

    9 Market Segmentation by Type

    • 9.1 Market segments
      • Chart on Type - Market share (2023-2028) (%)
      • Data Table on Type - Market share (2023-2028) (%)
    • 9.2 Comparison by Type
      • Chart on Comparison by Type
      • Data Table on Comparison by Type
    • 9.3 Fixed Bed - Market size and forecast (2023-2028)
      • Chart on Fixed Bed - Market size and forecast (2023-2028) ($ million)
      • Data Table on Fixed Bed - Market size and forecast (2023-2028) ($ million)
      • Chart on Fixed Bed - Year-over-year growth (2023-2028) (%)
      • Data Table on Fixed Bed - Year-over-year growth (2023-2028) (%)
    • 9.4 Fluidized Bed - Market size and forecast (2023-2028)
      • Chart on Fluidized Bed - Market size and forecast (2023-2028) ($ million)
      • Data Table on Fluidized Bed - Market size and forecast (2023-2028) ($ million)
      • Chart on Fluidized Bed - Year-over-year growth (2023-2028) (%)
      • Data Table on Fluidized Bed - Year-over-year growth (2023-2028) (%)
    • 9.5 Entrained Flow - Market size and forecast (2023-2028)
      • Chart on Entrained Flow - Market size and forecast (2023-2028) ($ million)
      • Data Table on Entrained Flow - Market size and forecast (2023-2028) ($ million)
      • Chart on Entrained Flow - Year-over-year growth (2023-2028) (%)
      • Data Table on Entrained Flow - Year-over-year growth (2023-2028) (%)
    • 9.6 - Market size and forecast (2023-2028)
      • Chart on - Market size and forecast (2023-2028) ($ million)
      • Data Table on - Market size and forecast (2023-2028) ($ million)
      • Chart on - Year-over-year growth (2023-2028) (%)
      • Data Table on - Year-over-year growth (2023-2028) (%)
    • 9.7 Market opportunity by Type
      • Market opportunity by $segment_name ($ million)
      • Data Table on Market opportunity by $segment_name ($ million)

    10 Customer Landscape

    • 10.1 Customer landscape overview
      • Analysis of price sensitivity, lifecycle, customer purchase basket, adoption rates, and purchase criteria

    11 Geographic Landscape

    • 11.1 Geographic segmentation
      • Chart on Market share by geography 2023-2028 (%)
      • Data Table on Market share by geography 2023-2028 (%)
    • 11.2 Geographic comparison
      • Chart on Geographic comparison
      • Data Table on Geographic comparison
    • 11.3 APAC - Market size and forecast 2023-2028
      • Chart on APAC - Market size and forecast 2023-2028 ($ billion)
      • Data Table on APAC - Market size and forecast 2023-2028 ($ billion)
      • Chart on APAC - Year-over-year growth 2023-2028 (%)
      • Data Table on APAC - Year-over-year growth 2023-2028 (%)
    • 11.4 Europe - Market size and forecast 2023-2028
      • Chart on Europe - Market size and forecast 2023-2028 ($ billion)
      • Data Table on Europe - Market size and forecast 2023-2028 ($ billion)
      • Chart on Europe - Year-over-year growth 2023-2028 (%)
      • Data Table on Europe - Year-over-year growth 2023-2028 (%)
    • 11.5 North America - Market size and forecast 2023-2028
      • Chart on North America - Market size and forecast 2023-2028 ($ billion)
      • Data Table on North America - Market size and forecast 2023-2028 ($ billion)
      • Chart on North America - Year-over-year growth 2023-2028 (%)
      • Data Table on North America - Year-over-year growth 2023-2028 (%)
    • 11.6 Middle East and Africa - Market size and forecast 2023-2028
      • Chart on Middle East and Africa - Market size and forecast 2023-2028 ($ billion)
      • Data Table on Middle East and Africa - Market size and forecast 2023-2028 ($ billion)
      • Chart on Middle East and Africa - Year-over-year growth 2023-2028 (%)
      • Data Table on Middle East and Africa - Year-over-year growth 2023-2028 (%)
    • 11.7 South America - Market size and forecast 2023-2028
      • Chart on South America - Market size and forecast 2023-2028 ($ billion)
      • Data Table on South America - Market size and forecast 2023-2028 ($ billion)
      • Chart on South America - Year-over-year growth 2023-2028 (%)
      • Data Table on South America - Year-over-year growth 2023-2028 (%)
    • 11.8 China - Market size and forecast 2023-2028
      • Chart on China - Market size and forecast 2023-2028 ($ billion)
      • Data Table on China - Market size and forecast 2023-2028 ($ billion)
      • Chart on China - Year-over-year growth 2023-2028 (%)
      • Data Table on China - Year-over-year growth 2023-2028 (%)
    • 11.9 US - Market size and forecast 2023-2028
      • Chart on US - Market size and forecast 2023-2028 ($ billion)
      • Data Table on US - Market size and forecast 2023-2028 ($ billion)
      • Chart on US - Year-over-year growth 2023-2028 (%)
      • Data Table on US - Year-over-year growth 2023-2028 (%)
    • 11.10 Germany - Market size and forecast 2023-2028
      • Chart on Germany - Market size and forecast 2023-2028 ($ billion)
      • Data Table on Germany - Market size and forecast 2023-2028 ($ billion)
      • Chart on Germany - Year-over-year growth 2023-2028 (%)
      • Data Table on Germany - Year-over-year growth 2023-2028 (%)
    • 11.11 India - Market size and forecast 2023-2028
      • Chart on India - Market size and forecast 2023-2028 ($ billion)
      • Data Table on India - Market size and forecast 2023-2028 ($ billion)
      • Chart on India - Year-over-year growth 2023-2028 (%)
      • Data Table on India - Year-over-year growth 2023-2028 (%)
    • 11.12 UK - Market size and forecast 2023-2028
      • Chart on UK - Market size and forecast 2023-2028 ($ billion)
      • Data Table on UK - Market size and forecast 2023-2028 ($ billion)
      • Chart on UK - Year-over-year growth 2023-2028 (%)
      • Data Table on UK - Year-over-year growth 2023-2028 (%)
    • 11.13 Market opportunity by geography
      • Market opportunity by geography ($ billion)
      • Data Tables on Market opportunity by geography ($ billion)

    12 Drivers, Challenges, and Opportunity/Restraints

    • 12.1 Market drivers
      • 12.2 Market challenges
        • 12.3 Impact of drivers and challenges
          • Impact of drivers and challenges in 2023 and 2028
        • 12.4 Market opportunities/restraints

          13 Competitive Landscape

          • 13.1 Overview
            • 13.2 Competitive Landscape
              • Overview on criticality of inputs and factors of differentiation
            • 13.3 Landscape disruption
              • Overview on factors of disruption
            • 13.4 Industry risks
              • Impact of key risks on business

            14 Competitive Analysis

            • 14.1 Companies profiled
              • Companies covered
            • 14.2 Market positioning of companies
              • Matrix on companies position and classification
            • 14.3 Air Liquide SA
              • Air Liquide SA - Overview
              • Air Liquide SA - Business segments
              • Air Liquide SA - Key news
              • Air Liquide SA - Key offerings
              • Air Liquide SA - Segment focus
            • 14.4 Air Products and Chemicals Inc.
              • Air Products and Chemicals Inc. - Overview
              • Air Products and Chemicals Inc. - Business segments
              • Air Products and Chemicals Inc. - Key news
              • Air Products and Chemicals Inc. - Key offerings
              • Air Products and Chemicals Inc. - Segment focus
            • 14.5 Andritz AG
              • Andritz AG - Overview
              • Andritz AG - Business segments
              • Andritz AG - Key news
              • Andritz AG - Key offerings
              • Andritz AG - Segment focus
            • 14.6 Basin Electric Power Co.
              • Basin Electric Power Co. - Overview
              • Basin Electric Power Co. - Product / Service
              • Basin Electric Power Co. - Key offerings
            • 14.7 China National Chemical Engineering Co. Ltd.
              • China National Chemical Engineering Co. Ltd. - Overview
              • China National Chemical Engineering Co. Ltd. - Product / Service
              • China National Chemical Engineering Co. Ltd. - Key offerings
            • 14.8 EQTEC Plc
              • EQTEC Plc - Overview
              • EQTEC Plc - Business segments
              • EQTEC Plc - Key offerings
              • EQTEC Plc - Segment focus
            • 14.9 General Electric Co.
              • General Electric Co. - Overview
              • General Electric Co. - Business segments
              • General Electric Co. - Key news
              • General Electric Co. - Key offerings
              • General Electric Co. - Segment focus
            • 14.10 KBR Inc.
              • KBR Inc. - Overview
              • KBR Inc. - Business segments
              • KBR Inc. - Key news
              • KBR Inc. - Key offerings
              • KBR Inc. - Segment focus
            • 14.11 Larsen and Toubro Ltd.
              • Larsen and Toubro Ltd. - Overview
              • Larsen and Toubro Ltd. - Business segments
              • Larsen and Toubro Ltd. - Key news
              • Larsen and Toubro Ltd. - Key offerings
              • Larsen and Toubro Ltd. - Segment focus
            • 14.12 McDermott International Ltd.
              • McDermott International Ltd. - Overview
              • McDermott International Ltd. - Product / Service
              • McDermott International Ltd. - Key offerings
            • 14.13 Mitsubishi Heavy Industries Ltd.
              • Mitsubishi Heavy Industries Ltd. - Overview
              • Mitsubishi Heavy Industries Ltd. - Business segments
              • Mitsubishi Heavy Industries Ltd. - Key news
              • Mitsubishi Heavy Industries Ltd. - Key offerings
              • Mitsubishi Heavy Industries Ltd. - Segment focus
            • 14.14 Shell plc
              • Shell plc - Overview
              • Shell plc - Business segments
              • Shell plc - Key news
              • Shell plc - Key offerings
              • Shell plc - Segment focus
            • 14.15 Siemens AG
              • Siemens AG - Overview
              • Siemens AG - Business segments
              • Siemens AG - Key news
              • Siemens AG - Key offerings
              • Siemens AG - Segment focus
            • 14.16 Synthesis Energy Systems Inc.
              • Synthesis Energy Systems Inc. - Overview
              • Synthesis Energy Systems Inc. - Product / Service
              • Synthesis Energy Systems Inc. - Key offerings
            • 14.17 thyssenkrupp AG
              • thyssenkrupp AG - Overview
              • thyssenkrupp AG - Business segments
              • thyssenkrupp AG - Key news
              • thyssenkrupp AG - Key offerings
              • thyssenkrupp AG - Segment focus

            15 Appendix

            • 15.1 Scope of the report
              • 15.2 Inclusions and exclusions checklist
                • Inclusions checklist
                • Exclusions checklist
              • 15.3 Currency conversion rates for US$
                • Currency conversion rates for US$
              • 15.4 Research methodology
                • Research methodology
              • 15.5 Data procurement
                • Information sources
              • 15.6 Data validation
                • Data validation
              • 15.7 Validation techniques employed for market sizing
                • Validation techniques employed for market sizing
              • 15.8 Data synthesis
                • Data synthesis
              • 15.9 360 degree market analysis
                • 360 degree market analysis
              • 15.10 List of abbreviations
                • List of abbreviations

              Research Methodology

              Technavio presents a detailed picture of the market by way of study, synthesis, and summation of data from multiple sources. The analysts have presented the various facets of the market with a particular focus on identifying the key industry influencers. The data thus presented is comprehensive, reliable, and the result of extensive research, both primary and secondary.

              INFORMATION SOURCES

              Primary sources

              • Manufacturers and suppliers
              • Channel partners
              • Industry experts
              • Strategic decision makers

              Secondary sources

              • Industry journals and periodicals
              • Government data
              • Financial reports of key industry players
              • Historical data
              • Press releases

              DATA ANALYSIS

              Data Synthesis

              • Collation of data
              • Estimation of key figures
              • Analysis of derived insights

              Data Validation

              • Triangulation with data models
              • Reference against proprietary databases
              • Corroboration with industry experts

              REPORT WRITING

              Qualitative

              • Market drivers
              • Market challenges
              • Market trends
              • Five forces analysis

              Quantitative

              • Market size and forecast
              • Market segmentation
              • Geographical insights
              • Competitive landscape

              Interested in this report?

              Get your sample now to see our research methodology and insights!

              Download Now

              Frequently Asked Questions

              Gasification market growth will increase by $ 116.6 bn during 2024-2028 .

              The Gasification market is expected to grow at a CAGR of 4.36% during 2024-2028 .

              Gasification market is segmented by Feedstock( Coal, Biomass/waste, Natural gas, Petroleum) Application( Chemical, Liquid fuel, Gaseous fuel, Power, South America)

              Air Liquide SA, Air Products and Chemicals Inc., Andritz AG, Basin Electric Power Cooperative, CASE GROUP, China National Chemical Engineering Co. Ltd., Chiyoda Corp., EQTEC Plc, General Electric Co., KBR Inc., Larsen and Toubro Ltd., Linde Plc, McDermott International Ltd., Mitsubishi Heavy Industries Ltd., Oil and Natural Gas Corp. Ltd., Shell plc, Siemens AG, Synthesis Energy Systems Inc., ThermoChem Recovery International Inc., thyssenkrupp AG are a few of the key vendors in the Gasification market.

              APAC will register the highest growth rate of 48% among the other regions. Therefore, the Gasification market in APAC is expected to garner significant business opportunities for the vendors during the forecast period.

              China, US, Germany, India, UK

              • Rise in global energy demandAccording to the IEA is the driving factor this market.
              • there was a significant growth in global energy demand over the past decade owing to robust economic growth. According to the IEA is the driving factor this market.
              • the demand for chemical products has been increasing substantially over the past two decades. The demand for chemical products is primarily driven by the demand for nitrogenous fertilizers and plastics. Moreover is the driving factor this market.
              • there has been significant growth in the demand for electricity across the world. According to the IEA is the driving factor this market.
              • global electricity demand increased two-fold during the past two decades. By 2040 is the driving factor this market.
              • global energy demand is expected to grow by more than 25%. Additionally is the driving factor this market.
              • the global population is expected to reach over nine billion by 2040. Hence is the driving factor this market.
              • with the growth in the global population and a rise in economic activities is the driving factor this market.
              • the demand for electricity is expected to increase significantly during the forecast period. Also is the driving factor this market.
              • the demand for energy services like air conditioning is expected to grow is the driving factor this market.
              • particularly in the residential sector is the driving factor this market.
              • in tandem with the growth in disposable income levels. Moreover is the driving factor this market.
              • the use of electric motor systems in industries is also responsible for the growth in energy demand in the industrial sector. Hence is the driving factor this market.
              • the growth in energy demand worldwide is expected to increase the demand for hydrocarbon fuels is the driving factor this market.
              • such as coal is the driving factor this market.
              • petroleum is the driving factor this market.
              • biomass is the driving factor this market.
              • and others. This is the driving factor this market.
              • in turn is the driving factor this market.
              • is likely to drive the growth of the global gasification market during the forecast period. is the driving factor this market.

              The Gasification market vendors should focus on grabbing business opportunities from the Coal segment as it accounted for the largest market share in the base year.