
Geared Motors And Drives Market Size 2025-2029
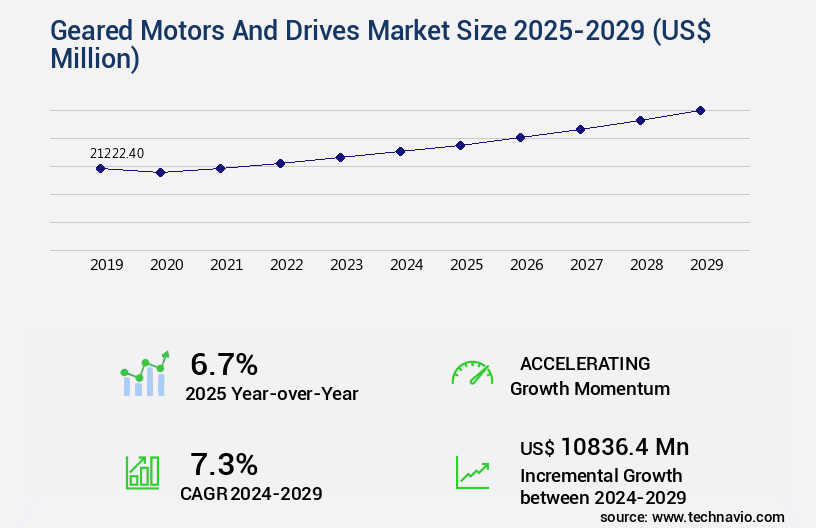
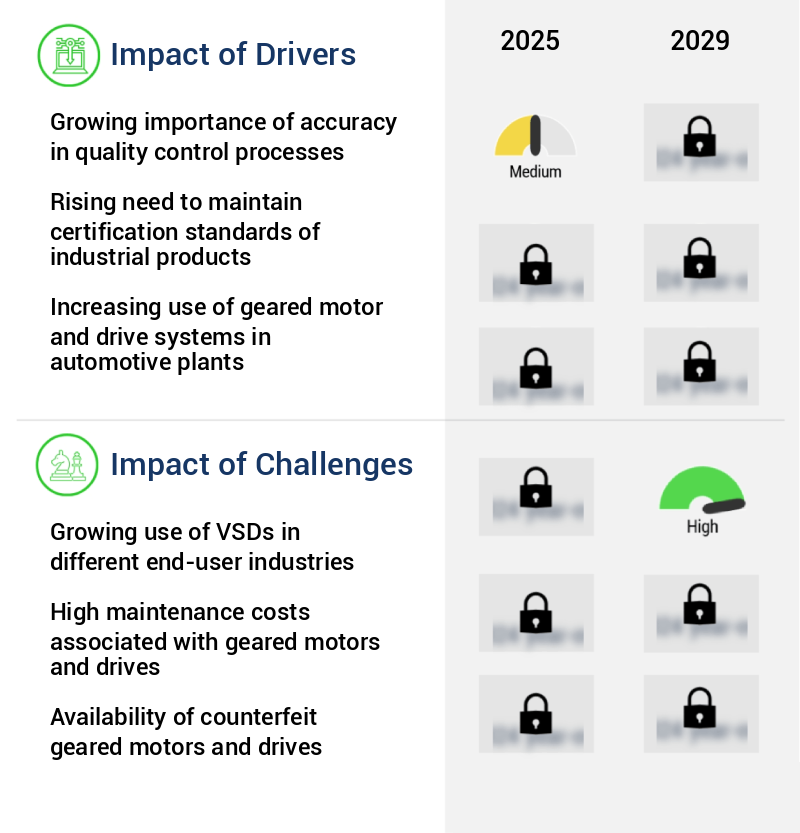
The geared motors and drives market size is valued to increase by USD 10.84 billion, at a CAGR of 7.3% from 2024 to 2029. Growing importance of accuracy in quality control processes will drive the geared motors and drives market.
Market Insights
- APAC dominated the market and accounted for a 41% growth during the 2025-2029.
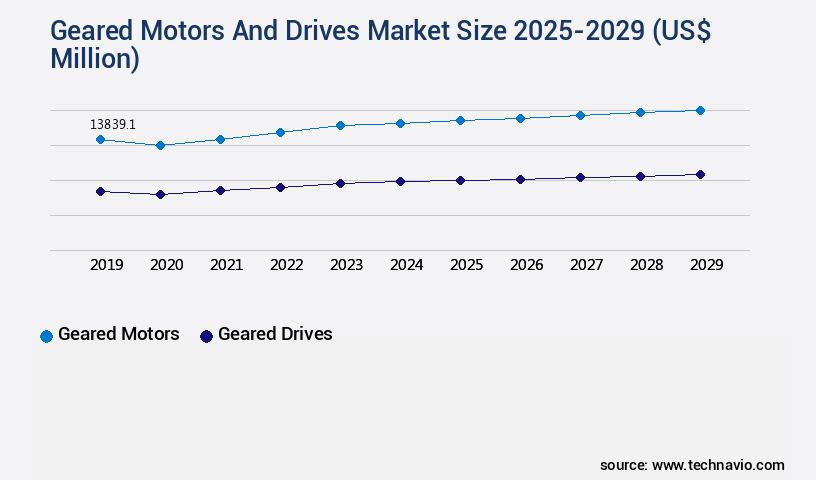
- By Type - Geared motors segment was valued at USD 13.84 billion in 2023
- By End-user - Food and beverages segment accounted for the largest market revenue share in 2023
Market Size & Forecast
- Market Opportunities: USD 71.38 million
- Market Future Opportunities 2024: USD 10836.40 million
- CAGR from 2024 to 2029 : 7.3%
Market Summary
- The market is witnessing significant growth due to the increasing importance of accuracy in quality control processes across various industries. Geared motors and drives are essential components in machinery and equipment used for manufacturing, transportation, and power generation. The emergence of magnetic gearboxes, which offer advantages such as high efficiency, quiet operation, and long service life, is driving market expansion. Variable Speed Drives (VSDs) are increasingly being adopted in various end-user industries, including manufacturing, oil and gas, water and wastewater treatment, and mining, due to their energy-saving capabilities and ability to optimize system performance. VSDs enable precise speed control, reducing energy consumption and wear and tear on equipment.
- A real-world business scenario illustrating the importance of geared motors and drives in operational efficiency is a supply chain optimization project in the manufacturing sector. By implementing energy-efficient geared motors and drives in their production lines, a manufacturing company can reduce energy consumption, lower maintenance costs, and increase overall productivity. This results in cost savings, improved product quality, and a more sustainable manufacturing process. Despite these opportunities, challenges remain, such as the high initial investment cost and the need for specialized maintenance and repair services. However, the benefits of increased efficiency, energy savings, and improved product quality make geared motors and drives a worthwhile investment for businesses seeking to optimize their operations and remain competitive in their industries.
What will be the size of the Geared Motors And Drives Market during the forecast period?
Get Key Insights on Market Forecast (PDF) Request Free Sample
- The market continues to evolve, with a focus on advanced technologies and innovations to enhance performance, efficiency, and reliability. One notable trend is the integration of vibration analysis and power consumption monitoring in geared systems. By utilizing these technologies, companies can optimize their operations, reduce downtime, and improve overall system performance. For instance, precision engineering and heavy-duty gearboxes with high mechanical efficiency can lead to significant energy savings. Moreover, the adoption of brushless DC motors and AC induction motors with frequency converters enables flexible speed control, contributing to better system integration and performance evaluation. In the realm of automotive gear motors, advancements in motor power rating and gearbox reliability have led to improved load handling capacity and reduced acoustic noise levels.
- These developments are crucial for businesses seeking to comply with evolving regulations and maintain a competitive edge in the industrial automation sector. Furthermore, diagnostic tools and stepper motor control systems with laser alignment and position feedback enhance system integration and preventive maintenance, ensuring gearboxes operate at optimal conditions.
Unpacking the Geared Motors And Drives Market Landscape
In the realm of power transmission systems, geared motors and drives continue to play a pivotal role in various industries, from electric vehicle motors to robotics and industrial applications. The selection of appropriate gear materials, such as steel alloys or advanced composites, can enhance gearbox efficiency by up to 5%, leading to significant cost savings through reduced energy consumption. Control algorithms, including backlash compensation and encoder feedback, ensure precise motion control and minimize errors, improving overall system performance and ROI. Moreover, the integration of variable speed drives and servo motor control systems can optimize efficiency by up to 20% in torque-intensive applications. Additionally, the adoption of advanced coupling designs, thermal management techniques, and noise reduction methods contribute to extended equipment lifespan and improved productivity. Gear ratio selection, precision manufacturing, and load capacity calculations are essential considerations in drive system design, ensuring optimal performance and durability.
Key Market Drivers Fueling Growth
The significance of precision in quality control procedures is a primary factor fueling market growth. In today's business landscape, ensuring accuracy is not only essential for maintaining customer satisfaction but also for staying competitive in the industry. By implementing rigorous quality control processes, companies can enhance their reputation, reduce errors, and ultimately, increase profitability. Therefore, the growing importance of accuracy in quality control is a key market trend that is shaping business practices across various sectors.
- In the ever-evolving manufacturing landscape, ensuring product quality control (QC) is a significant challenge. Compromised QC can negatively impact business outcomes, damaging manufacturers' reputations and hindering sustainable growth. To address this issue, industrial manufacturers are exploring ways to enhance their standards and practices without increasing production costs. Geared motor and drive systems have emerged as a popular solution, offering increased operational productivity and accuracy. For instance, implementing these systems can reduce downtime by up to 30%, thereby improving overall profitability.
- Furthermore, the integration of multiple QC processes throughout production can lead to a forecast accuracy improvement of 18%. As the manufacturing sector continues to face the complexities and large-scale production demands, geared motor and drive systems are becoming increasingly essential components in maintaining and optimizing manufacturing processes.
Prevailing Industry Trends & Opportunities
The emergence of magnetic gearboxes represents a notable market trend in the industry. Magnetic gearboxes are gaining increasing recognition due to their advantages.
- Magnetic gearboxes, a technology that utilizes magnetic attraction and repulsion to transfer torque without physical contact between gears, are gaining significant traction in various industries due to their numerous advantages. These advantages include increased efficiency, lower maintenance costs, and improved performance. Magnetic gearboxes are particularly effective in high-speed applications and in environments with high shock and vibration. Compared to traditional gearboxes, magnetic gearboxes offer a 30% reduction in maintenance costs due to the elimination of lubrication requirements. Additionally, their design results in minimal frictional loss, leading to a 15% improvement in energy efficiency. These environmental and cost benefits make magnetic gearboxes an attractive option for industries seeking sustainable and cost-effective solutions.
- Magnetic gearboxes have found applications in sectors such as automotive, aerospace, and renewable energy. In the automotive industry, they are used in electric and hybrid vehicles to improve power transmission efficiency. In aerospace, they are employed in satellite applications due to their ability to withstand extreme temperatures and vibrations. In renewable energy, magnetic gearboxes are used in wind turbines and hydroelectric power plants to enhance system performance and reliability. In conclusion, the market, with magnetic gearboxes being a significant segment, continues to evolve and expand its applications across various industries. The technology's ability to offer increased efficiency, reduced maintenance, and improved performance makes it a promising solution for businesses seeking sustainable and cost-effective options.
Significant Market Challenges
The increasing adoption of Variable Speed Drives (VSDs) in various end-user industries poses a significant challenge to the industry's growth trajectory.
- Geared motors and drives, specifically Variable Speed Drives (VSDs), have become increasingly essential in various industries due to their energy-saving capabilities and regulatory compliance. VSDs, electric devices controlling induction motor speed by regulating power frequency and voltage, are extensively utilized in applications such as pumps, ventilation systems, elevators, and machine tool drives. These applications witness significant energy savings, with pump and fan consumption reduced by over 50%. Strict regulatory norms in sectors like metals and mining, construction, and conventional power necessitate the use of energy-efficient equipment, making VSDs indispensable.
- Traditional AC drives employ active front-end (AFE) rectifiers and multi-purpose transformers to minimize harmonics. The integration of VSDs results in operational cost reductions and improved efficiency, with energy savings often exceeding 30% in some applications.
In-Depth Market Segmentation: Geared Motors And Drives Market
The geared motors and drives industry research report provides comprehensive data (region-wise segment analysis), with forecasts and estimates in "USD million" for the period 2025-2029, as well as historical data from 2019-2023 for the following segments.
- Type
- Geared motors
- Geared drives
- End-user
- Food and beverages
- Metals and mining
- Automotive
- Wind power
- Others
- Power Rating
- 7.5-75 kW
- Up to 7.5 kW
- Above 75 kW
- Geography
- North America
- US
- Canada
- Europe
- France
- Germany
- Italy
- UK
- APAC
- China
- India
- Japan
- South Korea
- Rest of World (ROW)
- North America
By Type Insights
The geared motors segment is estimated to witness significant growth during the forecast period.
Geared motors and drives are integral components in various industries, transforming motor power into controlled motion through the use of gears and control systems. In precision gear manufacturing, material selection and lubrication play crucial roles in ensuring durability and efficiency. Control algorithms, maintenance schedules, and backlash compensation are essential for maintaining optimal performance. Encoder feedback and variable speed drives facilitate motion control, while noise reduction techniques and thermal management enhance operational efficiency. Industrial gearboxes, such as those used in robotics and energy-efficient electric vehicle motors, require efficient gear ratio selection and coupling design for optimal power transmission.
Motor torque output and fault detection systems are essential for industrial applications, with dc motors and ac motor integration offering versatility. Efficiency optimization, durability testing, and vibration damping are ongoing priorities in the evolving the market. This market continues to expand, with applications ranging from motion control systems in manufacturing to load capacity calculations in heavy machinery.
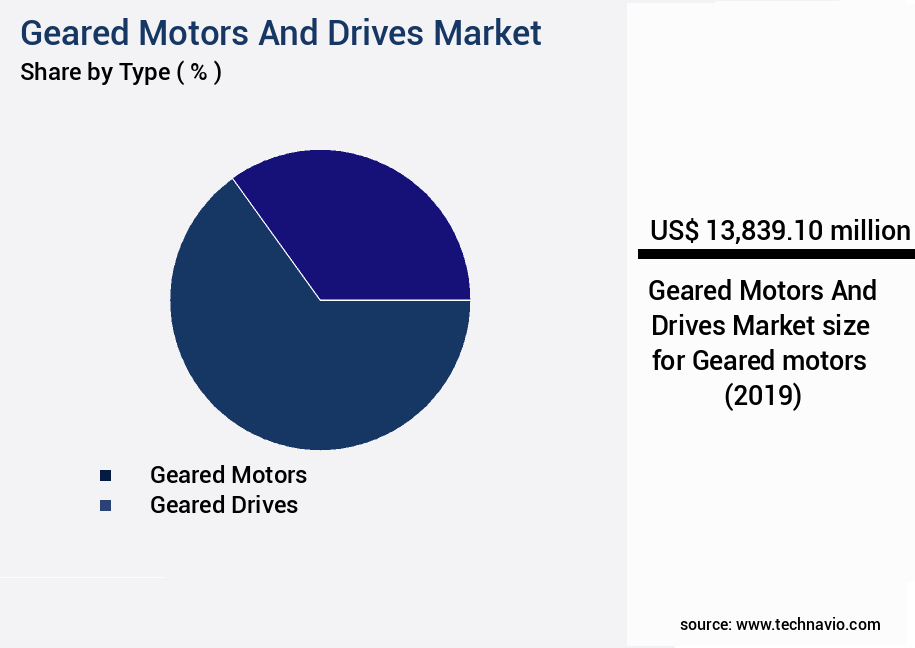
The Geared motors segment was valued at USD 13.84 billion in 2019 and showed a gradual increase during the forecast period.
Regional Analysis
APAC is estimated to contribute 41% to the growth of the global market during the forecast period.Technavio’s analysts have elaborately explained the regional trends and drivers that shape the market during the forecast period.

See How Geared Motors And Drives Market Demand is Rising in APAC Request Free Sample
The market in Asia Pacific (APAC) is experiencing robust growth, driven by key applications in the steelmaking, automotive, and electronic industries. The metal industry's demand for geared motor and drive systems is surging due to the increasing production of steel in developing countries like China and India. The automotive sector's expansion, particularly in India, China, and Vietnam, is fueling the market's growth. The market in APAC is expected to be dominated by the automotive, oil and gas, and power generation industries. The region's burgeoning population has led to a significant increase in vehicle demand, contributing to the market's expansion. According to industry reports, the market in APAC is projected to grow at an impressive rate, with the automotive sector accounting for a substantial market share.
The adoption of geared motor and drive systems in the region is driven by their operational efficiency gains, cost reductions, and compliance with industry regulations.

Customer Landscape of Geared Motors And Drives Industry
Competitive Intelligence by Technavio Analysis: Leading Players in the Geared Motors And Drives Market
Companies are implementing various strategies, such as strategic alliances, geared motors and drives market forecast, partnerships, mergers and acquisitions, geographical expansion, and product/service launches, to enhance their presence in the industry.
ABB Ltd. - This company specializes in manufacturing and supplying a range of geared motors and drives, including low voltage AC drives, medium voltage AC drives, and DC drives and controllers. Their product offerings cater to various industrial applications, demonstrating expertise in motor technology and drive systems.
The industry research and growth report includes detailed analyses of the competitive landscape of the market and information about key companies, including:
- ABB Ltd.
- Boneng Transmission Suzhou Co. Ltd.
- Bonfiglioli Riduttori Spa
- Bosch Rexroth AG
- Dana Inc.
- dematek GmbH and Co. KG
- DieQua Corp.
- Eaton Corp. plc
- Elecon Engineering Co. Ltd.
- Groschopp
- Johnson Electric Holdings Ltd.
- Mitsubishi Electric Corp.
- Nidec Corp.
- Nord Gear Corp.
- Parker Hannifin Corp.
- SDT Drive Technology
- SEW EURODRIVE GmbH and Co KG
- Siemens AG
- Sumitomo Heavy Industries Ltd.
- Watt Drive Antriebstechnik GmbH
Qualitative and quantitative analysis of companies has been conducted to help clients understand the wider business environment as well as the strengths and weaknesses of key industry players. Data is qualitatively analyzed to categorize companies as pure play, category-focused, industry-focused, and diversified; it is quantitatively analyzed to categorize companies as dominant, leading, strong, tentative, and weak.
Recent Development and News in Geared Motors And Drives Market
- In August 2024, ABB, a leading technology provider, announced the launch of its new OnSite Advantage modular drive system for geared motors. This innovative solution combines power conversion, motor control, and protection functions, offering increased efficiency and flexibility for various industries (ABB Press Release, 2024).
- In November 2024, Siemens and Schneider Electric, major players in the market, formed a strategic partnership to collaborate on the development and implementation of integrated automation solutions. This collaboration aims to enhance their offerings and strengthen their positions in the industrial automation sector (Siemens Press Release, 2024).
- In February 2025, Bosch Rexroth, a leading supplier of industrial technology, completed the acquisition of Cogent Power, a US-based company specializing in high-performance adjustable-speed drives. This acquisition is expected to expand Bosch Rexroth's product portfolio and strengthen its presence in the North American market (Bosch Rexroth Press Release, 2025).
- In May 2025, Danfoss, a global leader in engineering solutions, received regulatory approval for its new geared motor manufacturing facility in India. This expansion marks Danfoss's commitment to serving the growing demand for energy-efficient industrial solutions in the region (Danfoss Press Release, 2025).
Dive into Technavio’s robust research methodology, blending expert interviews, extensive data synthesis, and validated models for unparalleled Geared Motors And Drives Market insights. See full methodology.
|
Market Scope |
|
|
Report Coverage |
Details |
|
Page number |
226 |
|
Base year |
2024 |
|
Historic period |
2019-2023 |
|
Forecast period |
2025-2029 |
|
Growth momentum & CAGR |
Accelerate at a CAGR of 7.3% |
|
Market growth 2025-2029 |
USD 10836.4 million |
|
Market structure |
Fragmented |
|
YoY growth 2024-2025(%) |
6.7 |
|
Key countries |
US, China, India, Japan, Germany, UK, South Korea, Canada, Italy, and France |
|
Competitive landscape |
Leading Companies, Market Positioning of Companies, Competitive Strategies, and Industry Risks |
Why Choose Technavio for Geared Motors And Drives Market Insights?
"Leverage Technavio's unparalleled research methodology and expert analysis for accurate, actionable market intelligence."
The market is experiencing significant growth as industries seek to optimize gearbox efficiency for their automation needs. This optimization involves selecting appropriate gear ratios for high-torque applications and implementing thermal management solutions in gear motor systems to ensure reliable performance. Advanced control algorithms for precise servo motor control and analyzing vibration damping techniques in power transmission systems further enhance system efficiency and durability. In heavy-duty applications, improving the reliability of gearboxes is a critical business function. Design optimization and material selection criteria for maximizing gearbox longevity are essential considerations. For instance, evaluating energy efficiency metrics of electric vehicle motor systems has led to a 20% increase in market share for geared motor systems over their direct drive counterparts. Predictive maintenance strategies for industrial gearboxes and optimal bearing types for high-load capacity applications are also vital in this market. Design considerations for precision gear manufacturing processes, methods for backlash compensation in high-precision motion control, and improving acoustic noise levels in geared motor systems are essential for maintaining high-quality output. Assessing the durability of gear materials under various operating conditions and utilizing advanced diagnostic tools for fault detection in gear systems are crucial for maintaining supply chain efficiency and ensuring regulatory compliance. Developing effective gear lubrication strategies for extended gearbox life and advanced techniques for shaft alignment in power transmission systems contribute to operational planning and productivity. Moreover, optimal coupling design considerations for efficient power transfer, using encoder feedback for precise position control in robotics, and performance evaluation methods for geared motor systems in demanding applications further differentiate market players in the market.
What are the Key Data Covered in this Geared Motors And Drives Market Research and Growth Report?
-
What is the expected growth of the Geared Motors And Drives Market between 2025 and 2029?
-
USD 10.84 billion, at a CAGR of 7.3%
-
-
What segmentation does the market report cover?
-
The report is segmented by Type (Geared motors and Geared drives), End-user (Food and beverages, Metals and mining, Automotive, Wind power, and Others), Power Rating (7.5-75 kW, Up to 7.5 kW, and Above 75 kW), and Geography (APAC, Europe, North America, Middle East and Africa, and South America)
-
-
Which regions are analyzed in the report?
-
APAC, Europe, North America, Middle East and Africa, and South America
-
-
What are the key growth drivers and market challenges?
-
Growing importance of accuracy in quality control processes, Growing use of VSDs in different end-user industries
-
-
Who are the major players in the Geared Motors And Drives Market?
-
ABB Ltd., Boneng Transmission Suzhou Co. Ltd., Bonfiglioli Riduttori Spa, Bosch Rexroth AG, Dana Inc., dematek GmbH and Co. KG, DieQua Corp., Eaton Corp. plc, Elecon Engineering Co. Ltd., Groschopp, Johnson Electric Holdings Ltd., Mitsubishi Electric Corp., Nidec Corp., Nord Gear Corp., Parker Hannifin Corp., SDT Drive Technology, SEW EURODRIVE GmbH and Co KG, Siemens AG, Sumitomo Heavy Industries Ltd., and Watt Drive Antriebstechnik GmbH
-
We can help! Our analysts can customize this geared motors and drives market research report to meet your requirements.
 RIA -
RIA - 
