Generative AI In Content Creation Market Analysis, Size, and Forecast 2025-2029: North America (US, Canada, and Mexico), APAC (China, Japan, and India), Europe (Germany, UK, and France), Middle East and Africa (UAE, Saudi Arabia, and South Africa), South America (Brazil, Argentina, and Colombia), and Rest of World (ROW)

Generative AI In Content Creation Market Analysis, Size, and Forecast 2025-2029:
North America (US, Canada, and Mexico), APAC (China, Japan, and India), Europe (Germany, UK, and France), Middle East and Africa (UAE, Saudi Arabia, and South Africa), South America (Brazil, Argentina, and Colombia), and Rest of World (ROW)

Published: Dec 2025 294 Pages SKU: IRTNTR81023

Market Overview at a Glance

$36.39 B
Market Opportunity
32.2%
CAGR
35.2%
North America Growth

Generative AI In Content Creation Market Size 2025-2029

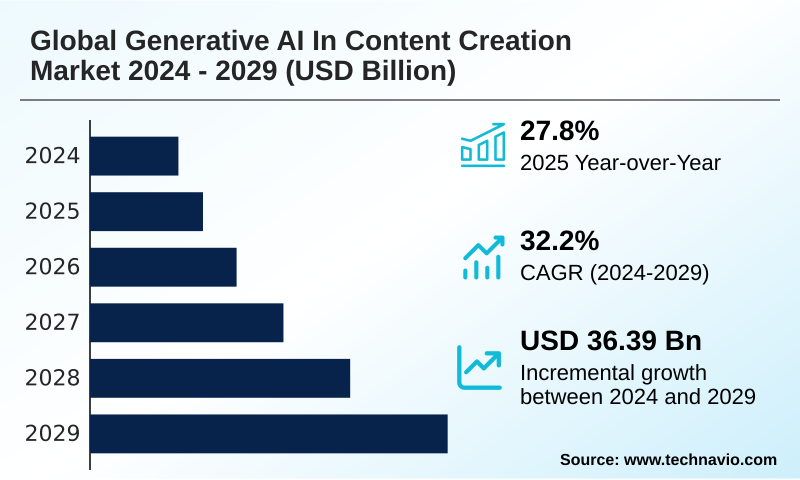
The generative ai in content creation market size is valued to increase by USD 36.39 billion, at a CAGR of 32.2% from 2024 to 2029. Demand for personalized and high-volume content will drive the generative ai in content creation market.

Major Market Trends & Insights

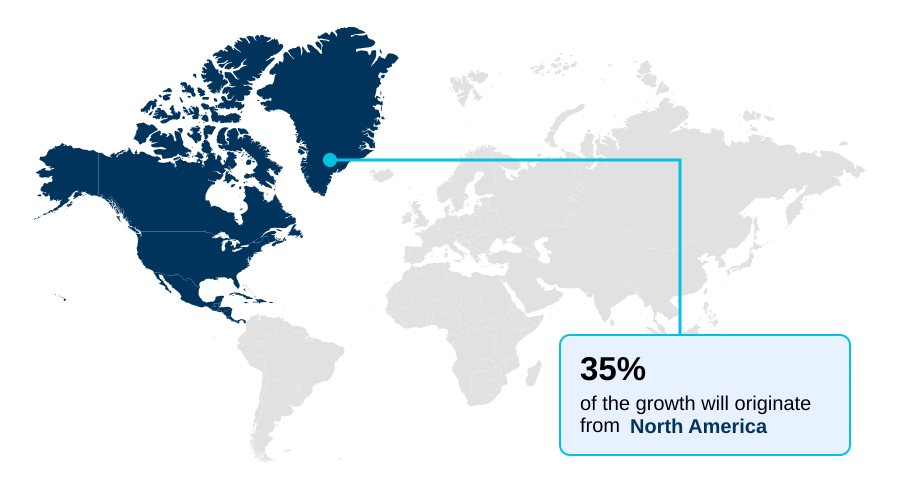
  • North America dominated the market and accounted for a 35.2% growth during the forecast period.
  • CAGR from 2024 to 2029 : 32.2%

Market Summary

  • The generative AI in content creation market is defined by rapid technological advancements, where generative adversarial networks and other sophisticated models are reshaping content production. The primary driver is the demand for scalable, personalized material, pushing innovation in text-to-image generation and AI-driven video production.
  • A key trend is the move toward on-device AI processing and the deployment of specialized AI voice synthesis tools. However, significant challenges persist, including the risk of AI model hallucination and the complexities of copyright infringement risk.
  • For example, a marketing firm can use natural language prompts to generate thousands of ad variations for A/B testing, but it must navigate the legal ambiguities of AI-generated output ownership and implement robust AI governance features.
  • Success depends on balancing the creative potential of AI-powered copywriting and generative design tools with the need for responsible AI principles, addressing issues like algorithmic bias detection and ensuring content provenance through technologies like digital watermarking.

What will be the Size of the Generative AI In Content Creation Market during the forecast period?

Get Key Insights on Market Forecast (PDF) Request Free Sample

How is the Generative AI In Content Creation Market Segmented?

The generative ai in content creation industry research report provides comprehensive data (region-wise segment analysis), with forecasts and estimates in "USD million" for the period 2025-2029.
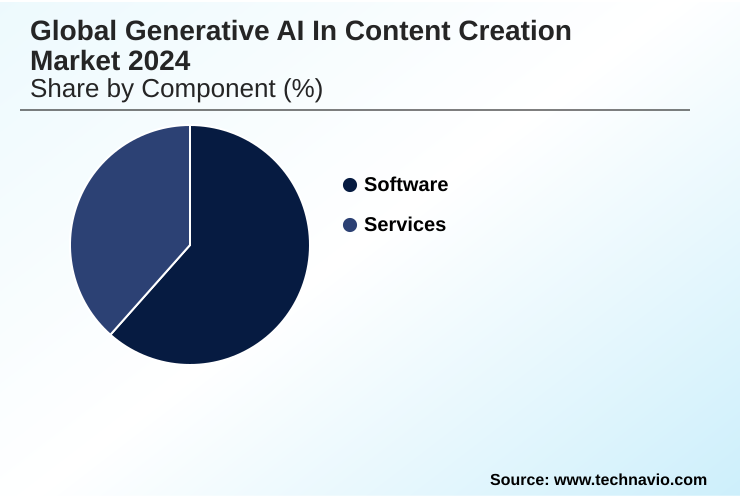
  • Component
    • Software
    • Services
  • Application
    • Text generation
    • Image generation
    • Video generation
    • Music and audio generation
    • Others
  • End-user
    • Entertainment and media
    • Marketing and advertising
    • E-commerce
    • Gaming
    • Others
  • Geography
    • North America
      • US
      • Canada
      • Mexico
    • APAC
      • China
      • Japan
      • India
    • Europe
      • Germany
      • UK
      • France
    • Middle East and Africa
      • UAE
      • Saudi Arabia
      • South Africa
    • South America
      • Brazil
      • Argentina
      • Colombia
    • Rest of World (ROW)

By Component Insights

The software segment is estimated to witness significant growth during the forecast period.

The software segment is the core of the generative AI in content creation market, driven by relentless innovation in foundational technologies.

This includes not only the development of sophisticated large language models and diffusion models, but also their deployment through API-based model access and as features embedded within existing enterprise suites.

A significant trend is the shift from standalone tools toward deeply integrated generative video features and conversational AI assistants within professional workflows. This integration of AI content assistant technology simplifies adoption and enhances productivity.

For instance, businesses leveraging embedded AI-powered copywriting have reported improvements in content creation efficiency by over 25%. This move toward enterprise-grade AI solutions and AI safety frameworks is pivotal for sustained adoption and value realization in commercial applications.

Request Free Sample

Regional Analysis

North America is estimated to contribute 35.2% to the growth of the global market during the forecast period.Technavio’s analysts have elaborately explained the regional trends and drivers that shape the market during the forecast period.

See How Generative AI In Content Creation Market Demand is Rising in North America Request Free Sample

The geographic landscape of the generative AI in content creation market is led by North America, which is home to over 70% of foundational large language models and key generative design tools.

This region drives core technological progress, focusing on multimodal AI systems. In contrast, Europe emphasizes a regulation-first approach, with the EU AI Act mandating strong AI governance features and AI model transparency.

This focus on responsible AI principles has led to a 20% faster adoption rate for compliant platforms in regulated industries like finance.

Meanwhile, APAC is characterized by rapid, mobile-first adoption, where on-brand content generation and automated content creation are critical for engaging a vast digital consumer base.

This regional diversity underscores a global market shaped by distinct innovation priorities, regulatory philosophies, and paths to commercialization.

Market Dynamics

Our researchers analyzed the data with 2024 as the base year, along with the key drivers, trends, and challenges. A holistic analysis of drivers will help companies refine their marketing strategies to gain a competitive advantage.

  • The generative AI in content creation market for enterprise is rapidly maturing, moving beyond general applications to specialized use cases. In the generative AI in content creation market for marketing, the focus is on leveraging the technology for personalized advertising and scalable social media campaigns. The benefits of multimodal AI in content creation are becoming clear, allowing for unified workflows.
  • However, challenges of AI content accuracy and the legal risks of using generative AI persist, making ethical considerations in AI content paramount. The intellectual property rights in AI generation remain a significant hurdle.
  • In the generative AI in content creation market for e-commerce, businesses are automating product descriptions with AI, with some achieving content deployment speeds more than twice that of manual methods. Similarly, the generative AI in content creation market for media is using generative AI for scriptwriting, while the generative AI in content creation market for gaming explores procedural world creation.
  • The impact of open-source models on content creation is lowering barriers to entry, though the cost of implementing generative AI, especially regarding computational power, remains a factor.
  • As the industry evolves, the future of text-to-video AI generation, the role of AI in personalized advertising, and the development of generative AI tools for 3D modeling and AI-powered music composition tools will be key areas of focus. Integrating AI into creative workflows is now a strategic imperative for maintaining a competitive edge.

What are the key market drivers leading to the rise in the adoption of Generative AI In Content Creation Industry?

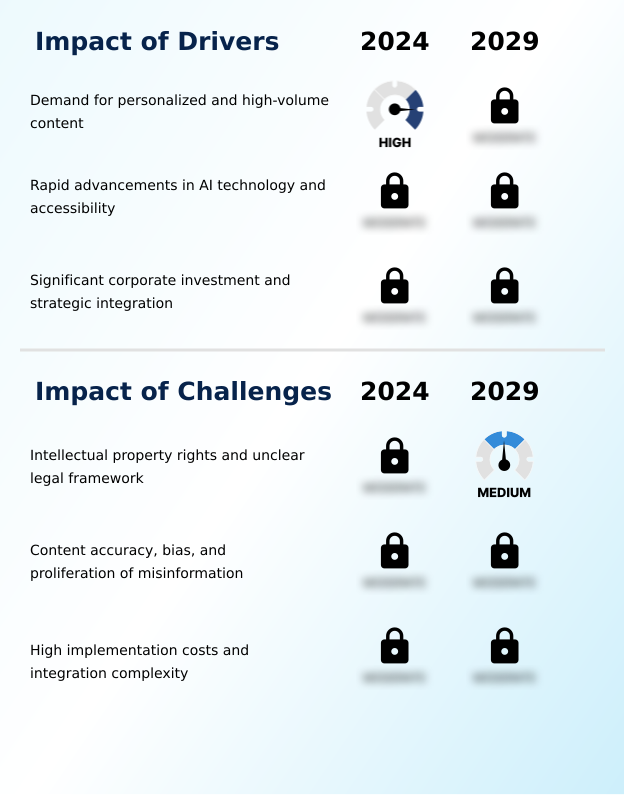
  • The escalating demand for personalized, high-volume digital content across numerous industries is a primary driver propelling market growth.

  • The market's expansion is fueled by an escalating demand for personalized content and rapid technological advancements. Businesses leveraging dynamic content customization through AI have registered a 20% uplift in customer engagement metrics.
  • The accessibility of powerful models through APIs and open-source contributions is a major catalyst, with the availability of open-source language models reducing initial development costs for startups by an estimated 60%.
  • This democratization enables widespread experimentation with human-computer interaction and customer service automation. The need for brand voice consistency across high-volume outputs is driving the adoption of tools that ensure uniformity.
  • Strategic corporate investments and the integration of AI-powered code assistants into development pipelines further accelerate innovation, creating a virtuous cycle of adoption and capability enhancement across industries.

What are the market trends shaping the Generative AI In Content Creation Industry?

  • A dominant market trend is the rapid evolution from single-function tools to sophisticated, multimodal systems. These systems are being deeply integrated into existing professional workflows to enhance creative efficiency.

  • A dominant trend is the shift toward specialization and multimodality, transforming how content is produced. Instead of single-purpose tools, businesses are adopting integrated platforms that support deepfake generation and AI-generated music within unified workflows.
  • The rise of smaller, specialized models trained on domain-specific training data is improving output relevance, with early adopters reporting a 25% increase in task-specific accuracy over general models. This move toward AI model fine-tuning enables on-brand content generation and more effective legal precedent analysis.
  • Furthermore, the push for on-device AI processing is enhancing security and reducing latency, with some applications demonstrating a 50% improvement in response times. These advancements, driven by the content authenticity initiative and a focus on AI model transparency, are making generative AI an indispensable utility.

What challenges does the Generative AI In Content Creation Industry face during its growth?

  • A paramount challenge confronting the market is the complex and largely unresolved landscape of intellectual property rights and the unclear legal framework surrounding AI-generated content.

  • Significant challenges persist around intellectual property and operational viability. The lack of clarity on fair use doctrine and AI-generated output ownership has stalled projects, leading to potential revenue delays of up to two quarters for some firms. The issue of factual accuracy validation remains critical, as misinformation proliferation can severely damage brand credibility.
  • Moreover, the high computational resource requirements and costs associated with GPU hardware acceleration can increase operational budgets by over 35% for high-volume use cases. Integrating these systems with legacy systems integration points adds another layer of complexity, demanding specialized talent.
  • Addressing these hurdles through robust content moderation policies, data privacy controls, and clear legal frameworks is essential for sustainable market growth.

Exclusive Technavio Analysis on Customer Landscape

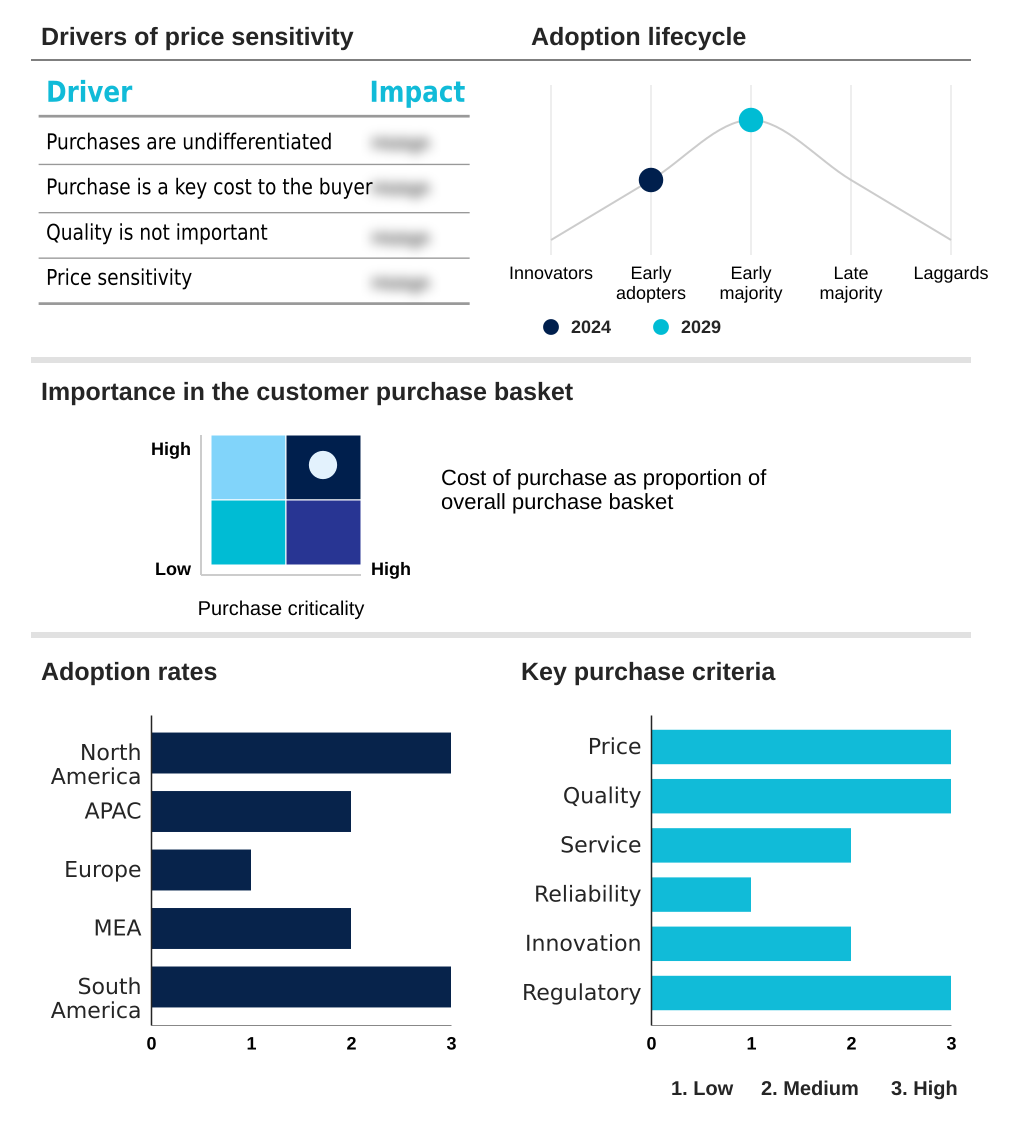
The generative ai in content creation market forecasting report includes the adoption lifecycle of the market, covering from the innovator’s stage to the laggard’s stage. It focuses on adoption rates in different regions based on penetration. Furthermore, the generative ai in content creation market report also includes key purchase criteria and drivers of price sensitivity to help companies evaluate and develop their market growth analysis strategies.

Customer Landscape of Generative AI In Content Creation Industry

Competitive Landscape

Companies are implementing various strategies, such as strategic alliances, generative ai in content creation market forecast, partnerships, mergers and acquisitions, geographical expansion, and product/service launches, to enhance their presence in the industry.

Adobe Inc. - Offers enterprise-grade AI platforms for multimodal content generation, automating and scaling creative workflows for text, image, video, and audio applications.

The industry research and growth report includes detailed analyses of the competitive landscape of the market and information about key companies, including:

  • Adobe Inc.
  • Anthropic
  • Autodesk Inc.
  • Cohere
  • CopyAI Inc.
  • Descript
  • Eleven Labs Inc.
  • Google LLC
  • Grammarly Inc.
  • Jasper AI Inc.
  • Microsoft Corp.
  • Midjourney
  • NVIDIA Corp.
  • OpenAI
  • Runway AI Inc.
  • Stability AI
  • Suno.ai
  • Synthesia Ltd.

Qualitative and quantitative analysis of companies has been conducted to help clients understand the wider business environment as well as the strengths and weaknesses of key industry players. Data is qualitatively analyzed to categorize companies as pure play, category-focused, industry-focused, and diversified; it is quantitatively analyzed to categorize companies as dominant, leading, strong, tentative, and weak.

Recent Development and News in Generative ai in content creation market

  • In September, 2024, Adobe Inc. completed its acquisition of a prominent AI video startup, announcing plans to integrate its advanced text-to-video generation technology directly into the Adobe Premiere Pro timeline by the first quarter of 2025.
  • In January, 2025, Anthropic unveiled its Claude 4 series, a new family of models featuring enhanced agentic capabilities and a next-generation constitutional AI framework designed for complex, multi-step enterprise automation tasks.
  • In March, 2025, Cohere announced it secured USD 750 million in a Series D funding round, with the capital earmarked for accelerating the development of industry-specific LLMs tailored for the finance, legal, and healthcare sectors.
  • In May, 2025, Google LLC launched the 'Synthetic Data for Science' initiative, a global program providing verified researchers with access to high-fidelity, AI-generated datasets to accelerate breakthroughs in medical and climate research.

Dive into Technavio’s robust research methodology, blending expert interviews, extensive data synthesis, and validated models for unparalleled Generative AI In Content Creation Market insights. See full methodology.

Market Scope
Page number 294
Base year 2024
Forecast period 2025-2029
Growth momentum & CAGR Accelerate at a CAGR of 32.2%
Market growth 2025-2029 USD 36385.7 million
Market structure Fragmented
YoY growth 2024-2025(%) 27.8%
Key countries US, Canada, Mexico, China, Japan, India, South Korea, Australia, Indonesia, Germany, UK, France, Italy, Spain, The Netherlands, UAE, Saudi Arabia, South Africa, Israel, Turkey, Brazil, Argentina and Colombia
Competitive landscape Leading Companies, Market Positioning of Companies, Competitive Strategies, and Industry Risks

Request Free Sample

Research Analyst Overview

  • The generative AI in content creation market is evolving from generalized tools to specialized, high-value solutions. Boardroom-level strategy now centers on leveraging proprietary data for AI model fine-tuning, creating a distinct competitive advantage. This shift is underpinned by the development of sophisticated multimodal AI systems, including large language models and diffusion models, capable of text-to-image generation and increasingly, text-to-video generation.
  • Enterprises are implementing responsible AI principles and AI safety frameworks to mitigate copyright infringement risk and AI model hallucination. The adoption of on-device AI processing and enterprise-grade AI solutions with robust AI governance features is accelerating. Technologies such as AI voice synthesis, generative video features, and AI-driven video production are becoming integral.
  • Companies using fine-tuned models for AI-powered copywriting and generative design tools report a reduction in content errors by over 30% compared to generic models. Success requires managing computational resource requirements with GPU hardware acceleration and API-based model access, while using conversational AI assistants and AI content assistants to augment workflows.
  • The rise of open-source language models, coupled with AI ethics boards, is pushing for greater transparency through content provenance and digital watermarking, as voice cloning technology and automated transcription become mainstream.

What are the Key Data Covered in this Generative AI In Content Creation Market Research and Growth Report?

  • What is the expected growth of the Generative AI In Content Creation Market between 2025 and 2029?

    • USD 36.39 billion, at a CAGR of 32.2%

  • What segmentation does the market report cover?

    • The report is segmented by Component (Software, Services), Application (Text generation, Image generation, Video generation, Music and audio generation, Others), End-user (Entertainment and media, Marketing and advertising, E-commerce, Gaming, Others) and Geography (North America, APAC, Europe, Middle East and Africa, South America)

  • Which regions are analyzed in the report?

    • North America, APAC, Europe, Middle East and Africa and South America

  • What are the key growth drivers and market challenges?

    • Demand for personalized and high-volume content, Intellectual property rights and unclear legal framework

  • Who are the major players in the Generative AI In Content Creation Market?

    • Adobe Inc., Anthropic, Autodesk Inc., Cohere, CopyAI Inc., Descript, Eleven Labs Inc., Google LLC, Grammarly Inc., Jasper AI Inc., Microsoft Corp., Midjourney, NVIDIA Corp., OpenAI, Runway AI Inc., Stability AI, Suno.ai and Synthesia Ltd.

Market Research Insights

  • The market dynamics are shifting toward specialized applications that deliver measurable business outcomes through workflow integration. The adoption of domain-specific training data is critical, with firms reporting up to a 40% reduction in factual inaccuracies compared to general-purpose models.
  • The use of real-time conversational AI for customer service automation is another key area, improving user satisfaction by over 30% in initial deployments. Furthermore, A/B testing automation for marketing campaigns has accelerated optimization cycles, leading to a 15% improvement in conversion rates.
  • This focus on practical embedded AI capabilities, from AI-powered code assistants to virtual try-on experiences, is driving adoption as organizations move beyond experimentation to seek tangible returns on investment through enhanced human-computer interaction and legacy systems integration.

We can help! Our analysts can customize this generative ai in content creation market research report to meet your requirements.

Get in touch

1. Executive Summary

1.1 Market overview

Executive Summary - Chart on Market Overview
Executive Summary - Data Table on Market Overview
Executive Summary - Chart on Global Market Characteristics
Executive Summary - Chart on Market by Geography
Executive Summary - Chart on Market Segmentation by Component
Executive Summary - Chart on Market Segmentation by Application
Executive Summary - Chart on Market Segmentation by End-user
Executive Summary - Chart on Incremental Growth
Executive Summary - Data Table on Incremental Growth
Executive Summary - Chart on Company Market Positioning

2. Technavio Analysis

2.1 Analysis of price sensitivity, lifecycle, customer purchase basket, adoption rates, and purchase criteria

2.2 Criticality of inputs and Factors of differentiation

Chart on Overview on criticality of inputs and factors of differentiation

2.3 Factors of disruption

Chart on Overview on factors of disruption

2.4 Impact of drivers and challenges

Chart on Impact of drivers and challenges in 2024 and 2029

3. Market Landscape

3.1 Market ecosystem

Chart on Parent Market
Data Table on - Parent Market

3.2 Market characteristics

Chart on Market characteristics analysis

3.3 Value chain analysis

Chart on Value chain analysis

4. Market Sizing

4.1 Market definition

Data Table on Offerings of companies included in the market definition

4.2 Market segment analysis

Market segments

4.3 Market size 2024

4.4 Market outlook: Forecast for 2024-2029

Chart on Global - Market size and forecast 2024-2029 ($ million)
Data Table on Global - Market size and forecast 2024-2029 ($ million)
Chart on Global Market: Year-over-year growth 2024-2029 (%)
Data Table on Global Market: Year-over-year growth 2024-2029 (%)

5. Five Forces Analysis

5.1 Five forces summary

Five forces analysis - Comparison between 2024 and 2029

5.2 Bargaining power of buyers

Bargaining power of buyers - Impact of key factors 2024 and 2029

5.3 Bargaining power of suppliers

Bargaining power of suppliers - Impact of key factors in 2024 and 2029

5.4 Threat of new entrants

Threat of new entrants - Impact of key factors in 2024 and 2029

5.5 Threat of substitutes

Threat of substitutes - Impact of key factors in 2024 and 2029

5.6 Threat of rivalry

Threat of rivalry - Impact of key factors in 2024 and 2029

5.7 Market condition

Chart on Market condition - Five forces 2024 and 2029

6. Market Segmentation by Component

6.1 Market segments

Chart on Component - Market share 2024-2029 (%)
Data Table on Component - Market share 2024-2029 (%)

6.2 Comparison by Component

Chart on Comparison by Component
Data Table on Comparison by Component

6.3 Software - Market size and forecast 2024-2029

Chart on Software - Market size and forecast 2024-2029 ($ million)
Data Table on Software - Market size and forecast 2024-2029 ($ million)
Chart on Software - Year-over-year growth 2024-2029 (%)
Data Table on Software - Year-over-year growth 2024-2029 (%)

6.4 Services - Market size and forecast 2024-2029

Chart on Services - Market size and forecast 2024-2029 ($ million)
Data Table on Services - Market size and forecast 2024-2029 ($ million)
Chart on Services - Year-over-year growth 2024-2029 (%)
Data Table on Services - Year-over-year growth 2024-2029 (%)

6.5 Market opportunity by Component

Market opportunity by Component ($ million)
Data Table on Market opportunity by Component ($ million)

7. Market Segmentation by Application

7.1 Market segments

Chart on Application - Market share 2024-2029 (%)
Data Table on Application - Market share 2024-2029 (%)

7.2 Comparison by Application

Chart on Comparison by Application
Data Table on Comparison by Application

7.3 Text generation - Market size and forecast 2024-2029

Chart on Text generation - Market size and forecast 2024-2029 ($ million)
Data Table on Text generation - Market size and forecast 2024-2029 ($ million)
Chart on Text generation - Year-over-year growth 2024-2029 (%)
Data Table on Text generation - Year-over-year growth 2024-2029 (%)

7.4 Image generation - Market size and forecast 2024-2029

Chart on Image generation - Market size and forecast 2024-2029 ($ million)
Data Table on Image generation - Market size and forecast 2024-2029 ($ million)
Chart on Image generation - Year-over-year growth 2024-2029 (%)
Data Table on Image generation - Year-over-year growth 2024-2029 (%)

7.5 Video generation - Market size and forecast 2024-2029

Chart on Video generation - Market size and forecast 2024-2029 ($ million)
Data Table on Video generation - Market size and forecast 2024-2029 ($ million)
Chart on Video generation - Year-over-year growth 2024-2029 (%)
Data Table on Video generation - Year-over-year growth 2024-2029 (%)

7.6 Music and audio generation - Market size and forecast 2024-2029

Chart on Music and audio generation - Market size and forecast 2024-2029 ($ million)
Data Table on Music and audio generation - Market size and forecast 2024-2029 ($ million)
Chart on Music and audio generation - Year-over-year growth 2024-2029 (%)
Data Table on Music and audio generation - Year-over-year growth 2024-2029 (%)

7.7 Others - Market size and forecast 2024-2029

Chart on Others - Market size and forecast 2024-2029 ($ million)
Data Table on Others - Market size and forecast 2024-2029 ($ million)
Chart on Others - Year-over-year growth 2024-2029 (%)
Data Table on Others - Year-over-year growth 2024-2029 (%)

7.8 Market opportunity by Application

Market opportunity by Application ($ million)
Data Table on Market opportunity by Application ($ million)

8. Market Segmentation by End-user

8.1 Market segments

Chart on End-user - Market share 2024-2029 (%)
Data Table on End-user - Market share 2024-2029 (%)

8.2 Comparison by End-user

Chart on Comparison by End-user
Data Table on Comparison by End-user

8.3 Entertainment and media - Market size and forecast 2024-2029

Chart on Entertainment and media - Market size and forecast 2024-2029 ($ million)
Data Table on Entertainment and media - Market size and forecast 2024-2029 ($ million)
Chart on Entertainment and media - Year-over-year growth 2024-2029 (%)
Data Table on Entertainment and media - Year-over-year growth 2024-2029 (%)

8.4 Marketing and advertising - Market size and forecast 2024-2029

Chart on Marketing and advertising - Market size and forecast 2024-2029 ($ million)
Data Table on Marketing and advertising - Market size and forecast 2024-2029 ($ million)
Chart on Marketing and advertising - Year-over-year growth 2024-2029 (%)
Data Table on Marketing and advertising - Year-over-year growth 2024-2029 (%)

8.5 E-commerce - Market size and forecast 2024-2029

Chart on E-commerce - Market size and forecast 2024-2029 ($ million)
Data Table on E-commerce - Market size and forecast 2024-2029 ($ million)
Chart on E-commerce - Year-over-year growth 2024-2029 (%)
Data Table on E-commerce - Year-over-year growth 2024-2029 (%)

8.6 Gaming - Market size and forecast 2024-2029

Chart on Gaming - Market size and forecast 2024-2029 ($ million)
Data Table on Gaming - Market size and forecast 2024-2029 ($ million)
Chart on Gaming - Year-over-year growth 2024-2029 (%)
Data Table on Gaming - Year-over-year growth 2024-2029 (%)

8.7 Others - Market size and forecast 2024-2029

Chart on Others - Market size and forecast 2024-2029 ($ million)
Data Table on Others - Market size and forecast 2024-2029 ($ million)
Chart on Others - Year-over-year growth 2024-2029 (%)
Data Table on Others - Year-over-year growth 2024-2029 (%)

8.8 Market opportunity by End-user

Market opportunity by End-user ($ million)
Data Table on Market opportunity by End-user ($ million)

9. Customer Landscape

9.1 Customer landscape overview

Analysis of price sensitivity, lifecycle, customer purchase basket, adoption rates, and purchase criteria

10. Geographic Landscape

10.1 Geographic segmentation

Chart on Market share by geography 2024-2029 (%)
Data Table on Market share by geography 2024-2029 (%)

10.2 Geographic comparison

Chart on Geographic comparison
Data Table on Geographic comparison

10.3 North America - Market size and forecast 2024-2029

Chart on North America - Market size and forecast 2024-2029 ($ million)
Data Table on North America - Market size and forecast 2024-2029 ($ million)
Chart on North America - Year-over-year growth 2024-2029 (%)
Data Table on North America - Year-over-year growth 2024-2029 (%)
Chart on Regional Comparison - North America
Data Table on Regional Comparison - North America

10.3.1 US - Market size and forecast 2024-2029

Chart on US - Market size and forecast 2024-2029 ($ million)
Data Table on US - Market size and forecast 2024-2029 ($ million)
Chart on US - Year-over-year growth 2024-2029 (%)
Data Table on US - Year-over-year growth 2024-2029 (%)

10.3.2 Canada - Market size and forecast 2024-2029

Chart on Canada - Market size and forecast 2024-2029 ($ million)
Data Table on Canada - Market size and forecast 2024-2029 ($ million)
Chart on Canada - Year-over-year growth 2024-2029 (%)
Data Table on Canada - Year-over-year growth 2024-2029 (%)

10.3.3 Mexico - Market size and forecast 2024-2029

Chart on Mexico - Market size and forecast 2024-2029 ($ million)
Data Table on Mexico - Market size and forecast 2024-2029 ($ million)
Chart on Mexico - Year-over-year growth 2024-2029 (%)
Data Table on Mexico - Year-over-year growth 2024-2029 (%)

10.4 APAC - Market size and forecast 2024-2029

Chart on APAC - Market size and forecast 2024-2029 ($ million)
Data Table on APAC - Market size and forecast 2024-2029 ($ million)
Chart on APAC - Year-over-year growth 2024-2029 (%)
Data Table on APAC - Year-over-year growth 2024-2029 (%)
Chart on Regional Comparison - APAC
Data Table on Regional Comparison - APAC

10.4.1 China - Market size and forecast 2024-2029

Chart on China - Market size and forecast 2024-2029 ($ million)
Data Table on China - Market size and forecast 2024-2029 ($ million)
Chart on China - Year-over-year growth 2024-2029 (%)
Data Table on China - Year-over-year growth 2024-2029 (%)

10.4.2 Japan - Market size and forecast 2024-2029

Chart on Japan - Market size and forecast 2024-2029 ($ million)
Data Table on Japan - Market size and forecast 2024-2029 ($ million)
Chart on Japan - Year-over-year growth 2024-2029 (%)
Data Table on Japan - Year-over-year growth 2024-2029 (%)

10.4.3 India - Market size and forecast 2024-2029

Chart on India - Market size and forecast 2024-2029 ($ million)
Data Table on India - Market size and forecast 2024-2029 ($ million)
Chart on India - Year-over-year growth 2024-2029 (%)
Data Table on India - Year-over-year growth 2024-2029 (%)

10.4.4 South Korea - Market size and forecast 2024-2029

Chart on South Korea - Market size and forecast 2024-2029 ($ million)
Data Table on South Korea - Market size and forecast 2024-2029 ($ million)
Chart on South Korea - Year-over-year growth 2024-2029 (%)
Data Table on South Korea - Year-over-year growth 2024-2029 (%)

10.4.5 Australia - Market size and forecast 2024-2029

Chart on Australia - Market size and forecast 2024-2029 ($ million)
Data Table on Australia - Market size and forecast 2024-2029 ($ million)
Chart on Australia - Year-over-year growth 2024-2029 (%)
Data Table on Australia - Year-over-year growth 2024-2029 (%)

10.4.6 Indonesia - Market size and forecast 2024-2029

Chart on Indonesia - Market size and forecast 2024-2029 ($ million)
Data Table on Indonesia - Market size and forecast 2024-2029 ($ million)
Chart on Indonesia - Year-over-year growth 2024-2029 (%)
Data Table on Indonesia - Year-over-year growth 2024-2029 (%)

10.5 Europe - Market size and forecast 2024-2029

Chart on Europe - Market size and forecast 2024-2029 ($ million)
Data Table on Europe - Market size and forecast 2024-2029 ($ million)
Chart on Europe - Year-over-year growth 2024-2029 (%)
Data Table on Europe - Year-over-year growth 2024-2029 (%)
Chart on Regional Comparison - Europe
Data Table on Regional Comparison - Europe

10.5.1 Germany - Market size and forecast 2024-2029

Chart on Germany - Market size and forecast 2024-2029 ($ million)
Data Table on Germany - Market size and forecast 2024-2029 ($ million)
Chart on Germany - Year-over-year growth 2024-2029 (%)
Data Table on Germany - Year-over-year growth 2024-2029 (%)

10.5.2 UK - Market size and forecast 2024-2029

Chart on UK - Market size and forecast 2024-2029 ($ million)
Data Table on UK - Market size and forecast 2024-2029 ($ million)
Chart on UK - Year-over-year growth 2024-2029 (%)
Data Table on UK - Year-over-year growth 2024-2029 (%)

10.5.3 France - Market size and forecast 2024-2029

Chart on France - Market size and forecast 2024-2029 ($ million)
Data Table on France - Market size and forecast 2024-2029 ($ million)
Chart on France - Year-over-year growth 2024-2029 (%)
Data Table on France - Year-over-year growth 2024-2029 (%)

10.5.4 Italy - Market size and forecast 2024-2029

Chart on Italy - Market size and forecast 2024-2029 ($ million)
Data Table on Italy - Market size and forecast 2024-2029 ($ million)
Chart on Italy - Year-over-year growth 2024-2029 (%)
Data Table on Italy - Year-over-year growth 2024-2029 (%)

10.5.5 Spain - Market size and forecast 2024-2029

Chart on Spain - Market size and forecast 2024-2029 ($ million)
Data Table on Spain - Market size and forecast 2024-2029 ($ million)
Chart on Spain - Year-over-year growth 2024-2029 (%)
Data Table on Spain - Year-over-year growth 2024-2029 (%)

10.5.6 The Netherlands - Market size and forecast 2024-2029

Chart on The Netherlands - Market size and forecast 2024-2029 ($ million)
Data Table on The Netherlands - Market size and forecast 2024-2029 ($ million)
Chart on The Netherlands - Year-over-year growth 2024-2029 (%)
Data Table on The Netherlands - Year-over-year growth 2024-2029 (%)

10.6 Middle East and Africa - Market size and forecast 2024-2029

Chart on Middle East and Africa - Market size and forecast 2024-2029 ($ million)
Data Table on Middle East and Africa - Market size and forecast 2024-2029 ($ million)
Chart on Middle East and Africa - Year-over-year growth 2024-2029 (%)
Data Table on Middle East and Africa - Year-over-year growth 2024-2029 (%)
Chart on Regional Comparison - Middle East and Africa
Data Table on Regional Comparison - Middle East and Africa

10.6.1 UAE - Market size and forecast 2024-2029

Chart on UAE - Market size and forecast 2024-2029 ($ million)
Data Table on UAE - Market size and forecast 2024-2029 ($ million)
Chart on UAE - Year-over-year growth 2024-2029 (%)
Data Table on UAE - Year-over-year growth 2024-2029 (%)

10.6.2 Saudi Arabia - Market size and forecast 2024-2029

Chart on Saudi Arabia - Market size and forecast 2024-2029 ($ million)
Data Table on Saudi Arabia - Market size and forecast 2024-2029 ($ million)
Chart on Saudi Arabia - Year-over-year growth 2024-2029 (%)
Data Table on Saudi Arabia - Year-over-year growth 2024-2029 (%)

10.6.3 South Africa - Market size and forecast 2024-2029

Chart on South Africa - Market size and forecast 2024-2029 ($ million)
Data Table on South Africa - Market size and forecast 2024-2029 ($ million)
Chart on South Africa - Year-over-year growth 2024-2029 (%)
Data Table on South Africa - Year-over-year growth 2024-2029 (%)

10.6.4 Israel - Market size and forecast 2024-2029

Chart on Israel - Market size and forecast 2024-2029 ($ million)
Data Table on Israel - Market size and forecast 2024-2029 ($ million)
Chart on Israel - Year-over-year growth 2024-2029 (%)
Data Table on Israel - Year-over-year growth 2024-2029 (%)

10.6.5 Turkey - Market size and forecast 2024-2029

Chart on Turkey - Market size and forecast 2024-2029 ($ million)
Data Table on Turkey - Market size and forecast 2024-2029 ($ million)
Chart on Turkey - Year-over-year growth 2024-2029 (%)
Data Table on Turkey - Year-over-year growth 2024-2029 (%)

10.7 South America - Market size and forecast 2024-2029

Chart on South America - Market size and forecast 2024-2029 ($ million)
Data Table on South America - Market size and forecast 2024-2029 ($ million)
Chart on South America - Year-over-year growth 2024-2029 (%)
Data Table on South America - Year-over-year growth 2024-2029 (%)
Chart on Regional Comparison - South America
Data Table on Regional Comparison - South America

10.7.1 Brazil - Market size and forecast 2024-2029

Chart on Brazil - Market size and forecast 2024-2029 ($ million)
Data Table on Brazil - Market size and forecast 2024-2029 ($ million)
Chart on Brazil - Year-over-year growth 2024-2029 (%)
Data Table on Brazil - Year-over-year growth 2024-2029 (%)

10.7.2 Argentina - Market size and forecast 2024-2029

Chart on Argentina - Market size and forecast 2024-2029 ($ million)
Data Table on Argentina - Market size and forecast 2024-2029 ($ million)
Chart on Argentina - Year-over-year growth 2024-2029 (%)
Data Table on Argentina - Year-over-year growth 2024-2029 (%)

10.7.3 Colombia - Market size and forecast 2024-2029

Chart on Colombia - Market size and forecast 2024-2029 ($ million)
Data Table on Colombia - Market size and forecast 2024-2029 ($ million)
Chart on Colombia - Year-over-year growth 2024-2029 (%)
Data Table on Colombia - Year-over-year growth 2024-2029 (%)

10.8 Market opportunity by geography

Market opportunity by geography ($ million)
Data Tables on Market opportunity by geography ($ million)

11. Drivers, Challenges, and Opportunity

11.1 Market drivers

Demand for personalized and high-volume content
Rapid advancements in AI technology and accessibility
Significant corporate investment and strategic integration

11.2 Market challenges

Intellectual property rights and unclear legal framework
Content accuracy, bias, and proliferation of misinformation
High implementation costs and integration complexity

11.3 Impact of drivers and challenges

Impact of drivers and challenges in 2024 and 2029

11.4 Market opportunities

Shift towards multimodality and native integration
Rise of specialized and fine-tuned AI models
Intensifying focus on responsible AI, governance, and ethical frameworks

12. Competitive Landscape

12.1 Overview

12.2

Overview on criticality of inputs and factors of differentiation

12.3 Landscape disruption

Overview on factors of disruption

12.4 Industry risks

Impact of key risks on business

13. Competitive Analysis

13.1 Companies profiled

Companies covered

13.2 Company ranking index

13.3 Market positioning of companies

Matrix on companies position and classification

13.4 Adobe Inc.

Adobe Inc. - Overview
Adobe Inc. - Business segments
Adobe Inc. - Key news
Adobe Inc. - Key offerings
Adobe Inc. - Segment focus
SWOT

13.5 Anthropic

Anthropic - Overview
Anthropic - Product / Service
Anthropic - Key offerings
SWOT

13.6 Cohere

Cohere - Overview
Cohere - Product / Service
Cohere - Key offerings
SWOT

13.7 CopyAI Inc.

CopyAI Inc. - Overview
CopyAI Inc. - Product / Service
CopyAI Inc. - Key offerings
SWOT

13.8 Eleven Labs Inc.

Eleven Labs Inc. - Overview
Eleven Labs Inc. - Product / Service
Eleven Labs Inc. - Key offerings
SWOT

13.9 Google LLC

Google LLC - Overview
Google LLC - Product / Service
Google LLC - Key offerings
SWOT

13.10 Jasper AI Inc.

Jasper AI Inc. - Overview
Jasper AI Inc. - Product / Service
Jasper AI Inc. - Key offerings
SWOT

13.11 Microsoft Corp.

Microsoft Corp. - Overview
Microsoft Corp. - Business segments
Microsoft Corp. - Key news
Microsoft Corp. - Key offerings
Microsoft Corp. - Segment focus
SWOT

13.12 Midjourney

Midjourney - Overview
Midjourney - Product / Service
Midjourney - Key offerings
SWOT

13.13 NVIDIA Corp.

NVIDIA Corp. - Overview
NVIDIA Corp. - Business segments
NVIDIA Corp. - Key news
NVIDIA Corp. - Key offerings
NVIDIA Corp. - Segment focus
SWOT

13.14 OpenAI

OpenAI - Overview
OpenAI - Product / Service
OpenAI - Key offerings
SWOT

13.15 Runway AI Inc.

Runway AI Inc. - Overview
Runway AI Inc. - Product / Service
Runway AI Inc. - Key offerings
SWOT

13.16 Stability AI

Stability AI - Overview
Stability AI - Product / Service
Stability AI - Key offerings
SWOT

13.17 Suno.ai

Suno.ai - Overview
Suno.ai - Product / Service
Suno.ai - Key offerings
SWOT

13.18 Synthesia Ltd.

Synthesia Ltd. - Overview
Synthesia Ltd. - Product / Service
Synthesia Ltd. - Key offerings
SWOT

14. Appendix

14.1 Scope of the report

Market definition
Objectives
Notes and caveats

14.2 Inclusions and exclusions checklist

Inclusions checklist
Exclusions checklist

14.3 Currency conversion rates for US$

14.4 Research methodology

14.5 Data procurement

Information sources

14.6 Data validation

14.7 Validation techniques employed for market sizing

14.8 Data synthesis

14.9 360 degree market analysis

14.10 List of abbreviations

Research Methodology

Technavio presents a detailed picture of the market by way of study, synthesis, and summation of data from multiple sources. The analysts have presented the various facets of the market with a particular focus on identifying the key industry influencers. The data thus presented is comprehensive, reliable, and the result of extensive research, both primary and secondary.

INFORMATION SOURCES

Primary sources

  • Manufacturers and suppliers
  • Channel partners
  • Industry experts
  • Strategic decision makers

Secondary sources

  • Industry journals and periodicals
  • Government data
  • Financial reports of key industry players
  • Historical data
  • Press releases

DATA ANALYSIS

Data Synthesis

  • Collation of data
  • Estimation of key figures
  • Analysis of derived insights

Data Validation

  • Triangulation with data models
  • Reference against proprietary databases
  • Corroboration with industry experts

REPORT WRITING

Qualitative

  • Market drivers
  • Market challenges
  • Market trends
  • Five forces analysis

Quantitative

  • Market size and forecast
  • Market segmentation
  • Geographical insights
  • Competitive landscape

Interested in this report?

Get your sample now to see our research methodology and insights!

Download Now

Frequently Asked Questions

Generative AI In Content Creation market growth will increase by USD 36385.7 million during 2025-2029.

The Generative AI In Content Creation market is expected to grow at a CAGR of 32.2% during 2025-2029.

Generative AI In Content Creation market is segmented by Component (Software, Services) Application (Text generation, Image generation, Video generation, Music and audio generation, Others) End-user (Entertainment and media, Marketing and advertising, E-commerce, Gaming, Others)

Adobe Inc., Anthropic, Autodesk Inc., Cohere, CopyAI Inc., Descript, Eleven Labs Inc., Google LLC, Grammarly Inc., Jasper AI Inc., Microsoft Corp., Midjourney, NVIDIA Corp., OpenAI, Runway AI Inc., Stability AI, Suno.ai, Synthesia Ltd. are a few of the key vendors in the Generative AI In Content Creation market.

North America will register the highest growth rate of 35.2% among the other regions. Therefore, the Generative AI In Content Creation market in North America is expected to garner significant business opportunities for the vendors during the forecast period.

US, Canada, Mexico, China, Japan, India, South Korea, Australia, Indonesia, Germany, UK, France, Italy, Spain, The Netherlands, UAE, Saudi Arabia, South Africa, Israel, Turkey, Brazil, Argentina, Colombia

  • Demand for personalized and high-volume content is the driving factor this market.

The Generative AI In Content Creation market vendors should focus on grabbing business opportunities from the Component segment as it accounted for the largest market share in the base year.