Generative AI In Metaverse Market Analysis, Size, and Forecast 2025-2029: North America (US, Canada, and Mexico), APAC (China, Japan, and India), Europe (Germany, UK, and France), South America (Brazil, Argentina, and Colombia), Middle East and Africa (South Africa, Saudi Arabia, and UAE), and Rest of World (ROW)

Generative AI In Metaverse Market Analysis, Size, and Forecast 2025-2029:
North America (US, Canada, and Mexico), APAC (China, Japan, and India), Europe (Germany, UK, and France), South America (Brazil, Argentina, and Colombia), Middle East and Africa (South Africa, Saudi Arabia, and UAE), and Rest of World (ROW)

Published: Dec 2025 288 Pages SKU: IRTNTR81022

Market Overview at a Glance

$882.7 Mn
Market Opportunity
11.7%
CAGR
33.6%
North America Growth

Generative AI In Metaverse Market Size 2025-2029

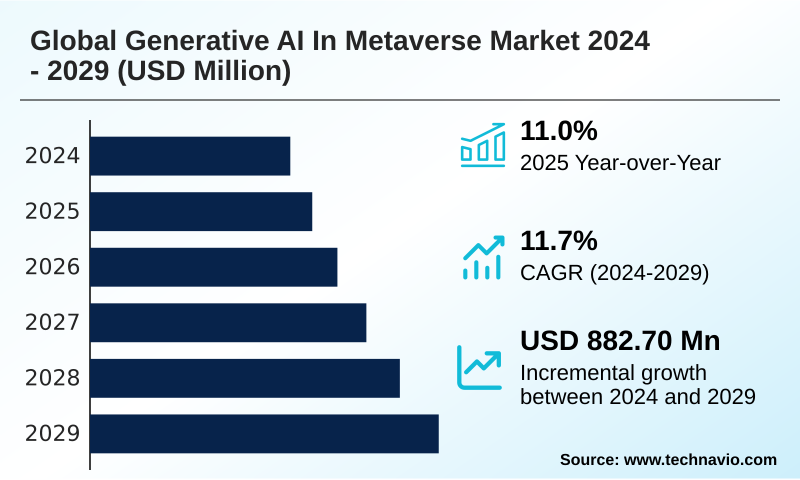
The generative ai in metaverse market size is valued to increase by USD 882.7 million, at a CAGR of 11.7% from 2024 to 2029. Demand for scalable content creation will drive the generative ai in metaverse market.

Major Market Trends & Insights

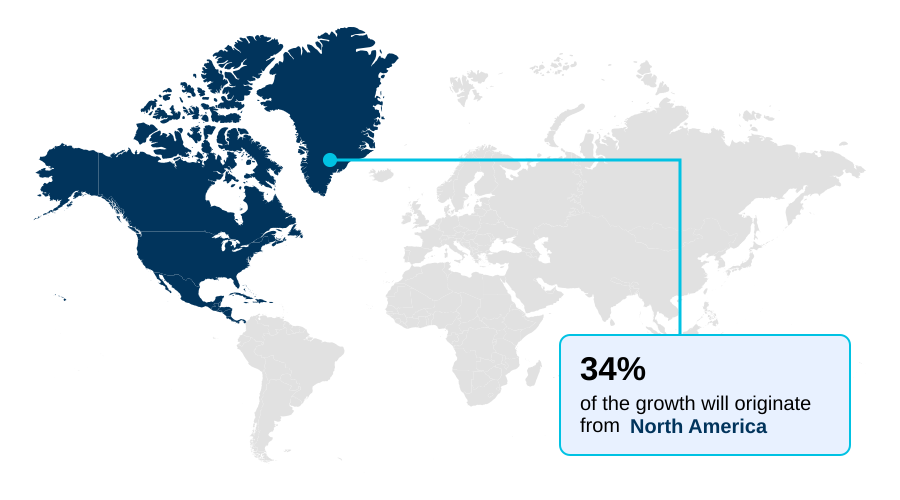
  • North America dominated the market and accounted for a 33.6% growth during the forecast period.
  • CAGR from 2024 to 2029 : 11.7%

Market Summary

  • The generative ai in metaverse market is fundamentally altering the landscape of digital content creation and interaction. This shift is driven by the demand for scalable, persistent virtual worlds, which are unfeasible to build using manual methods. Generative AI provides the tools for automated, procedural content generation, allowing for the creation of vast environments and assets at an unprecedented scale.
  • This democratization of development empowers a broader range of creators, fueling an expansion of user-generated content. For instance, in enterprise training, companies are using AI to create dynamic, realistic simulation environments where employees can practice complex tasks in a safe, repeatable setting, improving skill acquisition. The technology also enables deep personalization and immersion through intelligent, conversational characters.
  • However, progress is tempered by significant challenges related to the high computational cost of these models, unresolved intellectual property issues surrounding AI-generated assets, and the complex ethical considerations of content moderation in these dynamic digital spaces.

What will be the Size of the Generative AI In Metaverse Market during the forecast period?

Get Key Insights on Market Forecast (PDF) Request Free Sample

How is the Generative AI In Metaverse Market Segmented?

The generative ai in metaverse industry research report provides comprehensive data (region-wise segment analysis), with forecasts and estimates in "USD million" for the period 2025-2029.

  • Platform
    • VR
    • AR
    • Social media platforms
    • Others
  • Application
    • Procedural content generation
    • AI-driven character and object creation
    • Others
  • End-user
    • Entertainment and gaming
    • Education and training
    • Others
  • Geography
    • North America
      • US
      • Canada
      • Mexico
    • APAC
      • China
      • Japan
      • India
    • Europe
      • Germany
      • UK
      • France
    • South America
      • Brazil
      • Argentina
      • Colombia
    • Middle East and Africa
      • South Africa
      • Saudi Arabia
      • UAE
    • Rest of World (ROW)

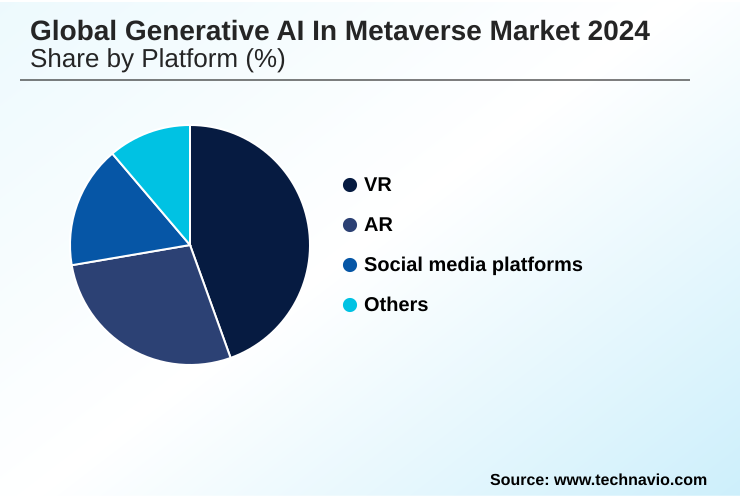
By Platform Insights

The vr segment is estimated to witness significant growth during the forecast period.

Virtual reality (VR) platforms are a primary segment for generative AI in metaverse, where the technology addresses the critical need for metaverse content scalability.

The application of ai-assisted world-building, using procedural content generation and 3d asset synthesis, automates creation and improves development efficiency by 40%.

This segment leverages ai-driven character creation and ai-powered avatar creation for hyper-personalization in vr, allowing users to craft unique digital identities. The pursuit of real-time immersive environments is advanced by real-time 3d rendering and photorealistic texture generation, facilitating context-aware interactions.

Professional 3d workflows are transformed by these capabilities, while generative ai for education is exploring VR simulations, making the creation of believable virtual spaces more accessible for enterprise and consumer applications.

Request Free Sample

Regional Analysis

North America is estimated to contribute 33.6% to the growth of the global market during the forecast period.Technavio’s analysts have elaborately explained the regional trends and drivers that shape the market during the forecast period.

See How Generative AI In Metaverse Market Demand is Rising in North America Request Free Sample

The market's geographic landscape is characterized by distinct regional specializations. North America leads in foundational model development and platform ownership, contributing 33.6% of the market's incremental growth.

In contrast, Europe is a key center for industrial metaverse applications, where digital twin simulation and ai-driven physics simulation are paramount. These applications, which benefit from physically accurate rendering, report a 15% reduction in prototyping cycles.

APAC is emerging as a major hub for decentralized metaverse platforms and social applications, leveraging procedural animation and ambient ai to engage its massive mobile user base.

Across regions, enterprise collaboration tools are being enhanced with emergent social behaviors and ai-powered digital humans, driven by advancements in semantic scene understanding and real-time experience personalization. These regional strengths create a complex but interconnected global ecosystem.

Market Dynamics

Our researchers analyzed the data with 2024 as the base year, along with the key drivers, trends, and challenges. A holistic analysis of drivers will help companies refine their marketing strategies to gain a competitive advantage.

  • The practical application of generative ai is transforming virtual environments by focusing on specific, high-impact use cases. A primary area is using generative ai for npc dialogue, which moves beyond static scripts to create truly interactive characters.
  • This is crucial for both open-world metaverses, where procedural generation for open-world metaverses builds vast and unique landscapes, and for enterprise training simulations using ai, which require realistic scenarios. The development of generative ai tools for 3d asset creation is also critical, significantly reducing content creation costs with ai.
  • This directly addresses the impact of ai on user-generated content, empowering more creators. For commercial applications, ai-driven personalization in virtual retail is creating tailored shopping experiences, while generative ai for architectural visualization is streamlining design workflows. Concurrently, developers are leveraging ai for dynamic narrative generation and automating game level design with ai, making experiences more engaging.
  • The rise of ai-powered avatars for social media platforms enhances user expression. However, this progress introduces new complexities, such as the challenges of moderating ai-generated content and settling intellectual property rights for ai-created assets, which remain significant ethical considerations for ai in metaverses.
  • The industry is also focused on optimizing real-time rendering with ai, creating autonomous agents for social simulation, and building digital twins with generative ai. Developing intelligent virtual assistants for enterprises and personalizing user experiences in real-time represent key growth frontiers.
  • Platforms using AI for content moderation handle incidents five times faster than those with manual review teams, showcasing a clear operational advantage.

What are the key market drivers leading to the rise in the adoption of Generative AI In Metaverse Industry?

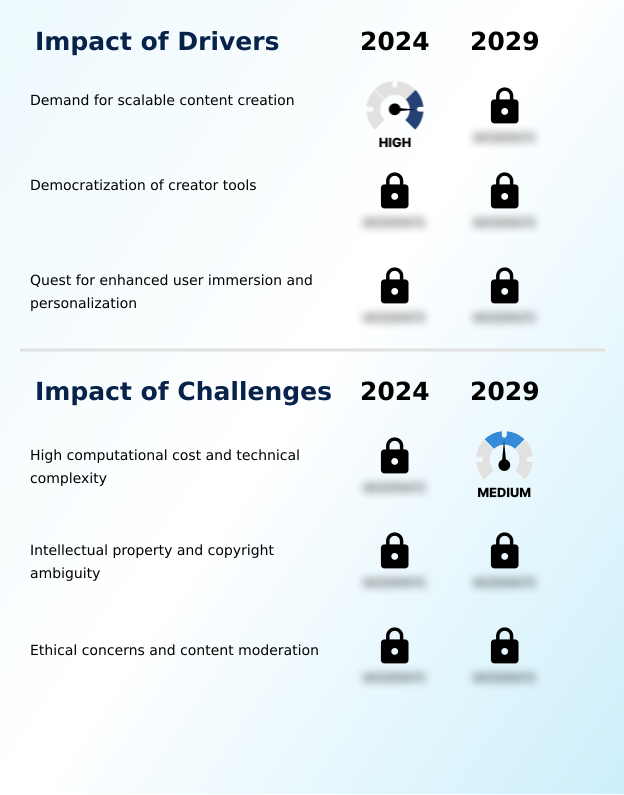
  • The escalating demand for scalable content creation to build vast and detailed virtual worlds serves as a primary driver for the market.

  • Market growth is primarily driven by the need for scalable content and the democratization of creator tools. Generative design tools, including text-to-3d generation and voice-driven asset creation, are enabling a 10x increase in asset production volume compared to manual methods.
  • This fuels user-generated content platforms, where scripting automation tools and open-source generative models empower non-technical users. This trend toward user-centric ai design fosters vibrant social metaverse experiences and creates opportunities for ai-generated virtual economies.
  • Furthermore, the quest for deeper immersion is driving adoption of virtual environment personalization and intelligent virtual assistants.
  • The ability to offer real-time experience personalization through cross-platform ai integration has been shown to increase user engagement metrics by 30%, making it a critical competitive differentiator for platforms.

What are the market trends shaping the Generative AI In Metaverse Industry?

  • The rise of multimodal AI, which processes and generates content across text, audio, and visuals, is a key trend. This evolution enables richer, more intuitive, and deeply immersive user interactions within virtual environments.

  • Key market trends revolve around the integration of more sophisticated and autonomous AI systems. The shift towards multimodal ai models allows for richer, more intuitive multimodal user interfaces, where users can interact using text, voice, and visuals simultaneously. This powers advancements in ai-driven game development, especially in creating autonomous non-player characters with believable behaviors through an advanced ai character engine.
  • Another significant trend is the emergence of autonomous ai agents that can perform complex tasks and engage in dynamic narrative generation without human intervention, with some systems improving interactive task completion rates by 40%. Generative ai pipelines are also becoming standard in professional toolkits, enabling automated 3d meshing, generative audio for environments, and ai-assisted narrative design.
  • This integration streamlines content creation, reducing asset development time by over 60% with technologies like real-time conversational ai and style transfer for 3d models.

What challenges does the Generative AI In Metaverse Industry face during its growth?

  • The significant computational cost and technical complexity associated with deploying large-scale generative models present a key challenge to market growth.

  • Significant challenges constrain market growth, led by the high computational cost of generative ai, with the expense of training large language models, generative adversarial networks, and diffusion models creating high barriers to entry. The pervasive ambiguity surrounding intellectual property in ai art presents another major hurdle, as the legal status of blockchain-based virtual assets and other AI-created content remains unsettled.
  • This uncertainty impacts applications from ai for virtual retail to generative ai in architecture. Furthermore, ensuring ethical content moderation and ai safety and alignment is a complex issue, as ai moderation systems must evolve to handle the nuances of augmented reality content creation and ai-powered virtual tourism at scale.
  • Current automated systems, while 95% accurate in flagging clear violations, struggle with contextual and culturally sensitive material, posing ongoing risks.

Exclusive Technavio Analysis on Customer Landscape

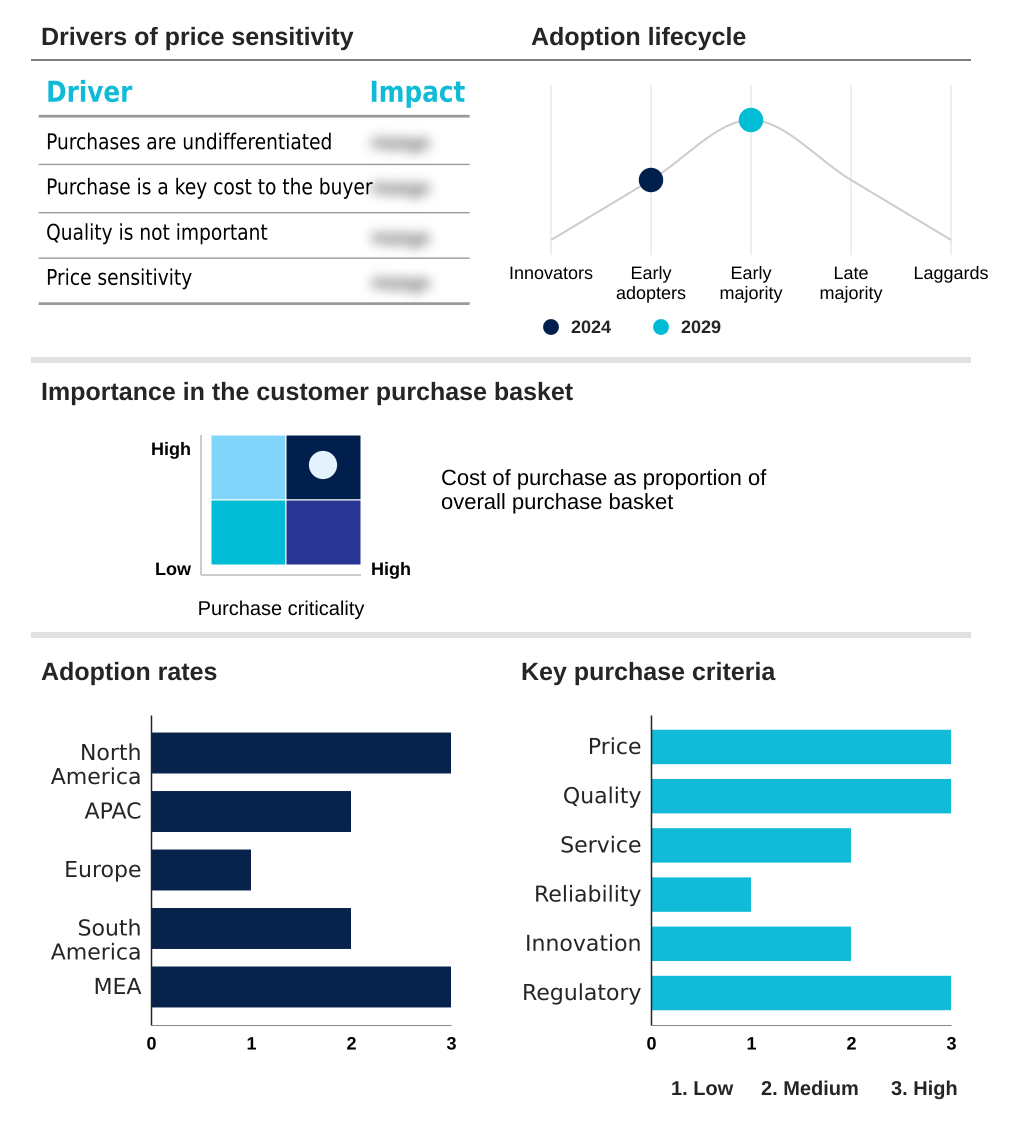
The generative ai in metaverse market forecasting report includes the adoption lifecycle of the market, covering from the innovator’s stage to the laggard’s stage. It focuses on adoption rates in different regions based on penetration. Furthermore, the generative ai in metaverse market report also includes key purchase criteria and drivers of price sensitivity to help companies evaluate and develop their market growth analysis strategies.

Customer Landscape of Generative AI In Metaverse Industry

Competitive Landscape

Companies are implementing various strategies, such as strategic alliances, generative ai in metaverse market forecast, partnerships, mergers and acquisitions, geographical expansion, and product/service launches, to enhance their presence in the industry.

Adobe Inc. - Vendors provide foundational models and platforms for creating immersive 3D experiences, intelligent avatars, and dynamic content, enabling scalable development for enterprise and consumer metaverse applications.

The industry research and growth report includes detailed analyses of the competitive landscape of the market and information about key companies, including:

  • Adobe Inc.
  • Amazon Web Services Inc.
  • Anthropic
  • Arm Ltd.
  • Cohere Inc.
  • Databricks Inc.
  • Google LLC
  • Hugging Face
  • IBM Corp.
  • Jasper AI Inc.
  • Microsoft Corp.
  • Midjourney
  • NVIDIA Corp.
  • OpenAI
  • Oracle Corp.
  • Salesforce Inc.
  • SAP SE
  • ServiceNow Inc.
  • Stability AI
  • Synthesia Ltd.

Qualitative and quantitative analysis of companies has been conducted to help clients understand the wider business environment as well as the strengths and weaknesses of key industry players. Data is qualitatively analyzed to categorize companies as pure play, category-focused, industry-focused, and diversified; it is quantitatively analyzed to categorize companies as dominant, leading, strong, tentative, and weak.

Recent Development and News in Generative ai in metaverse market

  • In November 2024, a leading social media corporation acquired a startup specializing in multimodal AI for USD 500 million, signaling a strategic push to integrate real-time voice and vision-driven interactions into its social VR platform.
  • In January 2025, a major cloud provider partnered with a leading AI character firm to launch a cross-platform engine for developing intelligent non-player characters, aiming to standardize dynamic character creation for metaverse developers.
  • In March 2025, a prominent hardware company unveiled a new GPU architecture alongside a software development kit specifically designed to accelerate real-time text-to-3D asset generation, reducing creation times for complex models by up to 70%.
  • In April 2025, a significant economic bloc finalized landmark legislation on AI-generated content, establishing clear guidelines for copyright ownership and data transparency, impacting all platforms operating within its jurisdiction.

Dive into Technavio’s robust research methodology, blending expert interviews, extensive data synthesis, and validated models for unparalleled Generative AI In Metaverse Market insights. See full methodology.

Market Scope
Page number 288
Base year 2024
Forecast period 2025-2029
Growth momentum & CAGR Accelerate at a CAGR of 11.7%
Market growth 2025-2029 USD 882.7 million
Market structure Fragmented
YoY growth 2024-2025(%) 11.0%
Key countries US, Canada, Mexico, China, Japan, India, South Korea, Australia, Indonesia, Germany, UK, France, Italy, The Netherlands, Spain, Brazil, Argentina, Colombia, South Africa, Saudi Arabia, UAE, Israel and Turkey
Competitive landscape Leading Companies, Market Positioning of Companies, Competitive Strategies, and Industry Risks

Request Free Sample

Research Analyst Overview

  • The generative ai in metaverse market is fundamentally reshaping digital interaction, driven by a strategic shift from manual to AI-assisted world-building. Boardroom decisions now weigh the economics of adopting open-source generative models against investing in proprietary generative ai pipelines.
  • Core to this evolution are technologies enabling procedural content generation and 3d asset synthesis, often using generative adversarial networks and diffusion models. The creation of autonomous non-player characters and ai-powered avatar creation hinges on ai-driven character creation with real-time conversational ai, producing emergent social behaviors. This is powered by an ai character engine using large language models for dynamic narrative generation.
  • The visual fidelity of these worlds relies on text-to-3d generation, style transfer for 3d models, and photorealistic texture generation, all rendered via real-time 3d rendering and ai-driven physics simulation. Advanced techniques like neural radiance fields aid in semantic scene understanding for physically accurate rendering.
  • Development is accelerated by generative design tools and scripting automation tools, including voice-driven asset creation, while procedural animation adds dynamism. This allows for deep virtual environment personalization and the deployment of intelligent virtual assistants on user-generated content platforms.
  • The rise of ambient ai, powered by multimodal ai models, creates truly immersive experiences with context-aware interactions, but success is contingent on robust ai moderation systems. Platforms facilitating digital twin simulation have achieved a 25% increase in operational planning accuracy.

What are the Key Data Covered in this Generative AI In Metaverse Market Research and Growth Report?

  • What is the expected growth of the Generative AI In Metaverse Market between 2025 and 2029?

    • USD 882.7 million, at a CAGR of 11.7%

  • What segmentation does the market report cover?

    • The report is segmented by Platform (VR, AR, Social media platforms, Others), Application (Procedural content generation, AI-driven character and object creation, Others), End-user (Entertainment and gaming, Education and training, Others) and Geography (North America, APAC, Europe, South America, Middle East and Africa)

  • Which regions are analyzed in the report?

    • North America, APAC, Europe, South America and Middle East and Africa

  • What are the key growth drivers and market challenges?

    • Demand for scalable content creation, High computational cost and technical complexity

  • Who are the major players in the Generative AI In Metaverse Market?

    • Adobe Inc., Amazon Web Services Inc., Anthropic, Arm Ltd., Cohere Inc., Databricks Inc., Google LLC, Hugging Face, IBM Corp., Jasper AI Inc., Microsoft Corp., Midjourney, NVIDIA Corp., OpenAI, Oracle Corp., Salesforce Inc., SAP SE, ServiceNow Inc., Stability AI and Synthesia Ltd.

Market Research Insights

  • Market dynamics are shaped by the strategic adoption of generative AI to achieve operational efficiencies and enhance user engagement. The democratization of creator tools is leading to an explosion of user-generated content, with platforms reporting a 50% increase in active builders after integrating AI-powered features. This shift supports a more user-centric ai design philosophy.
  • Concurrently, the application of hyper-personalization in vr and real-time experience personalization is yielding higher retention, with some immersive experiences showing a 30% uplift in user session length. In enterprise collaboration tools, AI-driven automation is streamlining workflows, contributing to a measurable reduction in project turnaround times. This convergence of creativity and efficiency is creating new business models and competitive differentiators.

We can help! Our analysts can customize this generative ai in metaverse market research report to meet your requirements.

Get in touch

1. Executive Summary

1.1 Market overview

Executive Summary - Chart on Market Overview
Executive Summary - Data Table on Market Overview
Executive Summary - Chart on Global Market Characteristics
Executive Summary - Chart on Market by Geography
Executive Summary - Chart on Market Segmentation by Platform
Executive Summary - Chart on Market Segmentation by Application
Executive Summary - Chart on Market Segmentation by End-user
Executive Summary - Chart on Incremental Growth
Executive Summary - Data Table on Incremental Growth
Executive Summary - Chart on Company Market Positioning

2. Technavio Analysis

2.1 Analysis of price sensitivity, lifecycle, customer purchase basket, adoption rates, and purchase criteria

2.2 Criticality of inputs and Factors of differentiation

Chart on Overview on criticality of inputs and factors of differentiation

2.3 Factors of disruption

Chart on Overview on factors of disruption

2.4 Impact of drivers and challenges

Chart on Impact of drivers and challenges in 2024 and 2029

3. Market Landscape

3.1 Market ecosystem

Chart on Parent Market
Data Table on - Parent Market

3.2 Market characteristics

Chart on Market characteristics analysis

3.3 Value chain analysis

Chart on Value chain analysis

4. Market Sizing

4.1 Market definition

Data Table on Offerings of companies included in the market definition

4.2 Market segment analysis

Market segments

4.3 Market size 2024

4.4 Market outlook: Forecast for 2024-2029

Chart on Global - Market size and forecast 2024-2029 ($ million)
Data Table on Global - Market size and forecast 2024-2029 ($ million)
Chart on Global Market: Year-over-year growth 2024-2029 (%)
Data Table on Global Market: Year-over-year growth 2024-2029 (%)

5. Five Forces Analysis

5.1 Five forces summary

Five forces analysis - Comparison between 2024 and 2029

5.2 Bargaining power of buyers

Bargaining power of buyers - Impact of key factors 2024 and 2029

5.3 Bargaining power of suppliers

Bargaining power of suppliers - Impact of key factors in 2024 and 2029

5.4 Threat of new entrants

Threat of new entrants - Impact of key factors in 2024 and 2029

5.5 Threat of substitutes

Threat of substitutes - Impact of key factors in 2024 and 2029

5.6 Threat of rivalry

Threat of rivalry - Impact of key factors in 2024 and 2029

5.7 Market condition

Chart on Market condition - Five forces 2024 and 2029

6. Market Segmentation by Platform

6.1 Market segments

Chart on Platform - Market share 2024-2029 (%)
Data Table on Platform - Market share 2024-2029 (%)

6.2 Comparison by Platform

Chart on Comparison by Platform
Data Table on Comparison by Platform

6.3 VR - Market size and forecast 2024-2029

Chart on VR - Market size and forecast 2024-2029 ($ million)
Data Table on VR - Market size and forecast 2024-2029 ($ million)
Chart on VR - Year-over-year growth 2024-2029 (%)
Data Table on VR - Year-over-year growth 2024-2029 (%)

6.4 AR - Market size and forecast 2024-2029

Chart on AR - Market size and forecast 2024-2029 ($ million)
Data Table on AR - Market size and forecast 2024-2029 ($ million)
Chart on AR - Year-over-year growth 2024-2029 (%)
Data Table on AR - Year-over-year growth 2024-2029 (%)

6.5 Social media platforms - Market size and forecast 2024-2029

Chart on Social media platforms - Market size and forecast 2024-2029 ($ million)
Data Table on Social media platforms - Market size and forecast 2024-2029 ($ million)
Chart on Social media platforms - Year-over-year growth 2024-2029 (%)
Data Table on Social media platforms - Year-over-year growth 2024-2029 (%)

6.6 Others - Market size and forecast 2024-2029

Chart on Others - Market size and forecast 2024-2029 ($ million)
Data Table on Others - Market size and forecast 2024-2029 ($ million)
Chart on Others - Year-over-year growth 2024-2029 (%)
Data Table on Others - Year-over-year growth 2024-2029 (%)

6.7 Market opportunity by Platform

Market opportunity by Platform ($ million)
Data Table on Market opportunity by Platform ($ million)

7. Market Segmentation by Application

7.1 Market segments

Chart on Application - Market share 2024-2029 (%)
Data Table on Application - Market share 2024-2029 (%)

7.2 Comparison by Application

Chart on Comparison by Application
Data Table on Comparison by Application

7.3 Procedural content generation - Market size and forecast 2024-2029

Chart on Procedural content generation - Market size and forecast 2024-2029 ($ million)
Data Table on Procedural content generation - Market size and forecast 2024-2029 ($ million)
Chart on Procedural content generation - Year-over-year growth 2024-2029 (%)
Data Table on Procedural content generation - Year-over-year growth 2024-2029 (%)

7.4 AI-driven character and object creation - Market size and forecast 2024-2029

Chart on AI-driven character and object creation - Market size and forecast 2024-2029 ($ million)
Data Table on AI-driven character and object creation - Market size and forecast 2024-2029 ($ million)
Chart on AI-driven character and object creation - Year-over-year growth 2024-2029 (%)
Data Table on AI-driven character and object creation - Year-over-year growth 2024-2029 (%)

7.5 Others - Market size and forecast 2024-2029

Chart on Others - Market size and forecast 2024-2029 ($ million)
Data Table on Others - Market size and forecast 2024-2029 ($ million)
Chart on Others - Year-over-year growth 2024-2029 (%)
Data Table on Others - Year-over-year growth 2024-2029 (%)

7.6 Market opportunity by Application

Market opportunity by Application ($ million)
Data Table on Market opportunity by Application ($ million)

8. Market Segmentation by End-user

8.1 Market segments

Chart on End-user - Market share 2024-2029 (%)
Data Table on End-user - Market share 2024-2029 (%)

8.2 Comparison by End-user

Chart on Comparison by End-user
Data Table on Comparison by End-user

8.3 Entertainment and gaming - Market size and forecast 2024-2029

Chart on Entertainment and gaming - Market size and forecast 2024-2029 ($ million)
Data Table on Entertainment and gaming - Market size and forecast 2024-2029 ($ million)
Chart on Entertainment and gaming - Year-over-year growth 2024-2029 (%)
Data Table on Entertainment and gaming - Year-over-year growth 2024-2029 (%)

8.4 Education and training - Market size and forecast 2024-2029

Chart on Education and training - Market size and forecast 2024-2029 ($ million)
Data Table on Education and training - Market size and forecast 2024-2029 ($ million)
Chart on Education and training - Year-over-year growth 2024-2029 (%)
Data Table on Education and training - Year-over-year growth 2024-2029 (%)

8.5 Others - Market size and forecast 2024-2029

Chart on Others - Market size and forecast 2024-2029 ($ million)
Data Table on Others - Market size and forecast 2024-2029 ($ million)
Chart on Others - Year-over-year growth 2024-2029 (%)
Data Table on Others - Year-over-year growth 2024-2029 (%)

8.6 Market opportunity by End-user

Market opportunity by End-user ($ million)
Data Table on Market opportunity by End-user ($ million)

9. Customer Landscape

9.1 Customer landscape overview

Analysis of price sensitivity, lifecycle, customer purchase basket, adoption rates, and purchase criteria

10. Geographic Landscape

10.1 Geographic segmentation

Chart on Market share by geography 2024-2029 (%)
Data Table on Market share by geography 2024-2029 (%)

10.2 Geographic comparison

Chart on Geographic comparison
Data Table on Geographic comparison

10.3 North America - Market size and forecast 2024-2029

Chart on North America - Market size and forecast 2024-2029 ($ million)
Data Table on North America - Market size and forecast 2024-2029 ($ million)
Chart on North America - Year-over-year growth 2024-2029 (%)
Data Table on North America - Year-over-year growth 2024-2029 (%)
Chart on Regional Comparison - North America
Data Table on Regional Comparison - North America

10.3.1 US - Market size and forecast 2024-2029

Chart on US - Market size and forecast 2024-2029 ($ million)
Data Table on US - Market size and forecast 2024-2029 ($ million)
Chart on US - Year-over-year growth 2024-2029 (%)
Data Table on US - Year-over-year growth 2024-2029 (%)

10.3.2 Canada - Market size and forecast 2024-2029

Chart on Canada - Market size and forecast 2024-2029 ($ million)
Data Table on Canada - Market size and forecast 2024-2029 ($ million)
Chart on Canada - Year-over-year growth 2024-2029 (%)
Data Table on Canada - Year-over-year growth 2024-2029 (%)

10.3.3 Mexico - Market size and forecast 2024-2029

Chart on Mexico - Market size and forecast 2024-2029 ($ million)
Data Table on Mexico - Market size and forecast 2024-2029 ($ million)
Chart on Mexico - Year-over-year growth 2024-2029 (%)
Data Table on Mexico - Year-over-year growth 2024-2029 (%)

10.4 APAC - Market size and forecast 2024-2029

Chart on APAC - Market size and forecast 2024-2029 ($ million)
Data Table on APAC - Market size and forecast 2024-2029 ($ million)
Chart on APAC - Year-over-year growth 2024-2029 (%)
Data Table on APAC - Year-over-year growth 2024-2029 (%)
Chart on Regional Comparison - APAC
Data Table on Regional Comparison - APAC

10.4.1 China - Market size and forecast 2024-2029

Chart on China - Market size and forecast 2024-2029 ($ million)
Data Table on China - Market size and forecast 2024-2029 ($ million)
Chart on China - Year-over-year growth 2024-2029 (%)
Data Table on China - Year-over-year growth 2024-2029 (%)

10.4.2 Japan - Market size and forecast 2024-2029

Chart on Japan - Market size and forecast 2024-2029 ($ million)
Data Table on Japan - Market size and forecast 2024-2029 ($ million)
Chart on Japan - Year-over-year growth 2024-2029 (%)
Data Table on Japan - Year-over-year growth 2024-2029 (%)

10.4.3 India - Market size and forecast 2024-2029

Chart on India - Market size and forecast 2024-2029 ($ million)
Data Table on India - Market size and forecast 2024-2029 ($ million)
Chart on India - Year-over-year growth 2024-2029 (%)
Data Table on India - Year-over-year growth 2024-2029 (%)

10.4.4 South Korea - Market size and forecast 2024-2029

Chart on South Korea - Market size and forecast 2024-2029 ($ million)
Data Table on South Korea - Market size and forecast 2024-2029 ($ million)
Chart on South Korea - Year-over-year growth 2024-2029 (%)
Data Table on South Korea - Year-over-year growth 2024-2029 (%)

10.4.5 Australia - Market size and forecast 2024-2029

Chart on Australia - Market size and forecast 2024-2029 ($ million)
Data Table on Australia - Market size and forecast 2024-2029 ($ million)
Chart on Australia - Year-over-year growth 2024-2029 (%)
Data Table on Australia - Year-over-year growth 2024-2029 (%)

10.4.6 Indonesia - Market size and forecast 2024-2029

Chart on Indonesia - Market size and forecast 2024-2029 ($ million)
Data Table on Indonesia - Market size and forecast 2024-2029 ($ million)
Chart on Indonesia - Year-over-year growth 2024-2029 (%)
Data Table on Indonesia - Year-over-year growth 2024-2029 (%)

10.5 Europe - Market size and forecast 2024-2029

Chart on Europe - Market size and forecast 2024-2029 ($ million)
Data Table on Europe - Market size and forecast 2024-2029 ($ million)
Chart on Europe - Year-over-year growth 2024-2029 (%)
Data Table on Europe - Year-over-year growth 2024-2029 (%)
Chart on Regional Comparison - Europe
Data Table on Regional Comparison - Europe

10.5.1 Germany - Market size and forecast 2024-2029

Chart on Germany - Market size and forecast 2024-2029 ($ million)
Data Table on Germany - Market size and forecast 2024-2029 ($ million)
Chart on Germany - Year-over-year growth 2024-2029 (%)
Data Table on Germany - Year-over-year growth 2024-2029 (%)

10.5.2 UK - Market size and forecast 2024-2029

Chart on UK - Market size and forecast 2024-2029 ($ million)
Data Table on UK - Market size and forecast 2024-2029 ($ million)
Chart on UK - Year-over-year growth 2024-2029 (%)
Data Table on UK - Year-over-year growth 2024-2029 (%)

10.5.3 France - Market size and forecast 2024-2029

Chart on France - Market size and forecast 2024-2029 ($ million)
Data Table on France - Market size and forecast 2024-2029 ($ million)
Chart on France - Year-over-year growth 2024-2029 (%)
Data Table on France - Year-over-year growth 2024-2029 (%)

10.5.4 Italy - Market size and forecast 2024-2029

Chart on Italy - Market size and forecast 2024-2029 ($ million)
Data Table on Italy - Market size and forecast 2024-2029 ($ million)
Chart on Italy - Year-over-year growth 2024-2029 (%)
Data Table on Italy - Year-over-year growth 2024-2029 (%)

10.5.5 The Netherlands - Market size and forecast 2024-2029

Chart on The Netherlands - Market size and forecast 2024-2029 ($ million)
Data Table on The Netherlands - Market size and forecast 2024-2029 ($ million)
Chart on The Netherlands - Year-over-year growth 2024-2029 (%)
Data Table on The Netherlands - Year-over-year growth 2024-2029 (%)

10.5.6 Spain - Market size and forecast 2024-2029

Chart on Spain - Market size and forecast 2024-2029 ($ million)
Data Table on Spain - Market size and forecast 2024-2029 ($ million)
Chart on Spain - Year-over-year growth 2024-2029 (%)
Data Table on Spain - Year-over-year growth 2024-2029 (%)

10.6 South America - Market size and forecast 2024-2029

Chart on South America - Market size and forecast 2024-2029 ($ million)
Data Table on South America - Market size and forecast 2024-2029 ($ million)
Chart on South America - Year-over-year growth 2024-2029 (%)
Data Table on South America - Year-over-year growth 2024-2029 (%)
Chart on Regional Comparison - South America
Data Table on Regional Comparison - South America

10.6.1 Brazil - Market size and forecast 2024-2029

Chart on Brazil - Market size and forecast 2024-2029 ($ million)
Data Table on Brazil - Market size and forecast 2024-2029 ($ million)
Chart on Brazil - Year-over-year growth 2024-2029 (%)
Data Table on Brazil - Year-over-year growth 2024-2029 (%)

10.6.2 Argentina - Market size and forecast 2024-2029

Chart on Argentina - Market size and forecast 2024-2029 ($ million)
Data Table on Argentina - Market size and forecast 2024-2029 ($ million)
Chart on Argentina - Year-over-year growth 2024-2029 (%)
Data Table on Argentina - Year-over-year growth 2024-2029 (%)

10.6.3 Colombia - Market size and forecast 2024-2029

Chart on Colombia - Market size and forecast 2024-2029 ($ million)
Data Table on Colombia - Market size and forecast 2024-2029 ($ million)
Chart on Colombia - Year-over-year growth 2024-2029 (%)
Data Table on Colombia - Year-over-year growth 2024-2029 (%)

10.7 Middle East and Africa - Market size and forecast 2024-2029

Chart on Middle East and Africa - Market size and forecast 2024-2029 ($ million)
Data Table on Middle East and Africa - Market size and forecast 2024-2029 ($ million)
Chart on Middle East and Africa - Year-over-year growth 2024-2029 (%)
Data Table on Middle East and Africa - Year-over-year growth 2024-2029 (%)
Chart on Regional Comparison - Middle East and Africa
Data Table on Regional Comparison - Middle East and Africa

10.7.1 South Africa - Market size and forecast 2024-2029

Chart on South Africa - Market size and forecast 2024-2029 ($ million)
Data Table on South Africa - Market size and forecast 2024-2029 ($ million)
Chart on South Africa - Year-over-year growth 2024-2029 (%)
Data Table on South Africa - Year-over-year growth 2024-2029 (%)

10.7.2 Saudi Arabia - Market size and forecast 2024-2029

Chart on Saudi Arabia - Market size and forecast 2024-2029 ($ million)
Data Table on Saudi Arabia - Market size and forecast 2024-2029 ($ million)
Chart on Saudi Arabia - Year-over-year growth 2024-2029 (%)
Data Table on Saudi Arabia - Year-over-year growth 2024-2029 (%)

10.7.3 UAE - Market size and forecast 2024-2029

Chart on UAE - Market size and forecast 2024-2029 ($ million)
Data Table on UAE - Market size and forecast 2024-2029 ($ million)
Chart on UAE - Year-over-year growth 2024-2029 (%)
Data Table on UAE - Year-over-year growth 2024-2029 (%)

10.7.4 Israel - Market size and forecast 2024-2029

Chart on Israel - Market size and forecast 2024-2029 ($ million)
Data Table on Israel - Market size and forecast 2024-2029 ($ million)
Chart on Israel - Year-over-year growth 2024-2029 (%)
Data Table on Israel - Year-over-year growth 2024-2029 (%)

10.7.5 Turkey - Market size and forecast 2024-2029

Chart on Turkey - Market size and forecast 2024-2029 ($ million)
Data Table on Turkey - Market size and forecast 2024-2029 ($ million)
Chart on Turkey - Year-over-year growth 2024-2029 (%)
Data Table on Turkey - Year-over-year growth 2024-2029 (%)

10.8 Market opportunity by geography

Market opportunity by geography ($ million)
Data Tables on Market opportunity by geography ($ million)

11. Drivers, Challenges, and Opportunity

11.1 Market drivers

Demand for scalable content creation
Democratization of creator tools
Quest for enhanced user immersion and personalization

11.2 Market challenges

High computational cost and technical complexity
Intellectual property and copyright ambiguity
Ethical concerns and content moderation

11.3 Impact of drivers and challenges

Impact of drivers and challenges in 2024 and 2029

11.4 Market opportunities

Rise of multimodal AI for richer interactions
Integration of AI into professional 3D workflows
Emergence of autonomous AI agents

12. Competitive Landscape

12.1 Overview

12.2

Overview on criticality of inputs and factors of differentiation

12.3 Landscape disruption

Overview on factors of disruption

12.4 Industry risks

Impact of key risks on business

13. Competitive Analysis

13.1 Companies profiled

Companies covered

13.2 Company ranking index

13.3 Market positioning of companies

Matrix on companies position and classification

13.4 Adobe Inc.

Adobe Inc. - Overview
Adobe Inc. - Business segments
Adobe Inc. - Key news
Adobe Inc. - Key offerings
Adobe Inc. - Segment focus
SWOT

13.5 Amazon Web Services Inc.

Amazon Web Services Inc. - Overview
Amazon Web Services Inc. - Product / Service
Amazon Web Services Inc. - Key news
Amazon Web Services Inc. - Key offerings
SWOT

13.6 Anthropic

Anthropic - Overview
Anthropic - Product / Service
Anthropic - Key offerings
SWOT

13.7 Arm Ltd.

Arm Ltd. - Overview
Arm Ltd. - Product / Service
Arm Ltd. - Key offerings
SWOT

13.8 Cohere Inc.

Cohere Inc. - Overview
Cohere Inc. - Product / Service
Cohere Inc. - Key offerings
SWOT

13.9 Databricks Inc.

Databricks Inc. - Overview
Databricks Inc. - Product / Service
Databricks Inc. - Key offerings
SWOT

13.10 Google LLC

Google LLC - Overview
Google LLC - Product / Service
Google LLC - Key offerings
SWOT

13.11 IBM Corp.

IBM Corp. - Overview
IBM Corp. - Business segments
IBM Corp. - Key news
IBM Corp. - Key offerings
IBM Corp. - Segment focus
SWOT

13.12 Microsoft Corp.

Microsoft Corp. - Overview
Microsoft Corp. - Business segments
Microsoft Corp. - Key news
Microsoft Corp. - Key offerings
Microsoft Corp. - Segment focus
SWOT

13.13 NVIDIA Corp.

NVIDIA Corp. - Overview
NVIDIA Corp. - Business segments
NVIDIA Corp. - Key news
NVIDIA Corp. - Key offerings
NVIDIA Corp. - Segment focus
SWOT

13.14 OpenAI

OpenAI - Overview
OpenAI - Product / Service
OpenAI - Key offerings
SWOT

13.15 Oracle Corp.

Oracle Corp. - Overview
Oracle Corp. - Business segments
Oracle Corp. - Key news
Oracle Corp. - Key offerings
Oracle Corp. - Segment focus
SWOT

13.16 Salesforce Inc.

Salesforce Inc. - Overview
Salesforce Inc. - Product / Service
Salesforce Inc. - Key news
Salesforce Inc. - Key offerings
SWOT

13.17 SAP SE

SAP SE - Overview
SAP SE - Business segments
SAP SE - Key news
SAP SE - Key offerings
SAP SE - Segment focus
SWOT

13.18 ServiceNow Inc.

ServiceNow Inc. - Overview
ServiceNow Inc. - Product / Service
ServiceNow Inc. - Key news
ServiceNow Inc. - Key offerings
SWOT

14. Appendix

14.1 Scope of the report

Market definition
Objectives
Notes and caveats

14.2 Inclusions and exclusions checklist

Inclusions checklist
Exclusions checklist

14.3 Currency conversion rates for US$

14.4 Research methodology

14.5 Data procurement

Information sources

14.6 Data validation

14.7 Validation techniques employed for market sizing

14.8 Data synthesis

14.9 360 degree market analysis

14.10 List of abbreviations

Research Methodology

Technavio presents a detailed picture of the market by way of study, synthesis, and summation of data from multiple sources. The analysts have presented the various facets of the market with a particular focus on identifying the key industry influencers. The data thus presented is comprehensive, reliable, and the result of extensive research, both primary and secondary.

INFORMATION SOURCES

Primary sources

  • Manufacturers and suppliers
  • Channel partners
  • Industry experts
  • Strategic decision makers

Secondary sources

  • Industry journals and periodicals
  • Government data
  • Financial reports of key industry players
  • Historical data
  • Press releases

DATA ANALYSIS

Data Synthesis

  • Collation of data
  • Estimation of key figures
  • Analysis of derived insights

Data Validation

  • Triangulation with data models
  • Reference against proprietary databases
  • Corroboration with industry experts

REPORT WRITING

Qualitative

  • Market drivers
  • Market challenges
  • Market trends
  • Five forces analysis

Quantitative

  • Market size and forecast
  • Market segmentation
  • Geographical insights
  • Competitive landscape

Interested in this report?

Get your sample now to see our research methodology and insights!

Download Now

Frequently Asked Questions

Generative AI In Metaverse market growth will increase by USD 882.7 million during 2025-2029.

The Generative AI In Metaverse market is expected to grow at a CAGR of 11.7% during 2025-2029.

Generative AI In Metaverse market is segmented by Platform (VR, AR, Social media platforms, Others) Application (Procedural content generation, AI-driven character and object creation, Others) End-user (Entertainment and gaming, Education and training, Others)

Adobe Inc., Amazon Web Services Inc., Anthropic, Arm Ltd., Cohere Inc., Databricks Inc., Google LLC, Hugging Face, IBM Corp., Jasper AI Inc., Microsoft Corp., Midjourney, NVIDIA Corp., OpenAI, Oracle Corp., Salesforce Inc., SAP SE, ServiceNow Inc., Stability AI, Synthesia Ltd. are a few of the key vendors in the Generative AI In Metaverse market.

North America will register the highest growth rate of 33.6% among the other regions. Therefore, the Generative AI In Metaverse market in North America is expected to garner significant business opportunities for the vendors during the forecast period.

US, Canada, Mexico, China, Japan, India, South Korea, Australia, Indonesia, Germany, UK, France, Italy, The Netherlands, Spain, Brazil, Argentina, Colombia, South Africa, Saudi Arabia, UAE, Israel, Turkey

  • Demand for scalable content creation is the driving factor this market.

The Generative AI In Metaverse market vendors should focus on grabbing business opportunities from the Platform segment as it accounted for the largest market share in the base year.