
Autonomous AI Market Size 2026-2030
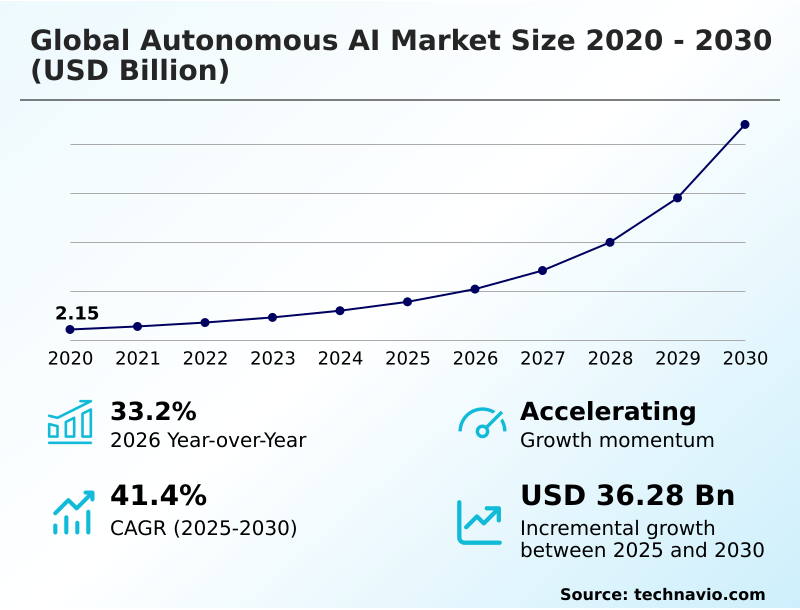
The Autonomous AI Market size was valued at USD 7.81 billion in 2025, growing at a CAGR of 41.4% during the forecast period 2026-2030.
Major Market Trends & Insights
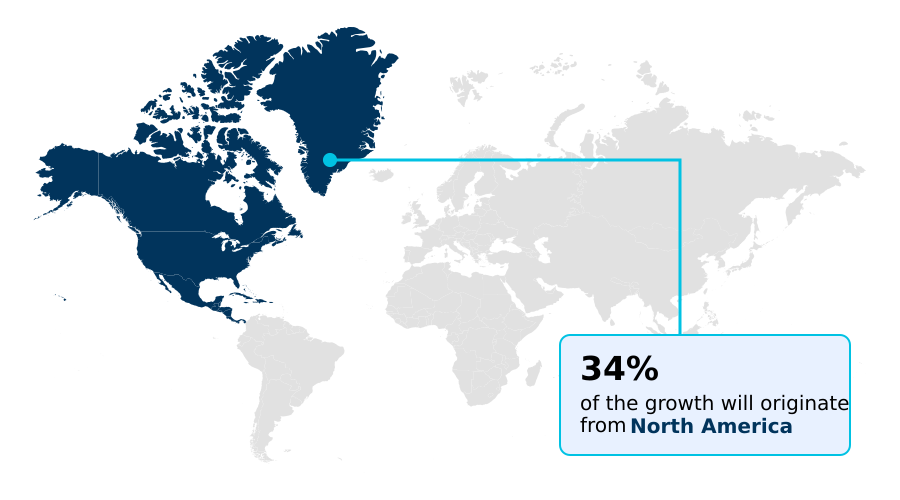
- North America dominated the market and accounted for a 34.5% growth during the forecast period.
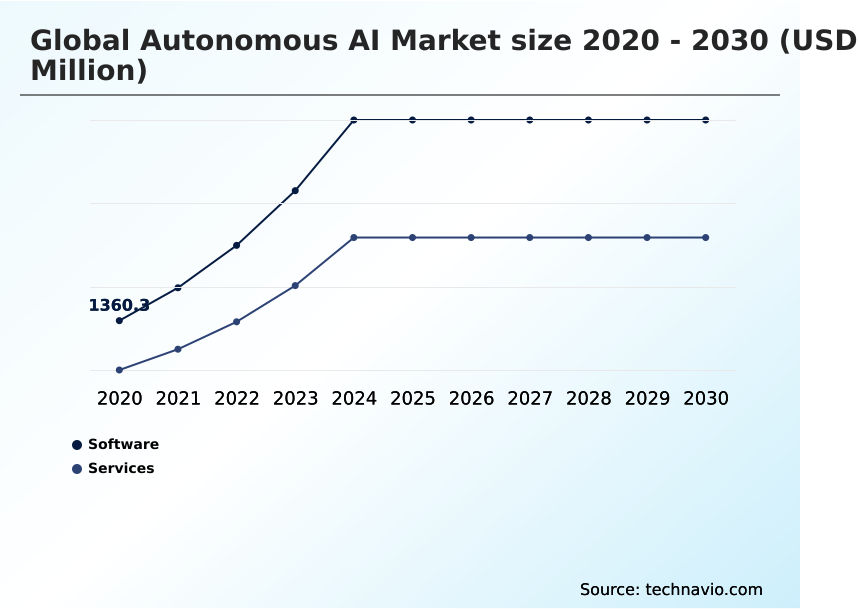
- By Component - Software segment was valued at USD 3.67 billion in 2024
- By Technology - Machine learning segment accounted for the largest market revenue share in 2024
Market Size & Forecast
- Historic Market Opportunities 2020-2024: USD 41.94 billion
- Market Future Opportunities 2025-2030: USD 36.28 billion
- CAGR from 2025 to 2030 : 41.4%
Market Summary
- The autonomous AI market is defined by a systemic shift from assisted intelligence to self-governing systems, with initial deployments showing a 30% improvement in operational decision speed. These systems utilize agentic workflows to independently execute complex, multi-step tasks, reducing human intervention by up to 40% in process-heavy industries.
- A primary driver is the need to manage data-driven complexity in sectors like finance, where autonomous agents can analyze market data and execute trades faster than human teams. For instance, a logistics firm can deploy an autonomous AI system to re-route its entire fleet in real-time based on weather and traffic data, optimizing fuel consumption without manual oversight.
- However, significant challenges, such as the high computational power required for real-time inference and the lack of standardized regulatory frameworks, constrain widespread adoption. The successful integration of these systems depends on resolving issues related to infrastructure and governance.
What will be the Size of the Autonomous AI Market during the forecast period?
Get Key Insights on Market Forecast (PDF) Request Free Sample
How is the Autonomous AI Market Segmented?
The autonomous ai industry research report provides comprehensive data (region-wise segment analysis), with forecasts and analysis for the period 2026-2030, as well as historical data from 2020-2024 for the following segments.
- Component
- Software
- Services
- Technology
- Machine learning
- Natural language processing
- Context awareness
- Computer vision
- End-user
- Manufacturing
- Retail and E-commerce
- Healthcare
- Automotive
- Others
- Geography
- North America
- US
- Canada
- Mexico
- APAC
- China
- Japan
- India
- Europe
- Germany
- UK
- France
- Middle East and Africa
- UAE
- Saudi Arabia
- Israel
- South America
- Brazil
- Argentina
- Colombia
- Rest of World (ROW)
- North America
How is the Autonomous AI Market Segmented by Component?
The software segment is estimated to witness significant growth during the forecast period.
The software segment, which accounts for over 60% of autonomous AI deployments, enables systems to self-correct and optimize in real-time.
This technology utilizes agentic workflow frameworks and reinforcement learning from AI feedback to solve multi-step problems with an 85% reduction in human oversight compared to traditional automation.
Organizations are transitioning to autonomous software with iterative reasoning to manage entire business processes, from resource planning to customer relationship management.
The integration of such software, including self-governing machines and agentic commerce platforms, allows for a drastic reduction in operational latency, enabling business processes to scale dynamically.
The modular nature of contemporary autonomous software allows companies to customize agentic behaviors to align with specific regulatory and ethical standards, leveraging private infrastructure hosting for enhanced security and control.
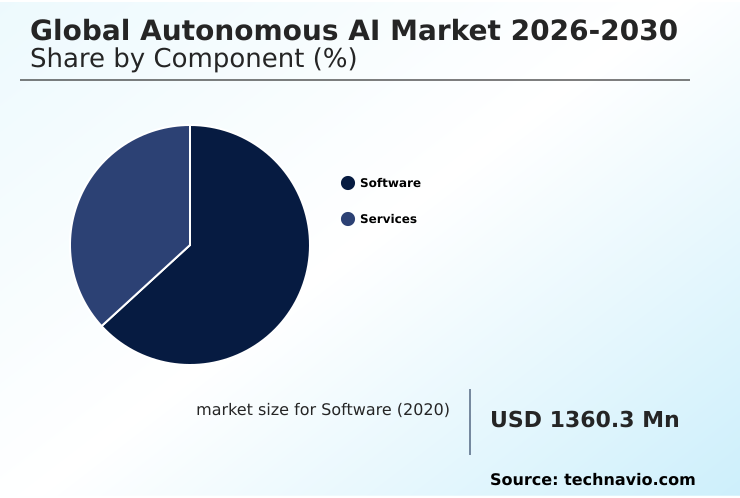
The Software segment was valued at USD 3.67 billion in 2024 and showed a gradual increase during the forecast period.
How demand for the Autonomous AI market is rising in the leading region?
North America is estimated to contribute 34.5% to the growth of the global market during the forecast period.Technavio’s analysts have elaborately explained the regional trends and drivers that shape the market during the forecast period.
See How Autonomous AI Market demand is rising in North America Request Free Sample
North America leads the global autonomous AI market, accounting for 34.5% of the incremental growth, which is nearly 5.5% more than APAC.
This dominance is driven by a dense ecosystem of hyperscale cloud providers and a robust venture capital environment that accelerates the adoption of physical AI integration and multi-agent systems.
The US alone contributes to over 80% of North America's market value.
In contrast, the APAC market, with its 29.03% share, is characterized by a mobile-first digital economy and rapid adoption of end-to-end neural networks in manufacturing and smart city projects.
European adoption is more measured, prioritizing ethical observability and human-on-the-loop governance frameworks, which can slow deployment compared to the innovation-first approach in North America.
This regional divergence in strategy and regulatory focus creates distinct market dynamics and investment opportunities, with different paths to leveraging generative intelligence and context-aware technology.
What are the key Drivers, Trends, and Challenges in the Autonomous AI Market?
Our researchers analyzed the data with 2025 as the base year, along with the key drivers, trends, and challenges. A holistic analysis of drivers will help companies refine their marketing strategies to gain a competitive advantage.
- Enterprises are increasingly exploring autonomous AI for enterprise automation to streamline complex operations, with successful implementations reducing manual process intervention by over 40%. A key area of focus is autonomous AI in supply chain management, where intelligent agents can optimize logistics and inventory in real time, offering a significant competitive advantage over systems relying on static analysis.
- The benefits of autonomous AI in finance are particularly compelling, as algorithmic trading and fraud detection systems powered by self-learning models can identify opportunities and threats with speeds unattainable by human analysts. This has led to a surge in demand, with financial sector adoption growing 15% faster than in other service industries.
- The rise of open-source autonomous AI frameworks is democratizing access to these powerful tools, allowing smaller firms to customize and deploy sophisticated agentic systems without heavy reliance on proprietary platforms. However, navigating the ethical considerations in autonomous AI, such as data privacy and decision-making accountability, remains a critical challenge that organizations must address to maintain trust and ensure long-term viability.
- As these systems become more integrated, establishing robust governance and transparency is paramount for responsible innovation.
What are the key market drivers leading to the rise in the adoption of Autonomous AI Industry?
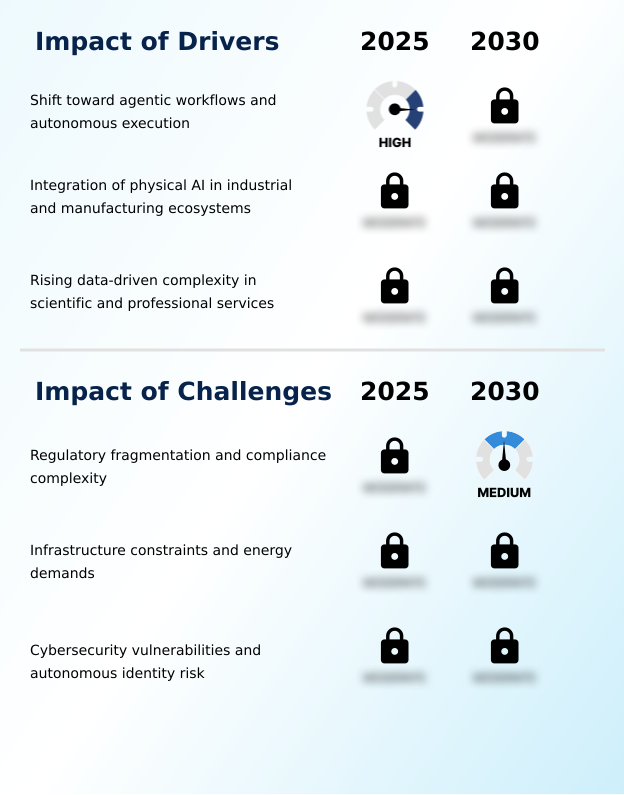
- The primary market driver is the fundamental shift toward agentic workflows and autonomous execution, enabling systems to perform tasks with minimal human intervention.
- The primary driver for the autonomous AI market is the architectural transition to agentic workflows, which allow systems to reason and execute multi-step tasks with an 80% reduction in human intervention compared to traditional automation.
- This shift, driven by the need to eliminate operational latency, is particularly evident in software development, where self-healing code can autonomously identify and remediate vulnerabilities, improving security patch times by over 50%.
- The adoption of agentic recursion and iterative reasoning enables these systems to manage entire business processes independently.
- As enterprises witness these productivity gains, investment is moving toward deploying digital workforces, supported by reasoning-based AI models and unsupervised frameworks, that operate with consistent precision.
What are the market trends shaping the Autonomous AI Industry?
- A significant market trend is the architectural shift toward decentralized and small-scale autonomous inference. This move prioritizes on-device processing to enhance latency, privacy, and operational efficiency.
- A defining trend in the autonomous AI market is the move toward decentralized, small-scale inference, where processing shifts from centralized clouds to edge devices, reducing latency by over 75% for real-time applications. This adoption of small language models and specialized neural processing units allows for autonomous tasks to be executed locally, enhancing data privacy and operational resilience.
- This architectural shift, which is 30% more energy-efficient than cloud-based alternatives for certain workloads, enables the deployment of self-governing intelligence in secure, offline environments like remote industrial sites.
- The trend is driven by the need for greater efficiency and control, challenging the dominance of massive, power-intensive data centers and fostering a more ubiquitous and integrated form of AI by leveraging private infrastructure hosting and auditable decision-making.
What challenges does the Autonomous AI Industry face during its growth?
- Regulatory fragmentation and compliance complexity present a key challenge, creating significant barriers to the widespread deployment of autonomous systems across jurisdictions.
- Regulatory fragmentation remains a primary challenge for the autonomous AI market, with divergent legal frameworks across jurisdictions increasing compliance costs by up to 40% for global deployments.
- This lack of international standardization for high-density compute and AI accelerators limits the scalability of autonomous solutions, as a system compliant in one region may be non-compliant in another, reducing market access by an estimated 25%. For instance, stringent conformity assessments in Europe contrast with more innovation-focused policies elsewhere, creating significant operational hurdles.
- This discrepancy forces organizations to adopt modular architectures for localized processing, slowing the velocity of global integration and leaving unresolved issues around legal liability for autonomous agent actions.
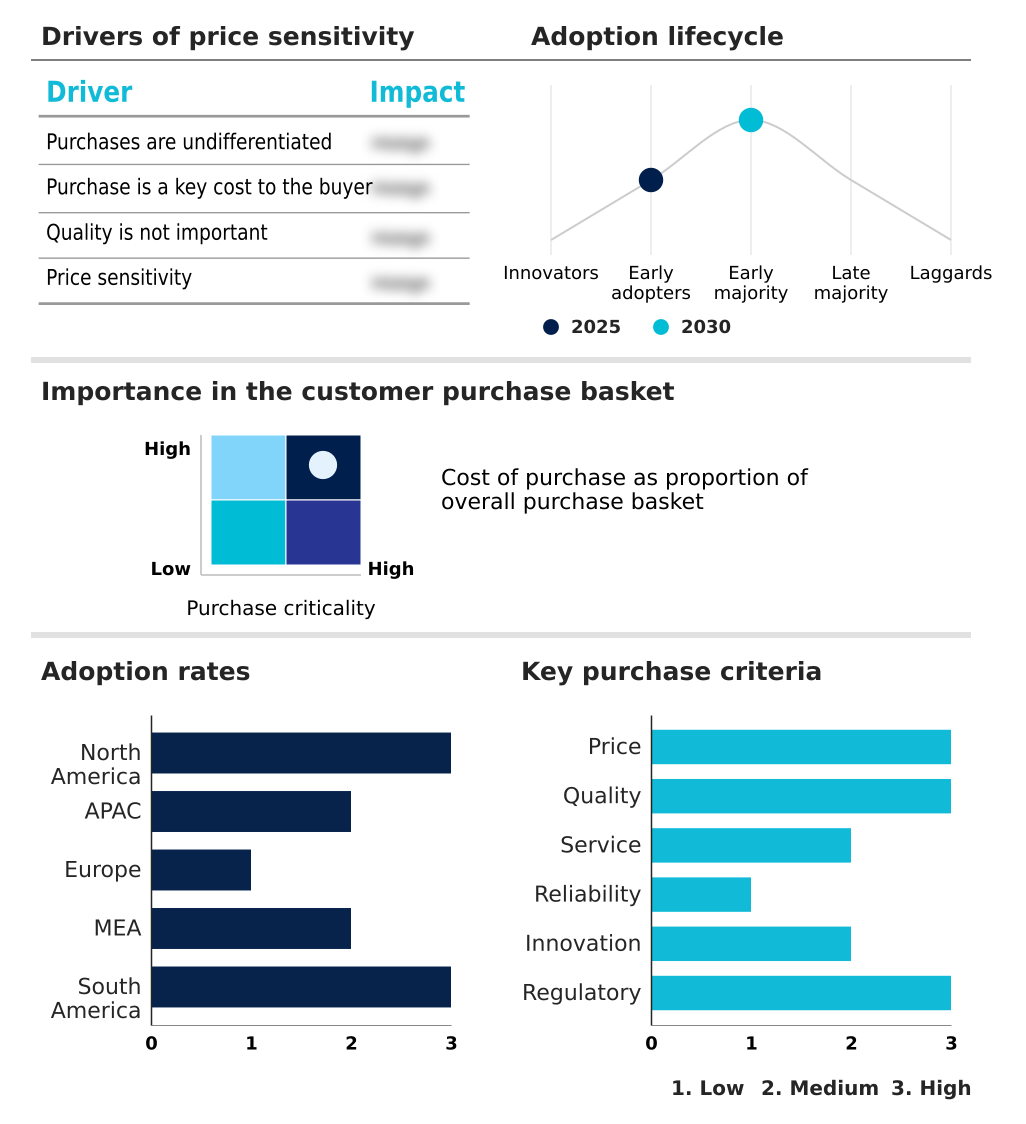
Exclusive Technavio Analysis on Customer Landscape
The autonomous ai market forecasting report includes the adoption lifecycle of the market, covering from the innovator’s stage to the laggard’s stage. It focuses on adoption rates in different regions based on penetration. Furthermore, the autonomous ai market report also includes key purchase criteria and drivers of price sensitivity to help companies evaluate and develop their market growth analysis strategies.
Customer Landscape of Autonomous AI Industry
Competitive Landscape
Companies are implementing various strategies, such as strategic alliances, autonomous ai market forecast, partnerships, mergers and acquisitions, geographical expansion, and product/service launches, to enhance their presence in the industry.
Adobe Inc. - Autonomous AI solutions focus on automating content creation, personalizing user experiences, and optimizing complex workflow tasks for enhanced efficiency across enterprise operations.
The industry research and growth report includes detailed analyses of the competitive landscape of the market and information about key companies, including:
- Adobe Inc.
- Amazon Web Services Inc.
- Anthropic
- Apple Inc.
- C3.ai Inc.
- Covariant
- Databricks Inc.
- Figure AI
- Google LLC
- IBM Corp.
- Inflection AI Inc.
- Intel Corp.
- Microsoft Corp.
- NVIDIA Corp.
- OpenAI
- Oracle Corp.
- Palantir Technologies Inc.
- Salesforce Inc.
- Sanctuary Cognitive Systems Corp
- SAP SE
Qualitative and quantitative analysis of companies has been conducted to help clients understand the wider business environment as well as the strengths and weaknesses of key industry players. Data is qualitatively analyzed to categorize companies as pure play, category-focused, industry-focused, and diversified; it is quantitatively analyzed to categorize companies as dominant, leading, strong, tentative, and weak.
Market Intelligence Radar: High-Impact Developments & Growth Signals
- In the Application Software industry, the increasing adoption of cloud-based subscription models has lowered the barrier to entry for advanced autonomous AI, enabling smaller enterprises to access sophisticated agentic commerce and workflow automation tools without significant upfront capital expenditure.
- The growing emphasis on data analytics within the Application Software sector is driving demand for autonomous AI systems capable of unsupervised frameworks for insight generation, impacting the market by creating a need for more intelligent, self-directed data interpretation tools.
- Rising data security concerns in the Application Software industry are fueling the development of autonomous AI with enhanced, identity-centric security protocols and on-device, localized processing to mitigate risks associated with cloud-based systems and ensure data sovereignty.
- The proliferation of open-source application software is challenging proprietary models, directly influencing the autonomous AI market by accelerating the adoption of open-weight autonomous frameworks and fostering community-driven innovation and customization.
Dive into Technavio’s robust research methodology, blending expert interviews, extensive data synthesis, and validated models for unparalleled Autonomous AI Market insights. See full methodology.
| Market Scope | |
|---|---|
| Page number | 309 |
| Base year | 2025 |
| Historic period | 2020-2024 |
| Forecast period | 2026-2030 |
| Growth momentum & CAGR | Accelerate at a CAGR of 41.4% |
| Market growth 2026-2030 | USD 36279.1 million |
| Market structure | Fragmented |
| YoY growth 2025-2026(%) | 33.2% |
| Key countries | US, Canada, Mexico, China, Japan, India, South Korea, Australia, Singapore, Germany, UK, France, Italy, Spain, Russia, UAE, Saudi Arabia, Israel, South Africa, Turkey, Brazil, Argentina and Colombia |
| Competitive landscape | Leading Companies, Market Positioning of Companies, Competitive Strategies, and Industry Risks |
Research Analyst Overview
- The autonomous AI market ecosystem operates through a complex value chain where technology suppliers of AI chips and cloud infrastructure enable solution providers to build sophisticated agentic systems. These systems are then adopted by end-users across manufacturing, healthcare, and finance, where they have been shown to improve diagnostic accuracy by up to 15% and reduce fraudulent transactions by 20%.
- Regulatory bodies and industry consortia play a crucial role in establishing governance frameworks, such as conformity assessments and human oversight mechanisms, to ensure ethical deployment. Distribution channels include direct sales, platform-as-a-service models, and specialized consulting firms that facilitate integration into enterprise workflows. This interconnected network of stakeholders fosters innovation while navigating the technical and ethical complexities inherent in self-governing technology.
What are the Key Data Covered in this Autonomous AI Market Research and Growth Report?
-
What is the expected growth of the Autonomous AI Market between 2026 and 2030?
-
The Autonomous AI Market is expected to grow by USD 36.28 billion during 2026-2030, registering a CAGR of 41.4%. Year-over-year growth in 2026 is estimated at 33.2%%. This acceleration is shaped by shift toward agentic workflows and autonomous execution, which is intensifying demand across multiple end-use verticals covered in the report.
-
-
What segmentation does the market report cover?
-
The report is segmented by Component (Software, and Services), Technology (Machine learning, Natural language processing, Context awareness, and Computer vision), End-user (Manufacturing, Retail and E-commerce, Healthcare, Automotive, and Others) and Geography (North America, APAC, Europe, Middle East and Africa, South America). Among these, the Software segment is estimated to witness significant growth during the forecast period, driven by rising adoption across key application areas. Each segment includes detailed qualitative and quantitative analysis, along with historical data from 2020-2024 and forecasts through 2030 with year-over-year growth rates.
-
-
Which regions are analyzed in the report?
-
The report covers North America, APAC, Europe, Middle East and Africa and South America. North America is estimated to contribute 34.5% to market growth during the forecast period. Country-level analysis includes US, Canada, Mexico, China, Japan, India, South Korea, Australia, Singapore, Germany, UK, France, Italy, Spain, Russia, UAE, Saudi Arabia, Israel, South Africa, Turkey, Brazil, Argentina and Colombia, with dedicated market size tables and year-over-year growth for each.
-
-
What are the key growth drivers and market challenges?
-
The primary driver is shift toward agentic workflows and autonomous execution, which is accelerating investment and industry demand. The main challenge is regulatory fragmentation and compliance complexity, creating operational barriers for key market participants. The report quantifies the impact of each driver and challenge across 2026 and 2030 with comparative analysis.
-
-
Who are the major players in the Autonomous AI Market?
-
Key vendors include Adobe Inc., Amazon Web Services Inc., Anthropic, Apple Inc., C3.ai Inc., Covariant, Databricks Inc., Figure AI, Google LLC, IBM Corp., Inflection AI Inc., Intel Corp., Microsoft Corp., NVIDIA Corp., OpenAI, Oracle Corp., Palantir Technologies Inc., Salesforce Inc., Sanctuary Cognitive Systems Corp and SAP SE. The report provides qualitative and quantitative analysis categorizing companies as dominant, leading, strong, tentative, and weak based on their market positioning. Company profiles include business segment analysis, SWOT assessment, key offerings, and recent strategic developments.
-
Market Research Insights
- The competitive landscape for autonomous AI is consolidating, with the top five technology providers capturing over 60% of the infrastructure-level market share through integrated hardware and software ecosystems. This concentration is driven by the high capital requirements for developing foundational models and specialized AI accelerators.
- Key vendors like NVIDIA and Google are shaping the market by releasing comprehensive blueprints and platforms, such as the NVIDIA Omniverse, that support autonomous simulation and robotics. These actions directly address enterprise demand for tools to build and deploy self-managing software agents that can automate complex processes, with recent updates enabling a 25% faster deployment cycle for enterprise applications.
- This progress allows for the creation of agentic systems for tasks from procurement to supply chain adjustments. The primary challenge remains the operational complexity and cost of deploying these advanced systems at scale.
We can help! Our analysts can customize this autonomous ai market research report to meet your requirements.
 RIA -
RIA - 
