Thermoplastic Composites Market Size 2025-2029
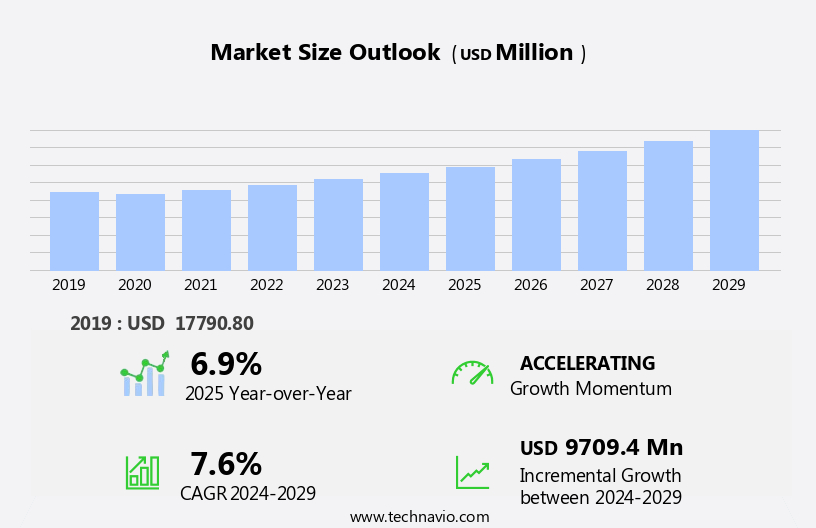
The thermoplastic composites market size is forecast to increase by USD 9.71 billion at a CAGR of 7.6% between 2024 and 2029.
- The market is experiencing significant growth, driven by advancements in materials science and manufacturing technologies. These innovations enable the production of high-performance thermoplastic composites with improved properties, such as increased strength, durability, and processability. This development is crucial for industries relying on lightweight, strong, and cost-effective materials, including automotive, aerospace, and construction. However, the market faces challenges related to fiber-reinforced thermoplastic composites. The market encompasses the production and application of composite materials, which are engineered from thermoplastics, reinforcing fibers, additives, and resins. The primary concern is the high cost of production compared to their thermoset counterparts. This obstacle arises from the complex processing requirements and the need for specialized equipment.
- Additionally, the limited availability of suitable reinforcement fibers and the challenge of achieving consistent fiber dispersion in the matrix further complicate the manufacturing process. Additionally, the thermoplastic composites industry is witnessing notable developments, including the expansion of applications in various end-use industries, such as automotive, construction, and wind energy. Companies seeking to capitalize on the market opportunities must focus on addressing these challenges through technological advancements and cost optimization strategies. By doing so, they can effectively compete in the growing thermoplastic composites industry.
What will be the Size of the Thermoplastic Composites Market during the forecast period?
Explore in-depth regional segment analysis with market size data - historical 2019-2023 and forecasts 2025-2029 - in the full report.
Request Free Sample
In the market, end-of-life management and environmental impact are increasingly important considerations. Licensing agreements and intellectual property rights play a significant role in shaping the competitive landscape. Design for manufacturing and material characterization are crucial for improving efficiency and reducing costs. Performance testing and certification standards ensure product quality and customer satisfaction. Risk management and cost analysis are key factors in the adoption of smart composites, which offer enhanced electrical properties and process optimization. Strategic partnerships and joint ventures facilitate the development of hybrid composites, combining the benefits of different materials. Industry regulations and supply chain disruptions pose challenges to market growth.
However, self-healing composites and recycled composites offer opportunities for waste reduction and cost reduction. Bio-based composites and energy consumption are also areas of focus for companies seeking a competitive advantage. Product lifecycle management and supply chain management are essential for minimizing energy consumption and ensuring quality assurance. Mechanical and thermal properties are critical performance indicators for various applications. Polymer matrix composites continue to dominate the market, but the trend towards innovation and differentiation is driving the adoption of new materials and technologies. Additionally, the development of new resins, such as polyamide resin, is driving innovation In the market.
How is this Thermoplastic Composites Industry segmented?
The thermoplastic composites industry research report provides comprehensive data (region-wise segment analysis), with forecasts and estimates in "USD million" for the period 2025-2029, as well as historical data from 2019-2023 for the following segments.
- Product
- Short fiber thermoplastics
- Long fiber thermoplastics
- Continuous fiber thermoplastics
- Glass mat thermoplastics
- End-user
- Aerospace and defense
- Consumer goods and electronics
- Automotive
- Construction
- Others
- Resin Type
- Polyamide
- Polypropylene
- Polyetheretherketone
- Hybrid
- Others
- Fiber Type
- Glass fiber
- Carbon fiber
- Mineral fiber
- Others
- Geography
- North America
- US
- Canada
- Mexico
- Europe
- France
- Germany
- APAC
- China
- India
- Japan
- South Korea
- South America
- Brazil
- Rest of World (ROW)
- North America
By Product Insights
The short fiber thermoplastics segment is estimated to witness significant growth during the forecast period. Short fiber thermoplastics (SFTs), comprised of thermoplastic composite fibers less than 1 mm long, are manufactured by incorporating fibers into molten thermoplastics. Glass fibers and carbon fibers, known for their superior properties including high tensile strength, excellent toughness, and extended shelf life, are the most frequently used fibers in SFT composites. These materials find extensive applications in various industries, such as electrical and electronic, automotive, oilfield, chemical process, and defense, due to their ease of processing, effective techniques, and recyclability. In the consumer goods sector, SFTs contribute significantly to the production of lightweight, durable, and cost-effective products. For instance, they are used in the manufacturing of sports equipment, such as helmets, bicycle frames, and protective gear, owing to their excellent dimensional stability and specific stiffness.
SFTs also exhibit superior compressive strength and fatigue resistance, making them suitable for use in automotive applications, including engine components and interior panels. The wind energy sector has witnessed a rise in the adoption of SFTs due to their lightweight properties and high specific strength. This results in increased energy output and lower production costs. Marine applications are another significant end-use sector for SFTs. The use of SFTs in marine structures, such as boats and ships, offers advantages in terms of improved dimensional stability, enhanced creep resistance, and superior chemical resistance.
The use of SFTs in aerospace applications offers advantages in terms of reduced weight, improved fuel efficiency, and enhanced structural performance. In summary, the short fiber thermoplastics market is driven by the growing demand for lightweight, high-performance materials in various industries, including consumer goods, wind energy, marine, automotive, and aerospace. The use of advanced manufacturing techniques and design optimization strategies, coupled with the development of new resin systems and fiber reinforcements, is expected to further fuel the growth of the market in the coming years.
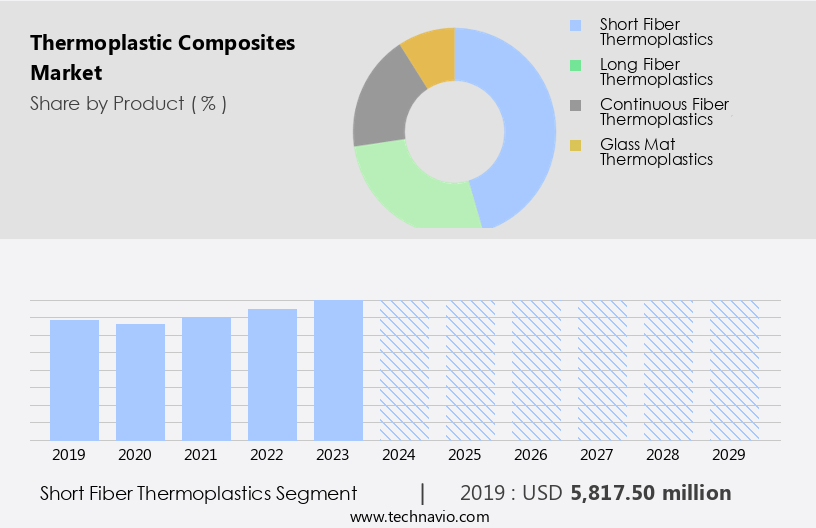
The Short fiber thermoplastics segment was valued at USD 5.82 billion in 2019 and showed a gradual increase during the forecast period.
Moreover, SFTs are increasingly being used in the production of sandwich structures, which combine lightweight core materials, such as foam cores and honeycomb cores, with fiber reinforced polymers for enhanced structural performance. Design optimization and advanced manufacturing techniques, such as autoclave curing, filament winding, and resin transfer molding, have played a crucial role in the growth of the SFT market. These techniques enable the production of high-performance composites with superior mechanical properties, such as high tensile strength, specific stiffness, and fiber volume fraction. Additionally, surface treatments, such as plasma treatment and corona discharge, improve the bonding between the fiber and the matrix material, enhancing the overall performance of the composite.
In the automotive industry, SFTs are increasingly being used for structural applications, such as in the production of lightweight components for electric and hybrid vehicles. Epoxy resins and vinyl ester resins are commonly used as matrix materials due to their excellent chemical resistance and high modulus of elasticity. Continuous fiber reinforcements, such as unidirectional fiber and multiaxial fiber, are used to enhance the mechanical properties of the composites, while discontinuous fiber reinforcements, such as chopped fiber and mat reinforcements, are used for cost-effective applications. The aerospace industry is another major end-user sector for SFTs, where they are used in the production of fiber reinforced polymers (FRPs) for various applications, including wing structures, fuel tanks, and interior components. Wind turbine blades, in particular, benefit from the use of SFTs, as they enable the production of larger, more efficient blades while reducing the overall weight of the turbine.
Regional Analysis
APAC is estimated to contribute 47% to the growth of the global market during the forecast period. Technavio's analysts have elaborately explained the regional trends and drivers that shape the market during the forecast period.
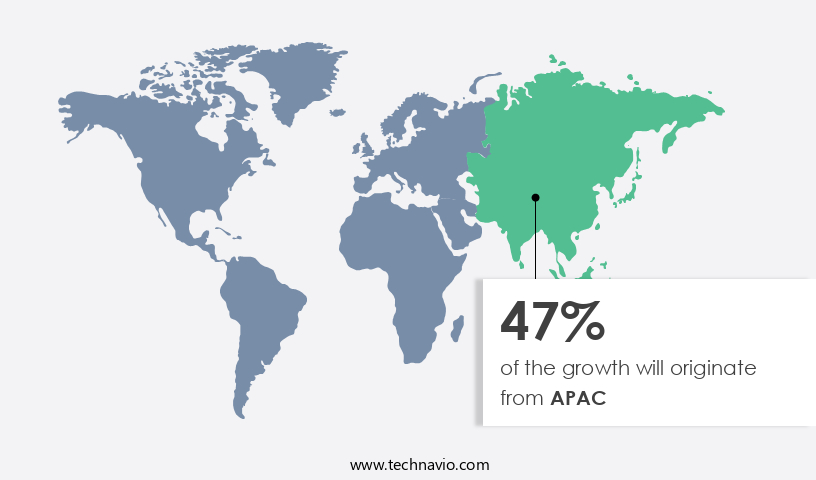
The market experiences significant growth, particularly in the APAC region, where industrial expansion, burgeoning automotive and aerospace sectors, and substantial infrastructure development fuel its demand. Key countries, including China, South Korea, India, and Japan, are primary consumers of thermoplastic composites. The automotive industry's increasing adoption of these materials for manufacturing parts and components is a significant market driver in APAC. The region's rising automotive production further strengthens the demand for thermoplastic composites, with applications ranging from compressive strength and dimensional stability in automotive components to wind energy applications, design optimization, and surface treatments. In marine applications, glass fiber reinforcement fabrics, epoxy resin, and carbon fiber are commonly used for their high tensile strength, specific stiffness, and fiber volume fraction.
Thermoplastic composites' versatility extends to automotive applications, where they offer advantages such as fatigue resistance, creep resistance, and chemical resistance. Additionally, the market incorporates various manufacturing techniques, including autoclave curing, resin transfer molding, vacuum infusion, compression molding, and injection molding, to cater to diverse industry requirements. Other applications include protective coatings, sandwich structures, and 3D printing for repair techniques, with non-destructive testing ensuring quality control. Thermoplastic composites' thermal conductivity, impact resistance, and modulus of elasticity make them suitable for aerospace applications and fiber reinforced polymers. Overall, the market's evolution is characterized by continuous innovation, with ongoing research and development in areas such as ultrasonic testing, shear strength, unidirectional fiber, finite element analysis, and polyurethane resin.
Market Dynamics
Our researchers analyzed the data with 2024 as the base year, along with the key drivers, trends, and challenges. A holistic analysis of drivers will help companies refine their marketing strategies to gain a competitive advantage.
What are the Thermoplastic Composites market drivers leading to the rise in the adoption of Industry?
- Advancements in materials science and manufacturing technologies are the primary catalysts driving market growth, as innovations in these fields continue to enhance productivity, efficiency, and product quality. Thermoplastic composites, a material class that combines the processing advantages of thermoplastics with the reinforcing properties of fibers, is experiencing significant growth due to advancements in materials science and manufacturing technologies. The development of innovative thermoplastic resins and reinforcing fibers, such as those with enhanced specific stiffness, fiber volume fraction, modulus of elasticity, and creep resistance, enables the creation of thermoplastic composites tailored to specific application needs. These materials exhibit superior performance compared to traditional ones. Manufacturing advancements, including automated layup, compression molding, and injection molding, have revolutionized production processes. These techniques provide precise control over fiber orientation, resin distribution, and part geometry, leading to high-quality products with reduced cycle times.
- Additionally, thermoplastic composites offer chemical resistance, making them ideal for various industries, including sporting goods. Water absorption and manufacturing defects are challenges in the market. However, continuous research and development efforts are addressing these issues through the use of sandwich structures and prepreg materials. These solutions improve water absorption resistance and reduce manufacturing defects, ensuring consistent product quality. In summary, the market is driven by advancements in materials science and manufacturing technologies, leading to superior performance and cost-effective production. Challenges such as water absorption and manufacturing defects are being addressed through innovative solutions, ensuring the continued growth and success of this market.
What are the Thermoplastic Composites market trends shaping the Industry?
- The thermoplastic composites industry is experiencing significant developments, positioning it as an emerging market trend. Advancements in this sector are noteworthy, reflecting a professional and knowledgeable response. The market is experiencing notable advancements in material innovation, manufacturing processes, and applications due to the rising demand for lightweight, high-performance materials in various industries, including automotive, aerospace, construction, and consumer goods. One significant development in this field is the collaboration between LANXESS and Advent International, which commenced operations on April 1, 2023. This joint venture combines LANXESS's former High-Performance Materials business with the DSM Engineering Materials segment, focusing on engineering materials. Another notable partnership is between Solvay and GKN Aerospace, which aims to explore innovative materials and manufacturing techniques for aircraft structures. These collaborations underscore the industry's commitment to research and development, with a focus on enhancing the properties of thermoplastic composites, such as shear strength, impact resistance, and ultrasonic testing capabilities.
- Additionally, there is a growing emphasis on out-of-autoclave curing methods, including compression molding and vacuum infusion, which offer cost savings and improved production efficiency. Fiber reinforced polymers, such as unidirectional fiber, biaxial fiber, aramid fiber, and discontinuous fiber, are increasingly being utilized due to their superior mechanical properties. Finite element analysis is also being employed to optimize the design and manufacturing processes of thermoplastic composites, ensuring improved product performance and reliability. Polyurethane resin is another material gaining popularity due to its excellent processing characteristics and mechanical properties. Non-destructive testing methods, such as ultrasonic testing and X-ray radiography, are also being employed to ensure the quality and integrity of thermoplastic composite structures.
How does Thermoplastic Composites market face challenges during its growth?
-
Concerns related to fiber-reinforced thermoplastic composites pose significant challenges restraining the growth of the industry. These concerns encompass various aspects, including material properties, processing techniques, and cost-effectiveness, which require continuous research and innovation to overcome. The market faces several challenges that impede the widespread adoption and growth of this industry. High production costs, resulting from the use of expensive raw materials, manufacturing processes, and specialized equipment, limit market penetration, particularly in price-sensitive sectors. Thermoplastic composites are available in various forms, such as carbon fiber, glass fiber, and aramid fiber reinforced types.
- Precise processing conditions are essential for thermoplastic composites to ensure uniform fiber distribution and proper consolidation, which presents technical challenges during molding or forming processes. These hurdles call for innovative solutions to reduce production costs and simplify material selection and processing techniques, ultimately driving market growth. Furthermore, the diverse range of thermoplastic resins and reinforcing fibers available necessitates extensive testing and evaluation for material selection, adding complexity to the process.
Exclusive Customer Landscape
The thermoplastic composites market forecasting report includes the adoption lifecycle of the market, covering from the innovator's stage to the laggard's stage. It focuses on adoption rates in different regions based on penetration. Furthermore, the thermoplastic composites market report also includes key purchase criteria and drivers of price sensitivity to help companies evaluate and develop their market growth analysis strategies.

Customer Landscape
Key Companies & Market Insights
Companies are implementing various strategies, such as strategic alliances, thermoplastic composites market forecast, partnerships, mergers and acquisitions, geographical expansion, and product/service launches, to enhance their presence in the industry.
Arkema - The company specializes in the production and application of advanced thermoplastic composites, including Elium, a revolutionary liquid thermoplastic resin.
The industry research and growth report includes detailed analyses of the competitive landscape of the market and information about key companies, including:
- Arkema
- Avient Corp.
- BASF SE
- Celanese Corp.
- Covestro AG
- Daicel Corp.
- DSM-Firmenich AG
- DuPont de Nemours Inc.
- Greene Tweed and Co.
- Hanwha Corp.
- Kingfa SCI. and TECH. Co. Ltd.
- Lanxess AG
- Mitsubishi Chemical Group Corp.
- RTP Co.
- Saudi Basic Industries Corp.
- SGL Carbon SE
- Solvay SA
- Suprem SA
- Toray Industries Inc.
- Victrex Plc
Qualitative and quantitative analysis of companies has been conducted to help clients understand the wider business environment as well as the strengths and weaknesses of key industry players. Data is qualitatively analyzed to categorize companies as pure play, category-focused, industry-focused, and diversified; it is quantitatively analyzed to categorize companies as dominant, leading, strong, tentative, and weak.
Recent Development and News in Thermoplastic Composites Market
- In January 2024, BASF Corporation announced the launch of Ultramid TG3, a new line of thermoplastic composites, featuring improved mechanical properties and enhanced processability (BASF press release). This innovation expanded BASF's portfolio, addressing growing demand for lightweight and high-performance materials.
- In March 2024, SABIC and Teijin Limited entered into a strategic partnership to develop and commercialize thermoplastic composites based on SABIC's ULTEM resin and Teijin's Tenax carbon fiber (SABIC press release). This collaboration aimed to cater to the automotive and aerospace industries, targeting weight reduction and increased durability.
- In May 2024, LANXESS AG completed the acquisition of DSM's Engineering Materials business, including its thermoplastic composites portfolio (LANXESS press release). The acquisition strengthened LANXESS's market position and expanded its product offerings, providing a broader range of solutions to customers.
- In February 2025, Covestro AG and Airbus revealed the successful demonstration of a thermoplastic composite wing box for the A350 XWB aircraft (Covestro press release). This technological advancement showcased the potential of thermoplastic composites in large-scale aerospace applications, reducing weight and improving fuel efficiency.
Research Analyst Overview
Thermoplastic composites continue to gain momentum in various industries due to their unique properties, including high compressive strength, dimensional stability, and excellent flexural strength. These materials have found applications in wind energy, where their lightweight and durable nature contribute to increased efficiency and reduced production costs. In the aerospace sector, design optimization and autoclave curing techniques enable the production of lightweight, high-performance components with superior specific stiffness and creep resistance. Surface treatments and protective coatings enhance the chemical resistance and thermal conductivity of thermoplastic composites, making them suitable for marine applications. Glass fiber reinforcement fabrics and vinyl ester resin are commonly used in filament winding and multiaxial fiber processes to create complex structures with high tensile strength and specific strength.
Carbon fiber and epoxy resin are popular choices for automotive applications due to their high impact resistance and fatigue resistance. Core materials, such as foam cores and honeycomb cores, improve the overall structural analysis of these composites. Continuous fiber and discontinuous fiber composites are utilized in various industries, including sporting goods, where they offer enhanced properties like specific stiffness and creep resistance. Additive manufacturing techniques, such as 3D printing, are increasingly being adopted for the production of complex geometries and repair techniques. Quality control measures, including ultrasonic testing and non-destructive testing, ensure the production of defect-free components. Fiber reinforced polymers are used extensively in infrastructure applications, where their high strength-to-weight ratio and excellent resistance to environmental factors are essential.
The market is characterized by continuous evolution and innovation, with ongoing research and development efforts focused on improving manufacturing processes, such as resin transfer molding and vacuum infusion, and exploring new applications in various sectors. The Thermoplastic Composites Market is growing rapidly, fueled by innovation and heightened demand for lightweight, durable materials. Manufacturers are leveraging life cycle assessment tools to evaluate environmental impacts and improve sustainability across the product lifecycle. Addressing customer needs is at the forefront, with industries seeking materials that offer design flexibility and faster processing times. Continuous efficiency improvements in manufacturing and assembly are helping reduce production costs while enhancing throughput.
Superior physical properties such as high strength-to-weight ratio, resistance to corrosion, and recyclability are making thermoplastic composites ideal for aerospace, automotive, and consumer electronics applications. The Thermoplastic Composites Market is advancing due to the growing demand for high-performance, lightweight materials across industries. A key component, polyester resin, is widely used for its durability, chemical resistance, and cost efficiency, making it ideal for automotive and construction applications. Understanding material behavior through metrics like Poisson's ratio is critical for engineers to optimize designs for strength and flexibility under mechanical stress. Additionally, X-ray inspection technologies are gaining traction in quality control, enabling non-destructive testing to detect internal flaws and ensure structural integrity.
Dive into Technavio's robust research methodology, blending expert interviews, extensive data synthesis, and validated models for unparalleled Thermoplastic Composites Market insights. See full methodology.
|
Market Scope |
|
|
Report Coverage |
Details |
|
Page number |
267 |
|
Base year |
2024 |
|
Historic period |
2019-2023 |
|
Forecast period |
2025-2029 |
|
Growth momentum & CAGR |
Accelerate at a CAGR of 7.6% |
|
Market growth 2025-2029 |
USD 9.71 billion |
|
Market structure |
Fragmented |
|
YoY growth 2024-2025(%) |
6.9 |
|
Key countries |
China, US, Japan, Germany, India, Canada, Brazil, France, South Korea, and Mexico |
|
Competitive landscape |
Leading Companies, Market Positioning of Companies, Competitive Strategies, and Industry Risks |
What are the Key Data Covered in this Thermoplastic Composites Market Research and Growth Report?
- CAGR of the Thermoplastic Composites industry during the forecast period
- Detailed information on factors that will drive the growth and forecasting between 2025 and 2029
- Precise estimation of the size of the market and its contribution of the industry in focus to the parent market
- Accurate predictions about upcoming growth and trends and changes in consumer behaviour
- Growth of the market across APAC, North America, Europe, South America, and Middle East and Africa
- Thorough analysis of the market's competitive landscape and detailed information about companies
- Comprehensive analysis of factors that will challenge the thermoplastic composites market growth of industry companies
We can help! Our analysts can customize this thermoplastic composites market research report to meet your requirements.
 RIA -
RIA - 
