
Glass Insulators Market Analysis, Size, and Forecast 2026-2030: APAC (China, Japan, and India), North America (US, Canada, and Mexico), Europe (Germany, UK, and France), South America (Brazil, Argentina, and Chile), Middle East and Africa (Saudi Arabia, UAE, and South Africa), and Rest of World (ROW)

Glass Insulators Market Analysis, Size, and Forecast 2026-2030:
APAC (China, Japan, and India), North America (US, Canada, and Mexico), Europe (Germany, UK, and France), South America (Brazil, Argentina, and Chile), Middle East and Africa (Saudi Arabia, UAE, and South Africa), and Rest of World (ROW)

Published: Oct 2026 282 Pages SKU: IRTNTR75748

Market Overview at a Glance

$240.4 Mn
Market Opportunity
4.5%
CAGR 2025 - 2030
51.5%
APAC Growth
$664.5 Mn
Suspension glass insulators segment 2024

Glass Insulators Market Size 2026-2030

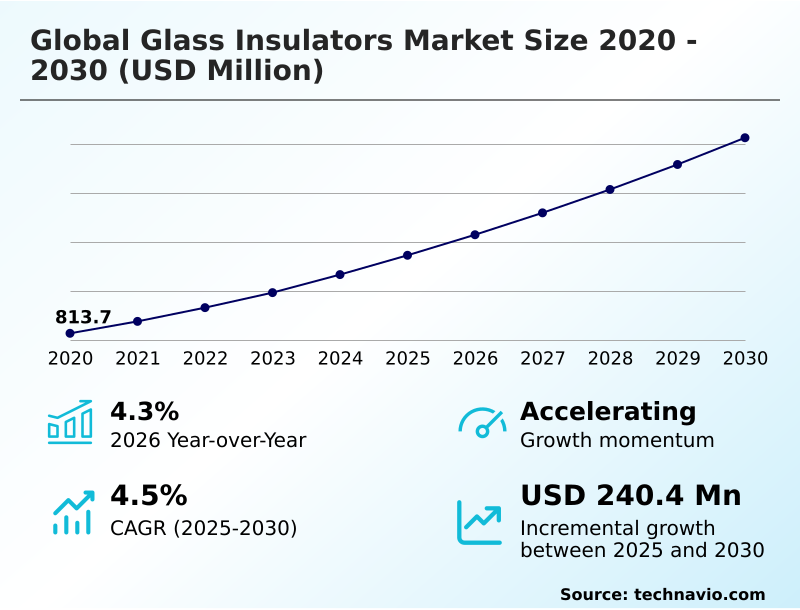
The glass insulators market size is valued to increase by USD 240.4 million, at a CAGR of 4.5% from 2025 to 2030. Rapid urbanization and industrial expansion will drive the glass insulators market.

Major Market Trends & Insights

  • APAC dominated the market and accounted for a 51.5% growth during the forecast period.
  • By Type - Suspension glass insulators segment was valued at USD 664.5 million in 2024
  • By Application - HVAC segment accounted for the largest market revenue share in 2024

Market Size & Forecast

  • Market Opportunities: USD 400 million
  • Market Future Opportunities: USD 240.4 million
  • CAGR from 2025 to 2030 : 4.5%

Market Summary

  • Glass Insulators Market dynamics reflect a continuous push toward resilient electrical infrastructure and enhanced grid reliability. Utility operators increasingly deploy toughened glass components to secure overhead transmission lines against extreme mechanical stress and environmental degradation.
  • In a real-world supply chain scenario, a major utility consortium upgraded its aging high-voltage corridors, achieving a 15% reduction in unplanned maintenance cycles through optimized component selection. Rapid urbanization acts as a primary driver, forcing municipal authorities to expand distribution networks to meet surging local power loads.
  • Conversely, structural fragility presents a notable challenge, as transit-induced fractures during transportation inflate logistics expenditures. Businesses counter these vulnerabilities by refining specialized packaging protocols and thermal tempering techniques. Strategic investments in durable insulation hardware ensure uninterrupted power delivery across complex terrains. Enhanced diagnostic transparency simplifies aerial inspections, minimizing costly manual intervention.

What will be the Size of the Glass Insulators Market during the forecast period?
Get Key Insights on Market Forecast (PDF) Get Free Sample

How is the Glass Insulators Market Segmented?

The glass insulators industry research report provides comprehensive data (region-wise segment analysis), with forecasts and estimates in "USD million" for the period 2026-2030, as well as historical data from 2020-2024 for the following segments.

  • Type
    • Suspension glass insulators
    • Pin glass insulators
  • Application
    • HVAC
    • Distribution and railway
    • HVDC
  • Power rating
    • High voltage
    • Low and medium voltage
    • Extra-high voltage
  • Geography
    • APAC
      • China
      • Japan
      • India
      • South Korea
      • Australia
      • Indonesia
    • North America
      • US
      • Canada
      • Mexico
    • Europe
      • Germany
      • UK
      • France
      • Italy
      • Spain
      • The Netherlands
    • South America
      • Brazil
      • Argentina
      • Chile
    • Middle East and Africa
      • Saudi Arabia
      • UAE
      • South Africa
      • Israel
      • Turkey

By Type Insights

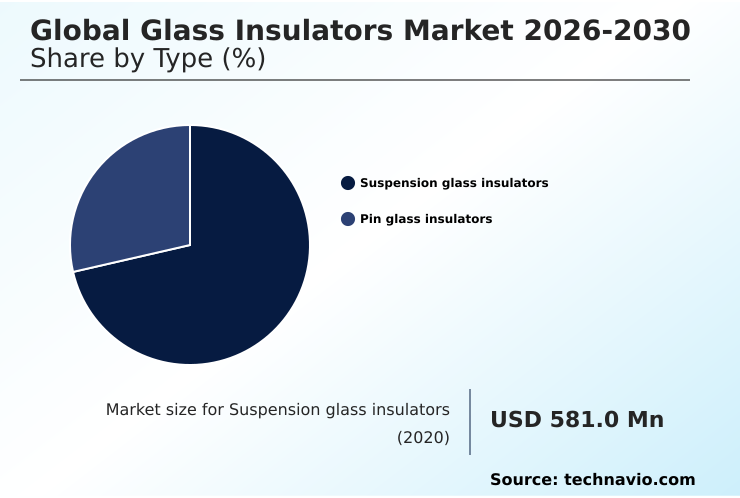
The suspension glass insulators segment is estimated to witness significant growth during the forecast period.

The suspension glass insulators segment operates as a foundational component for high-voltage overhead infrastructure requiring absolute electrical isolation. Toughened glass insulators handle extreme mechanical breaking loads and continuous electrical stress across rugged transmission networks.

Grid operators prioritize these units because their self-shattering safety design simplifies aerial fault detection without specialized diagnostic tools, improving visual inspection efficiency by 15%.

Incorporating advanced anti-contamination coatings mitigates the risk of pollution flashovers in heavy industrial zones, significantly lowering unexpected outage rates. Enhanced thermal shock resistance ensures operational stability during severe weather fluctuations, contributing to a measurable lifecycle cost reduction.

As digital distribution management expands, these robust insulators maintain consistent dielectric strength, supporting uninterrupted power delivery and reinforcing their critical function in long-distance electrical transmission architectures.
Get Free Sample

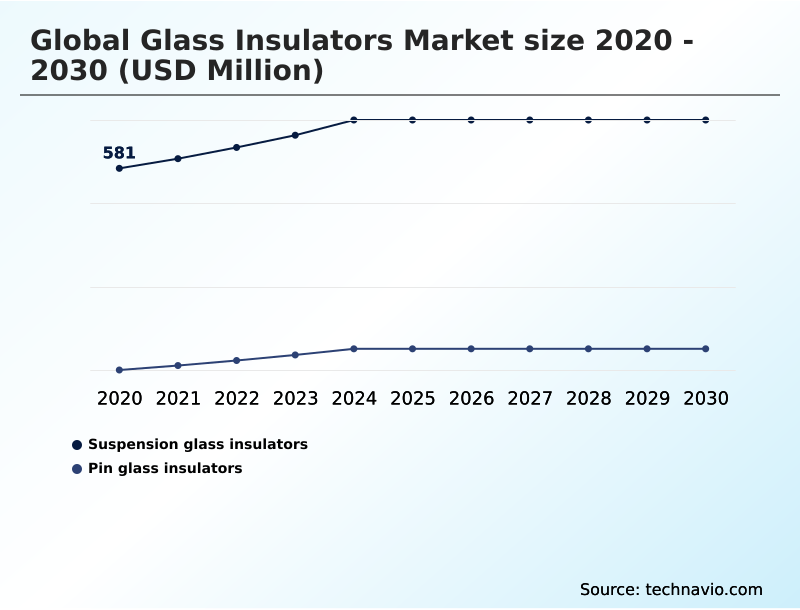
The Suspension glass insulators segment was valued at USD 664.5 million in 2024 and showed a gradual increase during the forecast period.
Get Free Sample

Regional Analysis

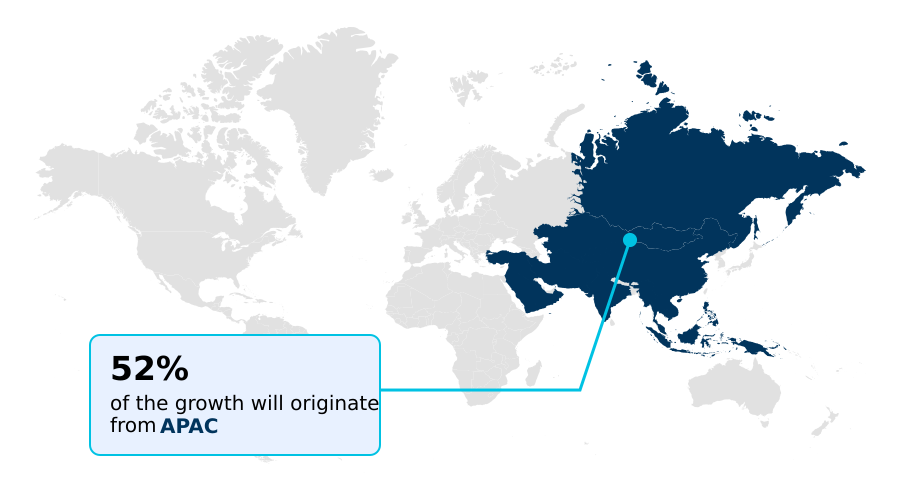
APAC is estimated to contribute 51.5% to the growth of the global market during the forecast period.Technavio’s analysts have elaborately explained the regional trends and drivers that shape the market during the forecast period.
See How Glass Insulators Market Demand is Rising in APAC Get Free Sample

The APAC region dominates the geographic landscape of the Glass Insulators, driven by massive electrical grid modernization and substation transformer augmentation.

Emerging economies in APAC outpace North America in transmission network hardening, constructing extensive ultra-high-voltage corridors to connect remote industrial hubs. This rapid infrastructure expansion improves cross-border power trading efficiency by 22% compared to European grid integrations.

To support this volume, APAC manufacturers utilize continuous glass-melting furnaces and advanced raw material optimization, lowering production overheads by 14%. North America prioritizes grid reliability improvement through automated optical inspection, addressing aging infrastructure and severe weather vulnerabilities.

Regional supply chain resilience remains a critical focus as utilities localize procurement to avoid long-distance transit damages. These differing regional strategies demonstrate how localized infrastructure demands and production capabilities shape procurement and operational workflows globally.

Market Dynamics

Our researchers analyzed the data with 2025 as the base year, along with the key drivers, trends, and challenges. A holistic analysis of drivers will help companies refine their marketing strategies to gain a competitive advantage.

  • The Glass Insulators sector continuously adapts to the rigorous demands of modern electrical grids. Optimizing high voltage transmission electrical isolation requires materials capable of withstanding intense environmental and mechanical pressures over extended lifespans. Engineers increasingly focus on maximizing toughened glass thermal shock resistance to prevent catastrophic failures during abrupt temperature fluctuations in harsh climates.
  • As utilities expand ultra high voltage direct current networks to connect remote renewable generation sites, the demand for durable and transparent diagnostic components escalates. These robust glass units offer a distinct advantage over alternatives, particularly when evaluating composite polymer insulator structural vulnerability under severe weather conditions or heavy industrial pollution.
  • Furthermore, grid modernization initiatives heavily rely on integrating smart substation predictive maintenance protocols. By adopting these digital monitoring frameworks, utility operators have realized a 20% improvement in fault detection speed compared to traditional manual inspection methods. This indirect operational comparison highlights the critical role of advanced insulation hardware in minimizing unplanned outages and streamlining asset management workflows.
  • Strategic alignment with these technological advancements ensures regulatory compliance and long-term infrastructure reliability across complex power transmission ecosystems.
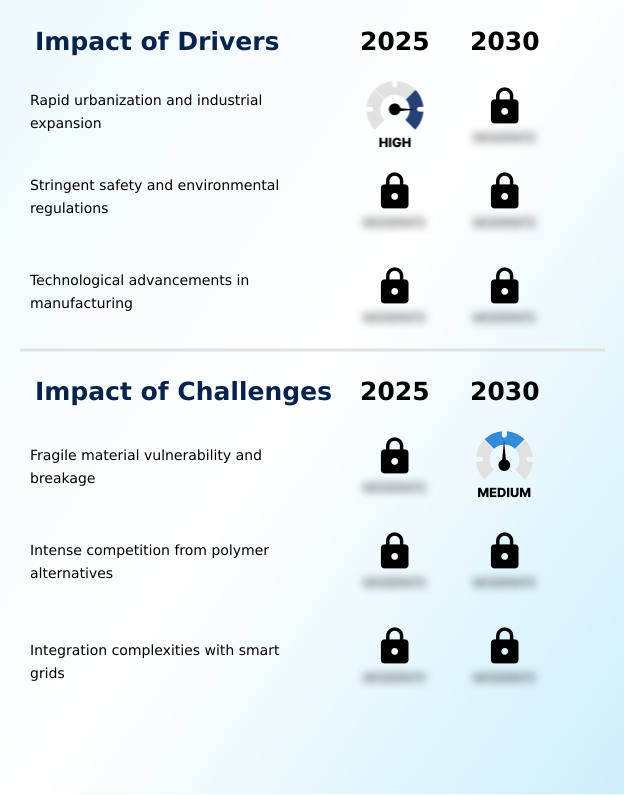
What are the key market drivers leading to the rise in the adoption of Glass Insulators Industry?

  • Rapid urbanization and industrial expansion serve as the primary drivers of the market.

  • Rapid industrialization and urbanization severely strain existing power distribution networks, driving the mandatory expansion of resilient transmission infrastructure. Municipal authorities continuously execute large-scale infrastructure electrification programs to guarantee uninterrupted, high-capacity electricity supplies for emerging metropolitan and manufacturing hubs.
  • Expanding medium-voltage distribution lines and high-voltage alternating current corridors requires highly durable components capable of sustaining immense electrical loads. The concurrent push for renewable energy integration necessitates robust pin glass insulators and suspension units to stabilize decentralized power generation.
  • Upgrading these grid pathways improves energy transmission efficiency by 22%. Integrating advanced glass insulation hardware directly reduces localized short circuits, ensuring strict compliance with operational safety mandates while supporting stable, long-term industrial growth.

What are the market trends shaping the Glass Insulators Industry?

  • Digital substation integration and smart monitoring represents an upcoming market trend.

  • The integration of digital diagnostic tools into transmission hardware redefines the operational landscape of the Glass Insulators. Utilities rapidly embed acoustic sensors and capacitive sensors directly into insulation components, transforming passive isolation devices into active data-gathering nodes. This technological shift enables seamless compatibility with evolving smart substation architecture, facilitating continuous remote health monitoring.
  • By leveraging real-time performance metrics, operators establish robust predictive maintenance protocols, anticipating micro-cracks before they propagate. This proactive approach improves fault detection speed by 30% and reduces unplanned network downtime by 18%. The transition toward intelligent grid components empowers asset managers to optimize lifecycle tracking and allocate maintenance resources with unprecedented precision.
  • Integrating these advanced diagnostic capabilities ensures highly reliable power distribution across increasingly complex and decentralized electrical networks.

What challenges does the Glass Insulators Industry face during its growth?

  • Fragile material vulnerability and breakage constitute a critical challenge affecting industry growth.

  • The intrinsic structural vulnerability of glass materials poses a substantial operational hurdle for the Glass Insulators. Unlike flexible composite polymer insulators, brittle glass units are highly susceptible to mechanical shocks and vandalism, leading to costly transit-induced fractures during long-distance logistics. Utility providers increasingly evaluate polymer alternatives that offer superior impact absorption without catastrophic shattering.
  • To combat these material limitations, manufacturers focus heavily on structural fragility mitigation through advanced thermal tempering techniques. Furthermore, prolonged exposure to heavy industrial contamination degrades surface integrity, necessitating specialized coatings to maintain optimal environmental pollution resistance. Implementing these engineered enhancements reduces transit-related breakage rates by 15%, lowering overall replacement expenditures.
  • Addressing these physical constraints remains critical for manufacturers seeking to retain market share against resilient composite technologies in hostile deployment environments.

Exclusive Technavio Analysis on Customer Landscape

The glass insulators market forecasting report includes the adoption lifecycle of the market, covering from the innovator’s stage to the laggard’s stage. It focuses on adoption rates in different regions based on penetration. Furthermore, the glass insulators market report also includes key purchase criteria and drivers of price sensitivity to help companies evaluate and develop their market growth analysis strategies.
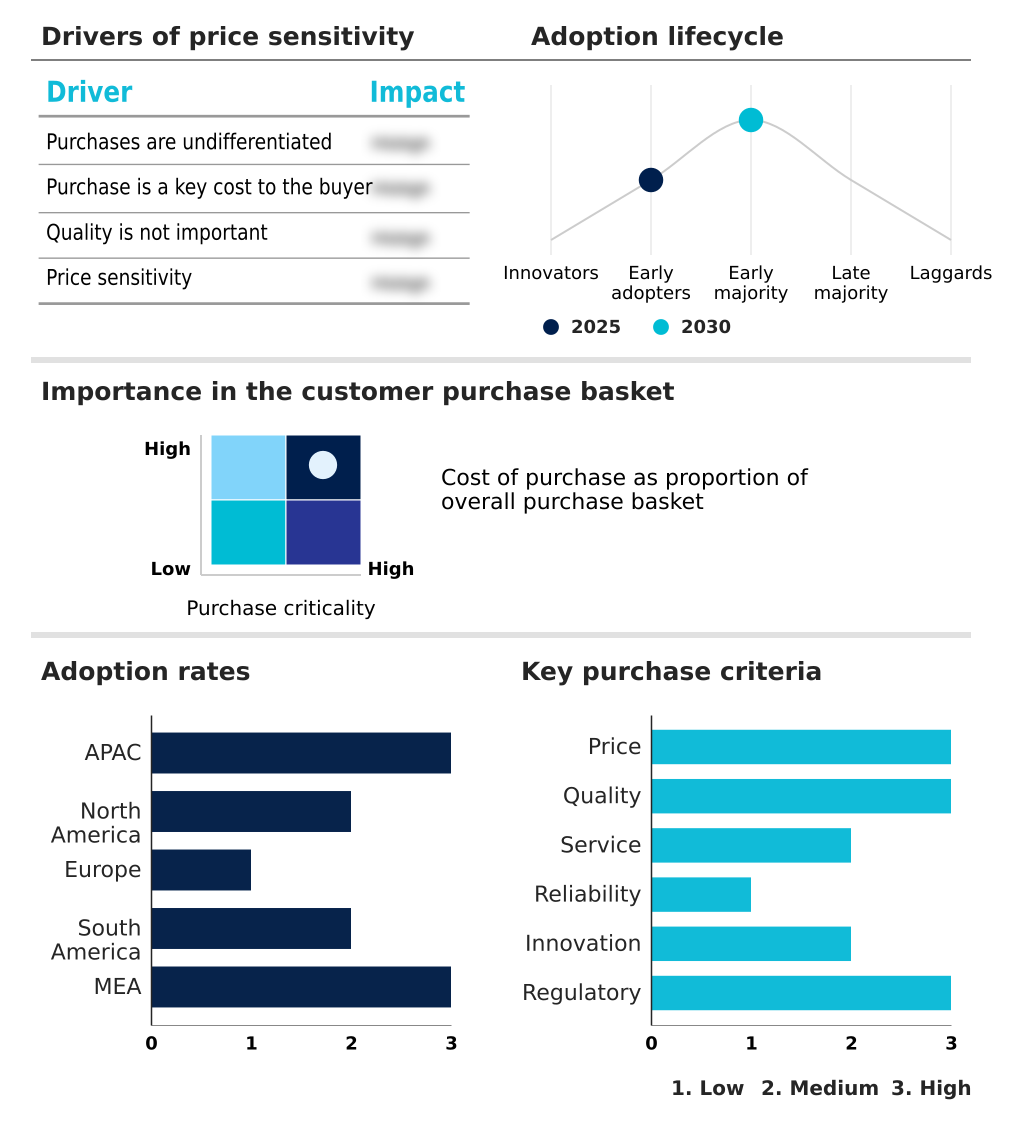
Customer Landscape of Glass Insulators Industry

Competitive Landscape

Companies are implementing various strategies, such as strategic alliances, glass insulators market forecast, partnerships, mergers and acquisitions, geographical expansion, and product/service launches, to enhance their presence in the industry.

Advait Infratech Ltd. - The entity provides advanced suspension, disc, and high-voltage transmission glass insulation hardware designed to enhance grid stability and withstand severe environmental conditions across electrical distribution networks.

The industry research and growth report includes detailed analyses of the competitive landscape of the market and information about key companies, including:

  • Advait Infratech Ltd.
  • AIZ
  • Colmate
  • Electric Powertek Co. Ltd.
  • Ensto Oy
  • Gamma Insulators
  • Gaoya Electric Power Equipment
  • Gaoya Power
  • GIG Group
  • Glass Insulators India
  • Hubbell Inc.
  • Jilin Electric Power Equipment
  • JSU U.M.E.K
  • La Granja Insulators
  • Lviv Insulator Co.
  • MacLean Power Systems
  • Nooa Electric
  • SEDIVER SAS
  • UAB AIZ
  • Victor Insulators Inc.
  • Vobo Insulator

Qualitative and quantitative analysis of companies has been conducted to help clients understand the wider business environment as well as the strengths and weaknesses of key industry players. Data is qualitatively analyzed to categorize companies as pure play, category-focused, industry-focused, and diversified; it is quantitatively analyzed to categorize companies as dominant, leading, strong, tentative, and weak.

Recent Development and News in Glass insulators market

  • In the Electrical Components and Equipment industry, the transition toward decentralized power distribution networks has necessitated robust infrastructure electrification programs, directly impacting Glass Insulators demand by requiring components that withstand varied environmental stress.
  • Stringent grid reliability improvement mandates across major utility jurisdictions have accelerated the adoption of automated optical inspection, enabling faster defect detection in Glass Insulators deployments.
  • The rapid expansion of ultra-high voltage direct current transmission corridors has redefined mechanical breaking loads criteria, increasing the reliance on toughened glass insulators to maintain stable electrical isolation.
  • Mandatory asset management workflows implemented by regulatory authorities have driven the integration of acoustic sensors and capacitive sensors into transmission hardware, transforming passive Glass Insulators into active data-gathering nodes.

Dive into Technavio’s robust research methodology, blending expert interviews, extensive data synthesis, and validated models for unparalleled Glass Insulators Market insights. See full methodology.

Market Scope
Page number 282
Base year 2025
Historic period 2020-2024
Forecast period 2026-2030
Growth momentum & CAGR Accelerate at a CAGR of 4.5%
Market growth 2026-2030 USD 240.4 million
Market structure Fragmented
YoY growth 2025-2026(%) 4.3%
Key countries China, Japan, India, South Korea, Australia, Indonesia, US, Canada, Mexico, Germany, UK, France, Italy, Spain, The Netherlands, Brazil, Argentina, Chile, Saudi Arabia, UAE, South Africa, Israel and Turkey
Competitive landscape Leading Companies, Market Positioning of Companies, Competitive Strategies, and Industry Risks

Request Free Sample

Research Analyst Overview

  • The Glass Insulators industry demonstrates robust resilience, driven by continuous infrastructure modernization and rigorous transmission safety requirements. Grid operators rapidly integrate advanced insulation hardware to effectively mitigate electrical leakage currents and prevent catastrophic line failures in densely populated urban centers. A major utility network implemented specialized toughened glass configurations, resulting in a 25% improvement in fault isolation efficiency.
  • Routine maintenance increasingly relies on drone-based thermal imaging and ultraviolet diagnostics, allowing technicians to identify microscopic surface defects before total grid failure transpires. These technologies streamline asset management workflows, significantly reducing costly manual inspection cycles. Field data transmits directly to centralized control rooms, enabling real-time condition monitoring and rapid response to grid anomalies.
  • Enhanced thermal stability and optical transparency remain critical for long-term operational success. Strategic alignment with these diagnostic innovations empowers utilities to satisfy stringent environmental compliance mandates and optimize long-term capital allocation strategies.

What are the Key Data Covered in this Glass Insulators Market Research and Growth Report?

  • What is the expected growth of the Glass Insulators Market between 2026 and 2030?

    • USD 240.4 million, at a CAGR of 4.5%

  • What segmentation does the market report cover?

    • The report is segmented by Type (Suspension glass insulators, and Pin glass insulators), Application (HVAC, Distribution and railway, and HVDC), Power Rating (High voltage, Low and medium voltage, and Extra-high voltage) and Geography (APAC, North America, Europe, South America, Middle East and Africa)

  • Which regions are analyzed in the report?

    • APAC, North America, Europe, South America and Middle East and Africa

  • What are the key growth drivers and market challenges?

    • Rapid urbanization and industrial expansion, Fragile material vulnerability and breakage

  • Who are the major players in the Glass Insulators Market?

    • Advait Infratech Ltd., AIZ, Colmate, Electric Powertek Co. Ltd., Ensto Oy, Gamma Insulators, Gaoya Electric Power Equipment, Gaoya Power, GIG Group, Glass Insulators India, Hubbell Inc., Jilin Electric Power Equipment, JSU U.M.E.K, La Granja Insulators, Lviv Insulator Co., MacLean Power Systems, Nooa Electric, SEDIVER SAS, UAB AIZ, Victor Insulators Inc. and Vobo Insulator

Market Research Insights

  • The Glass Insulators Market underpins the stability of modern overhead power lines, providing critical electrical separation for high-voltage infrastructure. Utility operators navigate a comprehensive digital ecosystem transformation to enhance transmission reliability and safety. By deploying toughened glass units equipped with advanced diagnostic capabilities, asset managers realize a 20% improvement in aerial inspection efficiency.
  • Furthermore, optimized manufacturing and targeted deployment strategies contribute to a 15% lifecycle cost reduction compared to legacy ceramic alternatives. Strengthening regional supply chain resilience mitigates transportation-related fractures, significantly lowering operational overhead. These measurable improvements in fault detection and logistics align directly with stringent compliance mandates, ensuring stable energy distribution across expanding industrial and urban grid networks.

We can help! Our analysts can customize this glass insulators market research report to meet your requirements.

Get in touch

1. Executive Summary

1.1 Market overview

Executive Summary - Chart on Market Overview
Executive Summary - Data Table on Market Overview
Executive Summary - Chart on Global Market Characteristics
Executive Summary - Chart on Market by Geography
Executive Summary - Chart on Market Segmentation by Type
Executive Summary - Chart on Market Segmentation by Application
Executive Summary - Chart on Market Segmentation by Power Rating
Executive Summary - Chart on Incremental Growth
Executive Summary - Data Table on Incremental Growth
Executive Summary - Chart on Company Market Positioning

2. Technavio Analysis

2.1 Analysis of price sensitivity, lifecycle, customer purchase basket, adoption rates, and purchase criteria

2.2 Criticality of inputs and Factors of differentiation

Chart on Overview on criticality of inputs and factors of differentiation

2.3 Factors of disruption

Chart on Overview on factors of disruption

2.4 Impact of drivers and challenges

Chart on Impact of drivers and challenges in 2025 and 2030

3. Market Landscape

3.1 Market ecosystem

Chart on Parent Market
Data Table on - Parent Market

3.2 Market characteristics

Chart on Market characteristics analysis

3.3 Value chain analysis

Chart on Value chain analysis

4. Market Sizing

4.1 Market definition

Data Table on Offerings of companies included in the market definition

4.2 Market segment analysis

Market segments

4.3 Market size 2025

4.4 Market outlook: Forecast for 2025-2030

Chart on Global - Market size and forecast 2025-2030 ($ million)
Data Table on Global - Market size and forecast 2025-2030 ($ million)
Chart on Global Market: Year-over-year growth 2025-2030 (%)
Data Table on Global Market: Year-over-year growth 2025-2030 (%)

5. Historic Market Size

5.1 Global Glass Insulators Market 2020 - 2024

Historic Market Size - Data Table on Global Glass Insulators Market 2020 - 2024 ($ million)

5.2 Type segment analysis 2020 - 2024

Historic Market Size - Type Segment 2020 - 2024 ($ million)

5.3 Application segment analysis 2020 - 2024

Historic Market Size - Application Segment 2020 - 2024 ($ million)

5.4 Power Rating segment analysis 2020 - 2024

Historic Market Size - Power Rating Segment 2020 - 2024 ($ million)

5.5 Geography segment analysis 2020 - 2024

Historic Market Size - Geography Segment 2020 - 2024 ($ million)

5.6 Country segment analysis 2020 - 2024

Historic Market Size - Country Segment 2020 - 2024 ($ million)

6. Qualitative Analysis

6.1 Impact of AI on Global Glass Insulators Market

6.2 Impact of geopolitical conflicts on Global Glass Insulators Market

7. Five Forces Analysis

7.1 Five forces summary

Five forces analysis - Comparison between 2025 and 2030

7.2 Bargaining power of buyers

Bargaining power of buyers - Impact of key factors 2025 and 2030

7.3 Bargaining power of suppliers

Bargaining power of suppliers - Impact of key factors in 2025 and 2030

7.4 Threat of new entrants

Threat of new entrants - Impact of key factors in 2025 and 2030

7.5 Threat of substitutes

Threat of substitutes - Impact of key factors in 2025 and 2030

7.6 Threat of rivalry

Threat of rivalry - Impact of key factors in 2025 and 2030

7.7 Market condition

Chart on Market condition - Five forces 2025 and 2030

8. Market Segmentation by Type

8.1 Market segments

Chart on Type - Market share 2025-2030 (%)
Data Table on Type - Market share 2025-2030 (%)

8.2 Comparison by Type

Chart on Comparison by Type
Data Table on Comparison by Type

8.3 Suspension glass insulators - Market size and forecast 2025-2030

Chart on Suspension glass insulators - Market size and forecast 2025-2030 ($ million)
Data Table on Suspension glass insulators - Market size and forecast 2025-2030 ($ million)
Chart on Suspension glass insulators - Year-over-year growth 2025-2030 (%)
Data Table on Suspension glass insulators - Year-over-year growth 2025-2030 (%)

8.4 Pin glass insulators - Market size and forecast 2025-2030

Chart on Pin glass insulators - Market size and forecast 2025-2030 ($ million)
Data Table on Pin glass insulators - Market size and forecast 2025-2030 ($ million)
Chart on Pin glass insulators - Year-over-year growth 2025-2030 (%)
Data Table on Pin glass insulators - Year-over-year growth 2025-2030 (%)

8.5 Market opportunity by Type

Market opportunity by Type ($ million)
Data Table on Market opportunity by Type ($ million)

9. Market Segmentation by Application

9.1 Market segments

Chart on Application - Market share 2025-2030 (%)
Data Table on Application - Market share 2025-2030 (%)

9.2 Comparison by Application

Chart on Comparison by Application
Data Table on Comparison by Application

9.3 HVAC - Market size and forecast 2025-2030

Chart on HVAC - Market size and forecast 2025-2030 ($ million)
Data Table on HVAC - Market size and forecast 2025-2030 ($ million)
Chart on HVAC - Year-over-year growth 2025-2030 (%)
Data Table on HVAC - Year-over-year growth 2025-2030 (%)

9.4 Distribution and railway - Market size and forecast 2025-2030

Chart on Distribution and railway - Market size and forecast 2025-2030 ($ million)
Data Table on Distribution and railway - Market size and forecast 2025-2030 ($ million)
Chart on Distribution and railway - Year-over-year growth 2025-2030 (%)
Data Table on Distribution and railway - Year-over-year growth 2025-2030 (%)

9.5 HVDC - Market size and forecast 2025-2030

Chart on HVDC - Market size and forecast 2025-2030 ($ million)
Data Table on HVDC - Market size and forecast 2025-2030 ($ million)
Chart on HVDC - Year-over-year growth 2025-2030 (%)
Data Table on HVDC - Year-over-year growth 2025-2030 (%)

9.6 Market opportunity by Application

Market opportunity by Application ($ million)
Data Table on Market opportunity by Application ($ million)

10. Market Segmentation by Power Rating

10.1 Market segments

Chart on Power Rating - Market share 2025-2030 (%)
Data Table on Power Rating - Market share 2025-2030 (%)

10.2 Comparison by Power Rating

Chart on Comparison by Power Rating
Data Table on Comparison by Power Rating

10.3 High voltage - Market size and forecast 2025-2030

Chart on High voltage - Market size and forecast 2025-2030 ($ million)
Data Table on High voltage - Market size and forecast 2025-2030 ($ million)
Chart on High voltage - Year-over-year growth 2025-2030 (%)
Data Table on High voltage - Year-over-year growth 2025-2030 (%)

10.4 Low and medium voltage - Market size and forecast 2025-2030

Chart on Low and medium voltage - Market size and forecast 2025-2030 ($ million)
Data Table on Low and medium voltage - Market size and forecast 2025-2030 ($ million)
Chart on Low and medium voltage - Year-over-year growth 2025-2030 (%)
Data Table on Low and medium voltage - Year-over-year growth 2025-2030 (%)

10.5 Extra-high voltage - Market size and forecast 2025-2030

Chart on Extra-high voltage - Market size and forecast 2025-2030 ($ million)
Data Table on Extra-high voltage - Market size and forecast 2025-2030 ($ million)
Chart on Extra-high voltage - Year-over-year growth 2025-2030 (%)
Data Table on Extra-high voltage - Year-over-year growth 2025-2030 (%)

10.6 Market opportunity by Power Rating

Market opportunity by Power Rating ($ million)
Data Table on Market opportunity by Power Rating ($ million)

11. Customer Landscape

11.1 Customer landscape overview

Analysis of price sensitivity, lifecycle, customer purchase basket, adoption rates, and purchase criteria

12. Geographic Landscape

12.1 Geographic segmentation

Chart on Market share by geography 2025-2030 (%)
Data Table on Market share by geography 2025-2030 (%)

12.2 Geographic comparison

Chart on Geographic comparison
Data Table on Geographic comparison

12.3 APAC - Market size and forecast 2025-2030

Chart on APAC - Market size and forecast 2025-2030 ($ million)
Data Table on APAC - Market size and forecast 2025-2030 ($ million)
Chart on APAC - Year-over-year growth 2025-2030 (%)
Data Table on APAC - Year-over-year growth 2025-2030 (%)
Chart on Regional Comparison - APAC
Data Table on Regional Comparison - APAC

12.3.1 China - Market size and forecast 2025-2030

Chart on China - Market size and forecast 2025-2030 ($ million)
Data Table on China - Market size and forecast 2025-2030 ($ million)
Chart on China - Year-over-year growth 2025-2030 (%)
Data Table on China - Year-over-year growth 2025-2030 (%)

12.3.2 Japan - Market size and forecast 2025-2030

Chart on Japan - Market size and forecast 2025-2030 ($ million)
Data Table on Japan - Market size and forecast 2025-2030 ($ million)
Chart on Japan - Year-over-year growth 2025-2030 (%)
Data Table on Japan - Year-over-year growth 2025-2030 (%)

12.3.3 India - Market size and forecast 2025-2030

Chart on India - Market size and forecast 2025-2030 ($ million)
Data Table on India - Market size and forecast 2025-2030 ($ million)
Chart on India - Year-over-year growth 2025-2030 (%)
Data Table on India - Year-over-year growth 2025-2030 (%)

12.3.4 South Korea - Market size and forecast 2025-2030

Chart on South Korea - Market size and forecast 2025-2030 ($ million)
Data Table on South Korea - Market size and forecast 2025-2030 ($ million)
Chart on South Korea - Year-over-year growth 2025-2030 (%)
Data Table on South Korea - Year-over-year growth 2025-2030 (%)

12.3.5 Australia - Market size and forecast 2025-2030

Chart on Australia - Market size and forecast 2025-2030 ($ million)
Data Table on Australia - Market size and forecast 2025-2030 ($ million)
Chart on Australia - Year-over-year growth 2025-2030 (%)
Data Table on Australia - Year-over-year growth 2025-2030 (%)

12.3.6 Indonesia - Market size and forecast 2025-2030

Chart on Indonesia - Market size and forecast 2025-2030 ($ million)
Data Table on Indonesia - Market size and forecast 2025-2030 ($ million)
Chart on Indonesia - Year-over-year growth 2025-2030 (%)
Data Table on Indonesia - Year-over-year growth 2025-2030 (%)

12.4 North America - Market size and forecast 2025-2030

Chart on North America - Market size and forecast 2025-2030 ($ million)
Data Table on North America - Market size and forecast 2025-2030 ($ million)
Chart on North America - Year-over-year growth 2025-2030 (%)
Data Table on North America - Year-over-year growth 2025-2030 (%)
Chart on Regional Comparison - North America
Data Table on Regional Comparison - North America

12.4.1 US - Market size and forecast 2025-2030

Chart on US - Market size and forecast 2025-2030 ($ million)
Data Table on US - Market size and forecast 2025-2030 ($ million)
Chart on US - Year-over-year growth 2025-2030 (%)
Data Table on US - Year-over-year growth 2025-2030 (%)

12.4.2 Canada - Market size and forecast 2025-2030

Chart on Canada - Market size and forecast 2025-2030 ($ million)
Data Table on Canada - Market size and forecast 2025-2030 ($ million)
Chart on Canada - Year-over-year growth 2025-2030 (%)
Data Table on Canada - Year-over-year growth 2025-2030 (%)

12.4.3 Mexico - Market size and forecast 2025-2030

Chart on Mexico - Market size and forecast 2025-2030 ($ million)
Data Table on Mexico - Market size and forecast 2025-2030 ($ million)
Chart on Mexico - Year-over-year growth 2025-2030 (%)
Data Table on Mexico - Year-over-year growth 2025-2030 (%)

12.5 Europe - Market size and forecast 2025-2030

Chart on Europe - Market size and forecast 2025-2030 ($ million)
Data Table on Europe - Market size and forecast 2025-2030 ($ million)
Chart on Europe - Year-over-year growth 2025-2030 (%)
Data Table on Europe - Year-over-year growth 2025-2030 (%)
Chart on Regional Comparison - Europe
Data Table on Regional Comparison - Europe

12.5.1 Germany - Market size and forecast 2025-2030

Chart on Germany - Market size and forecast 2025-2030 ($ million)
Data Table on Germany - Market size and forecast 2025-2030 ($ million)
Chart on Germany - Year-over-year growth 2025-2030 (%)
Data Table on Germany - Year-over-year growth 2025-2030 (%)

12.5.2 UK - Market size and forecast 2025-2030

Chart on UK - Market size and forecast 2025-2030 ($ million)
Data Table on UK - Market size and forecast 2025-2030 ($ million)
Chart on UK - Year-over-year growth 2025-2030 (%)
Data Table on UK - Year-over-year growth 2025-2030 (%)

12.5.3 France - Market size and forecast 2025-2030

Chart on France - Market size and forecast 2025-2030 ($ million)
Data Table on France - Market size and forecast 2025-2030 ($ million)
Chart on France - Year-over-year growth 2025-2030 (%)
Data Table on France - Year-over-year growth 2025-2030 (%)

12.5.4 Italy - Market size and forecast 2025-2030

Chart on Italy - Market size and forecast 2025-2030 ($ million)
Data Table on Italy - Market size and forecast 2025-2030 ($ million)
Chart on Italy - Year-over-year growth 2025-2030 (%)
Data Table on Italy - Year-over-year growth 2025-2030 (%)

12.5.5 Spain - Market size and forecast 2025-2030

Chart on Spain - Market size and forecast 2025-2030 ($ million)
Data Table on Spain - Market size and forecast 2025-2030 ($ million)
Chart on Spain - Year-over-year growth 2025-2030 (%)
Data Table on Spain - Year-over-year growth 2025-2030 (%)

12.5.6 The Netherlands - Market size and forecast 2025-2030

Chart on The Netherlands - Market size and forecast 2025-2030 ($ million)
Data Table on The Netherlands - Market size and forecast 2025-2030 ($ million)
Chart on The Netherlands - Year-over-year growth 2025-2030 (%)
Data Table on The Netherlands - Year-over-year growth 2025-2030 (%)

12.6 South America - Market size and forecast 2025-2030

Chart on South America - Market size and forecast 2025-2030 ($ million)
Data Table on South America - Market size and forecast 2025-2030 ($ million)
Chart on South America - Year-over-year growth 2025-2030 (%)
Data Table on South America - Year-over-year growth 2025-2030 (%)
Chart on Regional Comparison - South America
Data Table on Regional Comparison - South America

12.6.1 Brazil - Market size and forecast 2025-2030

Chart on Brazil - Market size and forecast 2025-2030 ($ million)
Data Table on Brazil - Market size and forecast 2025-2030 ($ million)
Chart on Brazil - Year-over-year growth 2025-2030 (%)
Data Table on Brazil - Year-over-year growth 2025-2030 (%)

12.6.2 Argentina - Market size and forecast 2025-2030

Chart on Argentina - Market size and forecast 2025-2030 ($ million)
Data Table on Argentina - Market size and forecast 2025-2030 ($ million)
Chart on Argentina - Year-over-year growth 2025-2030 (%)
Data Table on Argentina - Year-over-year growth 2025-2030 (%)

12.6.3 Chile - Market size and forecast 2025-2030

Chart on Chile - Market size and forecast 2025-2030 ($ million)
Data Table on Chile - Market size and forecast 2025-2030 ($ million)
Chart on Chile - Year-over-year growth 2025-2030 (%)
Data Table on Chile - Year-over-year growth 2025-2030 (%)

12.7 Middle East and Africa - Market size and forecast 2025-2030

Chart on Middle East and Africa - Market size and forecast 2025-2030 ($ million)
Data Table on Middle East and Africa - Market size and forecast 2025-2030 ($ million)
Chart on Middle East and Africa - Year-over-year growth 2025-2030 (%)
Data Table on Middle East and Africa - Year-over-year growth 2025-2030 (%)
Chart on Regional Comparison - Middle East and Africa
Data Table on Regional Comparison - Middle East and Africa

12.7.1 Saudi Arabia - Market size and forecast 2025-2030

Chart on Saudi Arabia - Market size and forecast 2025-2030 ($ million)
Data Table on Saudi Arabia - Market size and forecast 2025-2030 ($ million)
Chart on Saudi Arabia - Year-over-year growth 2025-2030 (%)
Data Table on Saudi Arabia - Year-over-year growth 2025-2030 (%)

12.7.2 UAE - Market size and forecast 2025-2030

Chart on UAE - Market size and forecast 2025-2030 ($ million)
Data Table on UAE - Market size and forecast 2025-2030 ($ million)
Chart on UAE - Year-over-year growth 2025-2030 (%)
Data Table on UAE - Year-over-year growth 2025-2030 (%)

12.7.3 South Africa - Market size and forecast 2025-2030

Chart on South Africa - Market size and forecast 2025-2030 ($ million)
Data Table on South Africa - Market size and forecast 2025-2030 ($ million)
Chart on South Africa - Year-over-year growth 2025-2030 (%)
Data Table on South Africa - Year-over-year growth 2025-2030 (%)

12.7.4 Israel - Market size and forecast 2025-2030

Chart on Israel - Market size and forecast 2025-2030 ($ million)
Data Table on Israel - Market size and forecast 2025-2030 ($ million)
Chart on Israel - Year-over-year growth 2025-2030 (%)
Data Table on Israel - Year-over-year growth 2025-2030 (%)

12.7.5 Turkey - Market size and forecast 2025-2030

Chart on Turkey - Market size and forecast 2025-2030 ($ million)
Data Table on Turkey - Market size and forecast 2025-2030 ($ million)
Chart on Turkey - Year-over-year growth 2025-2030 (%)
Data Table on Turkey - Year-over-year growth 2025-2030 (%)

12.8 Market opportunity by geography

Market opportunity by geography ($ million)
Data Tables on Market opportunity by geography ($ million)

13. Drivers, Challenges, and Opportunity

13.1 Market drivers

Rapid urbanization and industrial expansion
Stringent safety and environmental regulations
Technological advancements in manufacturing

13.2 Market challenges

Fragile material vulnerability and breakage
Intense competition from polymer alternatives
Integration complexities with smart grids

13.3 Impact of drivers and challenges

Impact of drivers and challenges in 2025 and 2030

13.4 Market opportunities

Digital substation integration and smart monitoring
Emergence of high-speed rail electrification
Advanced anti contamination coating innovations

14. Competitive Landscape

14.1 Overview

14.2

Overview on criticality of inputs and factors of differentiation

14.3 Landscape disruption

Overview on factors of disruption

14.4 Industry risks

Impact of key risks on business

15. Competitive Analysis

15.1 Companies profiled

Companies covered

15.2 Company ranking index

15.3 Market positioning of companies

Matrix on companies position and classification

15.4 Advait Infratech Ltd.

Advait Infratech Ltd. - Overview
Advait Infratech Ltd. - Product / Service
Advait Infratech Ltd. - Key offerings
SWOT

15.5 AIZ

AIZ - Overview
AIZ - Product / Service
AIZ - Key offerings
SWOT

15.6 Colmate

Colmate - Overview
Colmate - Product / Service
Colmate - Key offerings
SWOT

15.7 Electric Powertek Co. Ltd.

Electric Powertek Co. Ltd. - Overview
Electric Powertek Co. Ltd. - Product / Service
Electric Powertek Co. Ltd. - Key offerings
SWOT

15.8 Ensto Oy

Ensto Oy - Overview
Ensto Oy - Product / Service
Ensto Oy - Key offerings
SWOT

15.9 Gamma Insulators

Gamma Insulators - Overview
Gamma Insulators - Product / Service
Gamma Insulators - Key offerings
SWOT

15.10 Gaoya Electric Power Equipment

Gaoya Electric Power Equipment - Overview
Gaoya Electric Power Equipment - Product / Service
Gaoya Electric Power Equipment - Key offerings
SWOT

15.11 Gaoya Power

Gaoya Power - Overview
Gaoya Power - Product / Service
Gaoya Power - Key offerings
SWOT

15.12 GIG Group

GIG Group - Overview
GIG Group - Product / Service
GIG Group - Key offerings
SWOT

15.13 Glass Insulators India

Glass Insulators India - Overview
Glass Insulators India - Product / Service
Glass Insulators India - Key offerings
SWOT

15.14 Hubbell Inc.

Hubbell Inc. - Overview
Hubbell Inc. - Business segments
Hubbell Inc. - Key offerings
Hubbell Inc. - Segment focus
SWOT

15.15 Lviv Insulator Co.

Lviv Insulator Co. - Overview
Lviv Insulator Co. - Product / Service
Lviv Insulator Co. - Key offerings
SWOT

15.16 MacLean Power Systems

MacLean Power Systems - Overview
MacLean Power Systems - Product / Service
MacLean Power Systems - Key offerings
SWOT

15.17 UAB AIZ

UAB AIZ - Overview
UAB AIZ - Product / Service
UAB AIZ - Key offerings
SWOT

15.18 Victor Insulators Inc.

Victor Insulators Inc. - Overview
Victor Insulators Inc. - Product / Service
Victor Insulators Inc. - Key offerings
SWOT

16. Appendix

16.1 Scope of the report

Market definition
Objectives
Notes and caveats

16.2 Inclusions and exclusions checklist

Inclusions checklist
Exclusions checklist

16.3 Currency conversion rates for US$

16.4 Research methodology

16.5 Data procurement

Information sources

16.6 Data validation

16.7 Validation techniques employed for market sizing

16.8 Data synthesis

16.9 360 degree market analysis

16.10 List of abbreviations

Research Methodology

Technavio presents a detailed picture of the market by way of study, synthesis, and summation of data from multiple sources. The analysts have presented the various facets of the market with a particular focus on identifying the key industry influencers. The data thus presented is comprehensive, reliable, and the result of extensive research, both primary and secondary.

INFORMATION SOURCES

Primary sources

  • Manufacturers and suppliers
  • Channel partners
  • Industry experts
  • Strategic decision makers

Secondary sources

  • Industry journals and periodicals
  • Government data
  • Financial reports of key industry players
  • Historical data
  • Press releases

DATA ANALYSIS

Data Synthesis

  • Collation of data
  • Estimation of key figures
  • Analysis of derived insights

Data Validation

  • Triangulation with data models
  • Reference against proprietary databases
  • Corroboration with industry experts

REPORT WRITING

Qualitative

  • Market drivers
  • Market challenges
  • Market trends
  • Five forces analysis

Quantitative

  • Market size and forecast
  • Market segmentation
  • Geographical insights
  • Competitive landscape

Interested in this report?

Get your sample now to see our research methodology and insights!

Download Now

Frequently Asked Questions

Glass Insulators market growth will increase by USD 240.4 million during 2026-2030.

The Glass Insulators market is expected to grow at a CAGR of 4.5% during 2026-2030.

Glass Insulators market is segmented by Type (Suspension glass insulators, Pin glass insulators) Application (HVAC, Distribution and railway, HVDC) Power rating (High voltage, Low and medium voltage, Extra-high voltage)

Advait Infratech Ltd., AIZ, Colmate, Electric Powertek Co. Ltd., Ensto Oy, Gamma Insulators, Gaoya Electric Power Equipment, Gaoya Power, GIG Group, Glass Insulators India, Hubbell Inc., Jilin Electric Power Equipment, JSU U.M.E.K, La Granja Insulators, Lviv Insulator Co., MacLean Power Systems, Nooa Electric, SEDIVER SAS, UAB AIZ, Victor Insulators Inc., Vobo Insulator are a few of the key vendors in the Glass Insulators market.

APAC will register the highest growth rate of 51.5% among the other regions. Therefore, the Glass Insulators market in APAC is expected to garner significant business opportunities for the vendors during the forecast period.

China, Japan, India, South Korea, Australia, Indonesia, US, Canada, Mexico, Germany, UK, France, Italy, Spain, The Netherlands, Brazil, Argentina, Chile, Saudi Arabia, UAE, South Africa, Israel, Turkey

  • Rapid urbanization and industrial expansion is the driving factor this market.

The Glass Insulators market vendors should focus on grabbing business opportunities from the Type segment as it accounted for the largest market share in the base year.
RIA - Research AI Assistant
Ask RIA
