Offshore Drilling Market Analysis North America, Middle East and Africa, Europe, APAC, South America - US, Saudi Arabia, United Arab Emirates, China, Russia - Size and Forecast 2024-2028

Offshore Drilling Market Analysis North America, Middle East and Africa, Europe, APAC, South America - US, Saudi Arabia, United Arab Emirates, China, Russia - Size and Forecast 2024-2028

Published: Mar 2024 175 Pages SKU: IRTNTR44563

Market Overview at a Glance

$8.18 B
Market Opportunity
4.42%
CAGR
4.3
YoY growth 2023-2024(%)

Offshore Drilling Market Size 2024-2028

The offshore drilling market size is forecast to increase by USD 8.18 billion at a CAGR of 4.42% between 2023 and 2028.

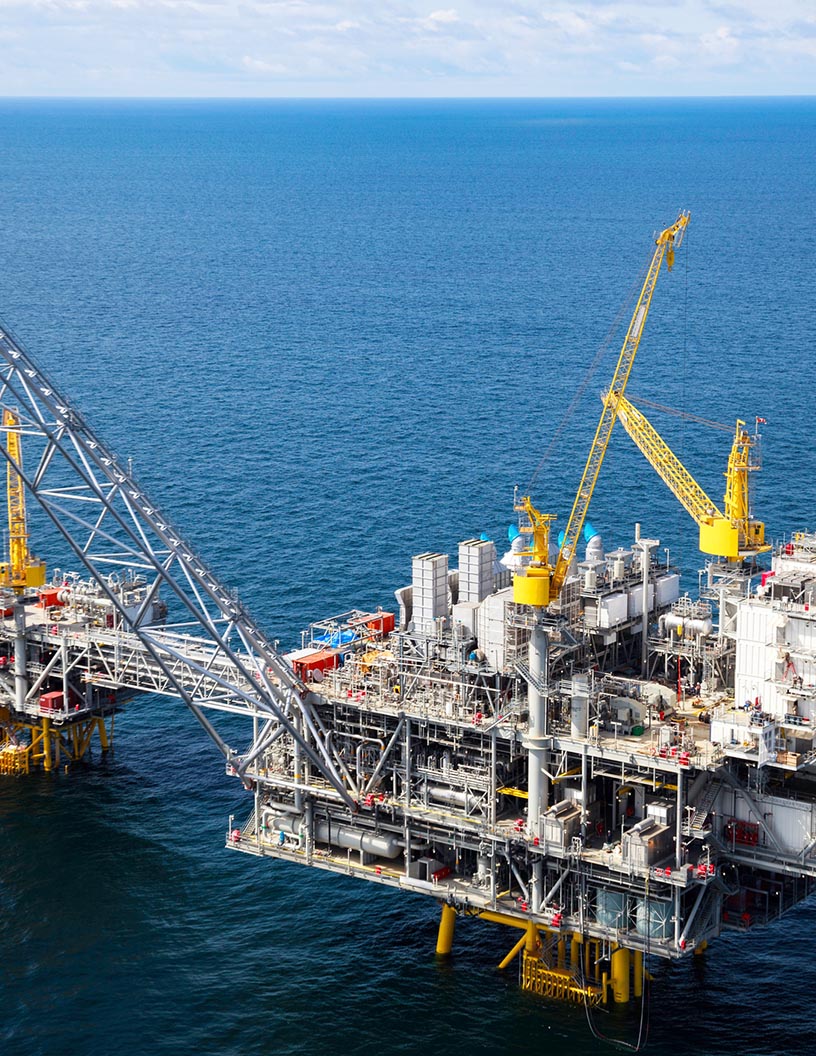
  • The market is experiencing significant growth, driven by the increasing demand for oil and natural gas. Mechanical processes on the sea bed for oil and gas extraction continue to evolve, enabling exploration in deeper waters and harsher environments. However, the environmental implications of offshore E and P activities remain a challenge, with concerns over fuel consumption and greenhouse gas emissions. The market is experiencing growth, driven by the increasing use of mobile offshore drilling units and the rising demand for shale gas exploration and production. The ocean floor's fragile ecosystems and potential impacts on marine life require careful consideration. The offshore oil supply chain faces complex logistical challenges, including transportation and infrastructure development. As the industry adapts to these trends and challenges, innovation and technological advancements will play a crucial role in minimizing environmental impact and maximizing efficiency.

What will be the Size of the Offshore Drilling Market During the Forecast Period?

Offshore Drilling Market Size

 Request Free Sample

  • The market is driven by the increasing energy demand and the need for oil production from hydrocarbon resources located in deep and shallow waters. Energy consumption is a significant factor, in the transportation sector, particularly the growing adoption of electric vehicles, shifting towards renewable energy sources. However, the transition to green energy is not expected to impact the market significantly In the short term. Drillships technology plays a crucial role in deepwater resource development, enabling exploration in areas with complex geological conditions. Automation and robotics are being increasingly adopted to enhance drilling efficiency and reduce operational costs. Petrobras and other energy companies continue to secure exploration contracts for both Deepwater And Ultra-Deepwater Drilling.
  • Environmental implications are a concern for offshore drilling, with seismic blasting and oil spills posing risks to marine ecosystems. Environmental agencies are implementing stricter regulations to mitigate these risks. Controlled pressure drilling and the use of advanced technologies, such as the sea bed drilling system, are helping to minimize environmental impact. The market is expected to continue its growth, driven by energy security concerns and the need to meet global hydrocarbon demand.

How is this Offshore Drilling Industry segmented and which is the largest segment?

The industry research report provides comprehensive data (region-wise segment analysis), with forecasts and estimates in "USD billion" for the period 2024-2028, as well as historical data from 2018-2022 for the following segments.

  • Application
    • Shallow water
    • Deepwater
    • Ultra deepwater
  • Type
    • Jack up rigs
    • Semisubmersibles
    • Drill ships
    • Others
  • Geography
    • North America
      • US
    • Middle East and Africa
    • Europe
    • APAC
      • China
    • South America

By Application Insights

  • The shallow water segment is estimated to witness significant growth during the forecast period.

The shallow water segment of the market is experiencing significant growth due to several factors. Shallow water drilling, which refers to depths of up to 500 feet, has been a long-standing practice since the mid-20th century. Compared to deepwater and ultra-deepwater drilling, shallow water drilling is considered safer as oil spills are rare and less complex, leading to improved safety and economic viability. With the increasing natural gas demand and the global energy sector's shift towards reducing carbon emissions, the role of offshore drilling in meeting energy requirements is more crucial than ever.

In shallow water, drillships and submersibles are commonly used due to the requirement for their structures to rest on the seabed. These factors are expected to drive the expansion of exploration activities in shallow water during the forecast period.

Offshore Drilling Market Size

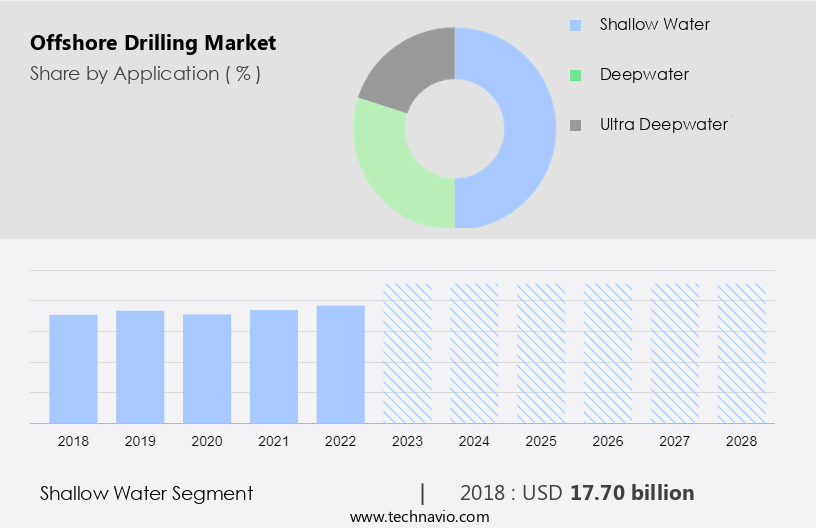
Get a glance at the  Offshore Drilling Industry report of share of various segments Request Free Sample

The Shallow water segment was valued at USD 17.70 billion in 2018 and showed a gradual increase during the forecast period.

Regional Analysis

  • North America is estimated to contribute 40% to the growth of the global market during the forecast period.

Technavio’s analysts have elaborately explained the regional trends and drivers that shape the market during the forecast period.

Offshore Drilling Market Share by Geography

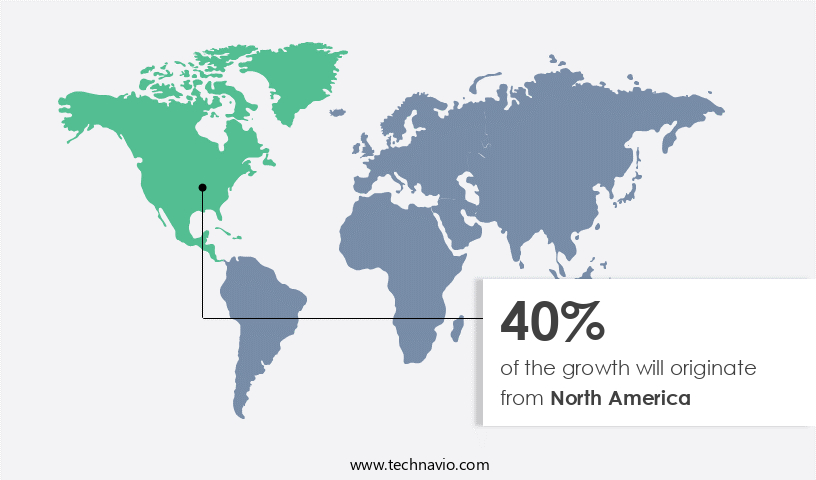
For more insights on the market share of various regions, Request Free Sample

In the market, North America holds significant importance, with Mexico and the United States being the primary contributors in 2023. The region's market growth is anticipated to accelerate over the forecast period due to the revival of deep and ultra-deep oil and gas projects In the Gulf of Mexico (GOM). The growth of these projects is driven by the increasing demand for natural gas and the subsequent rise in crude oil prices. Moreover, the untapped potential for exploration in offshore drilling has attracted substantial investments, further fueling the market expansion. Despite the growing emphasis on renewable energy sources and concerns over carbon emissions, offshore drilling remains a crucial global energy source. The market is characterized by the deployment of advanced technologies, including drillships, for exploration in shallow water areas.

Market Dynamics

Our researchers analyzed the data with 2023 as the base year, along with the key drivers, trends, and challenges. A holistic analysis of drivers will help companies refine their marketing strategies to gain a competitive advantage.

What are the key market drivers leading to the rise In the adoption of Offshore Drilling Industry?

Growth in demand for oil and natural gas is the key driver of the market.

  • The global energy landscape is witnessing a significant shift towards increased energy consumption, with oil production being a key contributor. According to the US Energy Information Administration, global liquid fuel consumption is projected to reach 101.1 mbpd by the end of 2021, up from 96.94 mbpd in 2016. This growth can be attributed to the rising demand for oil and gas, as well as the depletion of existing reservoirs. To meet this demand, the market is experiencing a rise . Advanced technologies such as automation and hydrocarbon exploration are playing a crucial role In the development of deepwater drillships and the production of hard-to-reach reserves.
  • Furthermore, the transition towards electric vehicles and renewable energy sources is expected to increase the demand for oil and gas In the coming years, making offshore drilling an essential component of the global energy mix.

What are the market trends shaping the Offshore Drilling Industry?

Declining costs of offshore projects is the upcoming market trend.

  • Offshore drilling refers to the exploration and extraction of hydrocarbons from beneath the seabed. Due to the complexities and additional requirements for processing and transportation after extraction, offshore drilling projects incur higher costs than onshore drilling projects. The drillships used in offshore locations are more sophisticated and expensive than onshore drilling equipment. The long timeline and added risks associated with offshore drilling necessitate significant investments. However, the profitability of offshore drilling has been improving, and its demand continues to be strong due to the increasing energy consumption and the rising demand for oil and gas to meet the energy needs of various industries, including transportation via electric vehicles.
  • According to the International Energy Agency (IEA), the costs of offshore oil and gas drilling projects have been decreasing over the past few years, making them more economically viable. Automation and technological advancements are also playing a crucial role in reducing the costs and risks of offshore drilling. Despite the challenges, the market is expected to grow steadily In the coming years due to the increasing energy demand and the limited availability of onshore drilling sites.

What challenges does the Offshore Drilling Industry face during its growth?

Environmental concerns associated with offshore E and P activities is a key challenge affecting the industry growth.

  • The market plays a significant role in meeting the world's energy demand by producing hydrocarbons, primarily oil, which is a major source of energy consumption for transportation, heating homes, and manufacturing various products. However, the exploration and production (E&P) activities associated with offshore drilling have potential environmental implications. Oil spills, air and water pollution from toxic chemical emissions, and climate change due to methane emissions are some of the adverse effects of offshore drilling. Drilling mud, used In the drilling process to cool and lubricate the pipe and drill bit, contains toxic chemicals that can harm marine life when released into seawater.
  • The offshore drilling industry is responding to these concerns through automation and the use of cleaner technologies. For instance, drillships, which are mobile offshore drilling units, are increasingly being used for deepwater drilling to minimize the environmental impact of onshore drilling. Additionally, the shift towards electric vehicles and renewable energy sources is expected to reduce the overall demand for oil and gas, potentially mitigating the environmental impact of offshore drilling In the long run.

Exclusive Customer Landscape

The market forecasting report includes the adoption lifecycle of the market, covering from the innovator’s stage to the laggard’s stage. It focuses on adoption rates in different regions based on penetration. Furthermore, the market report also includes key purchase criteria and drivers of price sensitivity to help companies evaluate and develop their market growth analysis strategies.
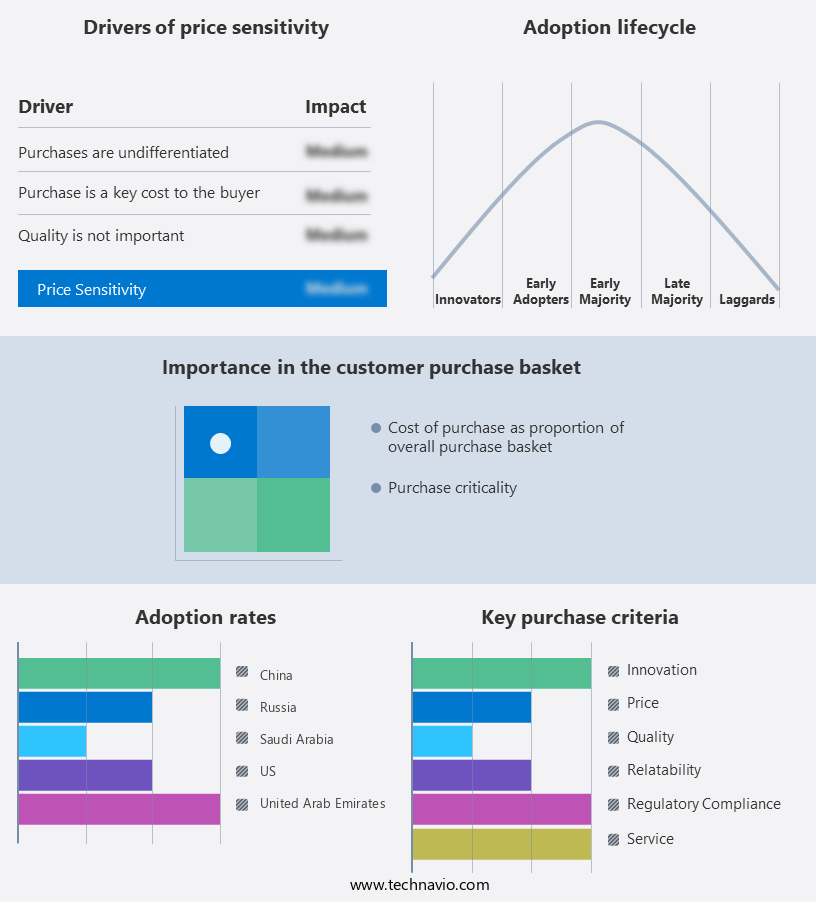
Offshore Drilling Market Share by Geography

 Customer Landscape

Key Companies & Market Insights

Companies are implementing various strategies, such as strategic alliances, offshore drilling market forecast, partnerships, mergers and acquisitions, geographical expansion, and product/service launches, to enhance their presence In the industry.

The industry research and growth report includes detailed analyses of the competitive landscape of the market and information about key companies, including:

  • AP Moller Maersk AS
  • Archer Ltd.
  • Baker Hughes Co.
  • China National Offshore Oil Corp.
  • Eni SpA
  • Halliburton Co.
  • Hercules Offshore Inc.
  • KCA Deutag Alpha Ltd.
  • Loews Corp.
  • Nabors Industries Ltd.
  • Noble Corp. Plc
  • Pacific Drilling Co.
  • Parker Drilling Co.
  • Saudi Arabian Oil Co.
  • Schlumberger Ltd.
  • Seadrill Ltd.
  • Sembcorp Marine Ltd.
  • Transocean Ltd.
  • Valaris Ltd.
  • Weatherford International Plc

Qualitative and quantitative analysis of companies has been conducted to help clients understand the wider business environment as well as the strengths and weaknesses of key industry players. Data is qualitatively analyzed to categorize companies as pure play, category-focused, industry-focused, and diversified; it is quantitatively analyzed to categorize companies as dominant, leading, strong, tentative, and weak.

Research Analyst Overview

The market is driven by the increasing demand for oil production from hydrocarbon exploration in both deepwater and shallow water resources. Automation and drillships technology play a significant role in reducing energy consumption and enhancing efficiency in offshore drilling operations. The market is also influenced by the exploration contracts awarded by global energy sources for hydrocarbon exploration in various regions. Deepwater resource development is a key trend In the offshore drilling industry, with drillships being used to extract oil and natural gas from the ocean floor in ultra-deepwater areas. Controlled pressure drilling, directed drilling, and robotics are some of the advanced technologies used in offshore drilling to ensure compliance with environmental regulations and minimize fuel consumption.

Financial incentives such as tax breaks, grants, and subsidies from domestic industries and governments are crucial for the growth of the market. However, the market faces challenges such as rising oil prices, environmental implications, and compliance monitoring. The increasing demand for renewable energy sources and the shift towards greenhouse gas emissions reduction may also impact the market In the future. The offshore drilling industry also has implications for the marine ecosystem, with concerns over seismic blasting and carbon emissions. The petrochemical industry and the oil supply chain are significant consumers of oil and gas produced through offshore drilling, contributing to the industry's overall impact on climate change. The use of artificial intelligence and advanced drilling technologies such as semi-submersibles is expected to further optimize offshore drilling operations.

Market Scope

Report Coverage

Details

Page number

175

Base year

2023

Historic period

2018-2022

Forecast period

2024-2028

Growth momentum & CAGR

Accelerate at a CAGR of 4.42%

Market growth 2024-2028

USD 8.18 billion

Market structure

Fragmented

YoY growth 2023-2024(%)

4.3

Key countries

US, Saudi Arabia, United Arab Emirates, China, and Russia

Competitive landscape

Leading Companies, Market Positioning of Companies, Competitive Strategies, and Industry Risks

Request Free Sample

What are the Key Data Covered in thisMarket Research and Growth Report?

  • CAGR of the industry during the forecast period
  • Detailed information on factors that will drive the market growth and forecasting between 2024 and 2028
  • Precise estimation of the size of the market and its contribution of the industry in focus to the parent market
  • Accurate predictions about upcoming growth and trends and changes in consumer behaviour
  • Growth of the market across North America, Middle East and Africa, Europe, APAC, and South America
  • Thorough analysis of the market’s competitive landscape and detailed information about companies
  • Comprehensive analysis of factors that will challenge the market growth of industry companies

We can help! Our analysts can customize this market research report to meet your requirements.

Get in touch

1 Executive Summary

  • 1.1 Market overview
    • Exhibit 01: Executive Summary – Chart on Market Overview
    • Exhibit 02: Executive Summary – Data Table on Market Overview
    • Exhibit 03: Executive Summary – Chart on Global Market Characteristics
    • Exhibit 04: Executive Summary – Chart on Market by Geography
    • Exhibit 05: Executive Summary – Chart on Market Segmentation by Application
    • Exhibit 06: Executive Summary – Chart on Market Segmentation by Type
    • Exhibit 07: Executive Summary – Chart on Incremental Growth
    • Exhibit 08: Executive Summary – Data Table on Incremental Growth
    • Exhibit 09: Executive Summary – Chart on Vendor Market Positioning

2 Market Landscape

  • 2.1 Market ecosystem
    • Exhibit 10: Parent market
    • Exhibit 11: Market Characteristics

3 Market Sizing

  • 3.1 Market definition
    • Exhibit 12: Offerings of vendors included in the market definition
  • 3.2 Market segment analysis
    • Exhibit 13: Market segments
  • 3.3 Market size 2023
    • 3.4 Market outlook: Forecast for 2023-2028
      • Exhibit 14: Chart on Global - Market size and forecast 2023-2028 ($ billion)
      • Exhibit 15: Data Table on Global - Market size and forecast 2023-2028 ($ billion)
      • Exhibit 16: Chart on Global Market: Year-over-year growth 2023-2028 (%)
      • Exhibit 17: Data Table on Global Market: Year-over-year growth 2023-2028 (%)

    4 Historic Market Size

    • 4.1 Global offshore drilling market 2018 - 2022
      • Exhibit 18: Historic Market Size – Data Table on global offshore drilling market 2018 - 2022 ($ billion)
    • 4.2 Application Segment Analysis 2018 - 2022
      • Exhibit 19: Historic Market Size – Application Segment 2018 - 2022 ($ billion)
    • 4.3 Type Segment Analysis 2018 - 2022
      • Exhibit 20: Historic Market Size – Type Segment 2018 - 2022 ($ billion)
    • 4.4 Geography Segment Analysis 2018 - 2022
      • Exhibit 21: Historic Market Size – Geography Segment 2018 - 2022 ($ billion)
    • 4.5 Country Segment Analysis 2018 - 2022
      • Exhibit 22: Historic Market Size – Country Segment 2018 - 2022 ($ billion)

    5 Five Forces Analysis

    • 5.1 Five forces summary
      • Exhibit 23: Five forces analysis - Comparison between 2023 and 2028
    • 5.2 Bargaining power of buyers
      • Exhibit 24: Chart on Bargaining power of buyers – Impact of key factors 2023 and 2028
    • 5.3 Bargaining power of suppliers
      • Exhibit 25: Bargaining power of suppliers – Impact of key factors in 2023 and 2028
    • 5.4 Threat of new entrants
      • Exhibit 26: Threat of new entrants – Impact of key factors in 2023 and 2028
    • 5.5 Threat of substitutes
      • Exhibit 27: Threat of substitutes – Impact of key factors in 2023 and 2028
    • 5.6 Threat of rivalry
      • Exhibit 28: Threat of rivalry – Impact of key factors in 2023 and 2028
    • 5.7 Market condition
      • Exhibit 29: Chart on Market condition - Five forces 2023 and 2028

    6 Market Segmentation by Application

    • 6.1 Market segments
      • Exhibit 30: Chart on Application - Market share 2023-2028 (%)
      • Exhibit 31: Data Table on Application - Market share 2023-2028 (%)
    • 6.2 Comparison by Application
      • Exhibit 32: Chart on Comparison by Application
      • Exhibit 33: Data Table on Comparison by Application
    • 6.3 Shallow water - Market size and forecast 2023-2028
      • Exhibit 34: Chart on Shallow water - Market size and forecast 2023-2028 ($ billion)
      • Exhibit 35: Data Table on Shallow water - Market size and forecast 2023-2028 ($ billion)
      • Exhibit 36: Chart on Shallow water - Year-over-year growth 2023-2028 (%)
      • Exhibit 37: Data Table on Shallow water - Year-over-year growth 2023-2028 (%)
    • 6.4 Deepwater - Market size and forecast 2023-2028
      • Exhibit 38: Chart on Deepwater - Market size and forecast 2023-2028 ($ billion)
      • Exhibit 39: Data Table on Deepwater - Market size and forecast 2023-2028 ($ billion)
      • Exhibit 40: Chart on Deepwater - Year-over-year growth 2023-2028 (%)
      • Exhibit 41: Data Table on Deepwater - Year-over-year growth 2023-2028 (%)
    • 6.5 Ultra deepwater - Market size and forecast 2023-2028
      • Exhibit 42: Chart on Ultra deepwater - Market size and forecast 2023-2028 ($ billion)
      • Exhibit 43: Data Table on Ultra deepwater - Market size and forecast 2023-2028 ($ billion)
      • Exhibit 44: Chart on Ultra deepwater - Year-over-year growth 2023-2028 (%)
      • Exhibit 45: Data Table on Ultra deepwater - Year-over-year growth 2023-2028 (%)
    • 6.6 Market opportunity by Application
      • Exhibit 46: Market opportunity by Application ($ billion)
      • Exhibit 47: Data Table on Market opportunity by Application ($ billion)

    7 Market Segmentation by Type

    • 7.1 Market segments
      • Exhibit 48: Chart on Type - Market share 2023-2028 (%)
      • Exhibit 49: Data Table on Type - Market share 2023-2028 (%)
    • 7.2 Comparison by Type
      • Exhibit 50: Chart on Comparison by Type
      • Exhibit 51: Data Table on Comparison by Type
    • 7.3 Jack up rigs - Market size and forecast 2023-2028
      • Exhibit 52: Chart on Jack up rigs - Market size and forecast 2023-2028 ($ billion)
      • Exhibit 53: Data Table on Jack up rigs - Market size and forecast 2023-2028 ($ billion)
      • Exhibit 54: Chart on Jack up rigs - Year-over-year growth 2023-2028 (%)
      • Exhibit 55: Data Table on Jack up rigs - Year-over-year growth 2023-2028 (%)
    • 7.4 Semisubmersibles - Market size and forecast 2023-2028
      • Exhibit 56: Chart on Semisubmersibles - Market size and forecast 2023-2028 ($ billion)
      • Exhibit 57: Data Table on Semisubmersibles - Market size and forecast 2023-2028 ($ billion)
      • Exhibit 58: Chart on Semisubmersibles - Year-over-year growth 2023-2028 (%)
      • Exhibit 59: Data Table on Semisubmersibles - Year-over-year growth 2023-2028 (%)
    • 7.5 Drill ships - Market size and forecast 2023-2028
      • Exhibit 60: Chart on Drill ships - Market size and forecast 2023-2028 ($ billion)
      • Exhibit 61: Data Table on Drill ships - Market size and forecast 2023-2028 ($ billion)
      • Exhibit 62: Chart on Drill ships - Year-over-year growth 2023-2028 (%)
      • Exhibit 63: Data Table on Drill ships - Year-over-year growth 2023-2028 (%)
    • 7.6 Others - Market size and forecast 2023-2028
      • Exhibit 64: Chart on Others - Market size and forecast 2023-2028 ($ billion)
      • Exhibit 65: Data Table on Others - Market size and forecast 2023-2028 ($ billion)
      • Exhibit 66: Chart on Others - Year-over-year growth 2023-2028 (%)
      • Exhibit 67: Data Table on Others - Year-over-year growth 2023-2028 (%)
    • 7.7 Market opportunity by Type
      • Exhibit 68: Market opportunity by Type ($ billion)
      • Exhibit 69: Data Table on Market opportunity by Type ($ billion)

    8 Customer Landscape

    • 8.1 Customer landscape overview
      • Exhibit 70: Analysis of price sensitivity, lifecycle, customer purchase basket, adoption rates, and purchase criteria

    9 Geographic Landscape

    • 9.1 Geographic segmentation
      • Exhibit 71: Chart on Market share by geography 2023-2028 (%)
      • Exhibit 72: Data Table on Market share by geography 2023-2028 (%)
    • 9.2 Geographic comparison
      • Exhibit 73: Chart on Geographic comparison
      • Exhibit 74: Data Table on Geographic comparison
    • 9.3 North America - Market size and forecast 2023-2028
      • Exhibit 75: Chart on North America - Market size and forecast 2023-2028 ($ billion)
      • Exhibit 76: Data Table on North America - Market size and forecast 2023-2028 ($ billion)
      • Exhibit 77: Chart on North America - Year-over-year growth 2023-2028 (%)
      • Exhibit 78: Data Table on North America - Year-over-year growth 2023-2028 (%)
    • 9.4 Middle East and Africa - Market size and forecast 2023-2028
      • Exhibit 79: Chart on Middle East and Africa - Market size and forecast 2023-2028 ($ billion)
      • Exhibit 80: Data Table on Middle East and Africa - Market size and forecast 2023-2028 ($ billion)
      • Exhibit 81: Chart on Middle East and Africa - Year-over-year growth 2023-2028 (%)
      • Exhibit 82: Data Table on Middle East and Africa - Year-over-year growth 2023-2028 (%)
    • 9.5 Europe - Market size and forecast 2023-2028
      • Exhibit 83: Chart on Europe - Market size and forecast 2023-2028 ($ billion)
      • Exhibit 84: Data Table on Europe - Market size and forecast 2023-2028 ($ billion)
      • Exhibit 85: Chart on Europe - Year-over-year growth 2023-2028 (%)
      • Exhibit 86: Data Table on Europe - Year-over-year growth 2023-2028 (%)
    • 9.6 APAC - Market size and forecast 2023-2028
      • Exhibit 87: Chart on APAC - Market size and forecast 2023-2028 ($ billion)
      • Exhibit 88: Data Table on APAC - Market size and forecast 2023-2028 ($ billion)
      • Exhibit 89: Chart on APAC - Year-over-year growth 2023-2028 (%)
      • Exhibit 90: Data Table on APAC - Year-over-year growth 2023-2028 (%)
    • 9.7 South America - Market size and forecast 2023-2028
      • Exhibit 91: Chart on South America - Market size and forecast 2023-2028 ($ billion)
      • Exhibit 92: Data Table on South America - Market size and forecast 2023-2028 ($ billion)
      • Exhibit 93: Chart on South America - Year-over-year growth 2023-2028 (%)
      • Exhibit 94: Data Table on South America - Year-over-year growth 2023-2028 (%)
    • 9.8 US - Market size and forecast 2023-2028
      • Exhibit 95: Chart on US - Market size and forecast 2023-2028 ($ billion)
      • Exhibit 96: Data Table on US - Market size and forecast 2023-2028 ($ billion)
      • Exhibit 97: Chart on US - Year-over-year growth 2023-2028 (%)
      • Exhibit 98: Data Table on US - Year-over-year growth 2023-2028 (%)
    • 9.9 Saudi Arabia - Market size and forecast 2023-2028
      • Exhibit 99: Chart on Saudi Arabia - Market size and forecast 2023-2028 ($ billion)
      • Exhibit 100: Data Table on Saudi Arabia - Market size and forecast 2023-2028 ($ billion)
      • Exhibit 101: Chart on Saudi Arabia - Year-over-year growth 2023-2028 (%)
      • Exhibit 102: Data Table on Saudi Arabia - Year-over-year growth 2023-2028 (%)
    • 9.10 Russia - Market size and forecast 2023-2028
      • Exhibit 103: Chart on Russia - Market size and forecast 2023-2028 ($ billion)
      • Exhibit 104: Data Table on Russia - Market size and forecast 2023-2028 ($ billion)
      • Exhibit 105: Chart on Russia - Year-over-year growth 2023-2028 (%)
      • Exhibit 106: Data Table on Russia - Year-over-year growth 2023-2028 (%)
    • 9.11 China - Market size and forecast 2023-2028
      • Exhibit 107: Chart on China - Market size and forecast 2023-2028 ($ billion)
      • Exhibit 108: Data Table on China - Market size and forecast 2023-2028 ($ billion)
      • Exhibit 109: Chart on China - Year-over-year growth 2023-2028 (%)
      • Exhibit 110: Data Table on China - Year-over-year growth 2023-2028 (%)
    • 9.12 United Arab Emirates - Market size and forecast 2023-2028
      • Exhibit 111: Chart on United Arab Emirates - Market size and forecast 2023-2028 ($ billion)
      • Exhibit 112: Data Table on United Arab Emirates - Market size and forecast 2023-2028 ($ billion)
      • Exhibit 113: Chart on United Arab Emirates - Year-over-year growth 2023-2028 (%)
      • Exhibit 114: Data Table on United Arab Emirates - Year-over-year growth 2023-2028 (%)
    • 9.13 Market opportunity by geography
      • Exhibit 115: Market opportunity by geography ($ billion)
      • Exhibit 116: Data Tables on Market opportunity by geography ($ billion)

    10 Drivers, Challenges, and Trends

    • 10.1 Market drivers
      • 10.2 Market challenges
        • 10.3 Impact of drivers and challenges
          • Exhibit 117: Impact of drivers and challenges in 2023 and 2028
        • 10.4 Market trends

          11 Vendor Landscape

          • 11.1 Overview
            • 11.2 Vendor landscape
              • Exhibit 118: Overview on Criticality of inputs and Factors of differentiation
            • 11.3 Landscape disruption
              • Exhibit 119: Overview on factors of disruption
            • 11.4 Industry risks
              • Exhibit 120: Impact of key risks on business

            12 Vendor Analysis

            • 12.1 Vendors covered
              • Exhibit 121: Vendors covered
            • 12.2 Market positioning of vendors
              • Exhibit 122: Matrix on vendor position and classification
            • 12.3 Archer Ltd.
              • Exhibit 123: Archer Ltd. - Overview
              • Exhibit 124: Archer Ltd. - Business segments
              • Exhibit 125: Archer Ltd. - Key offerings
              • Exhibit 126: Archer Ltd. - Segment focus
            • 12.4 Baker Hughes Co.
              • Exhibit 127: Baker Hughes Co. - Overview
              • Exhibit 128: Baker Hughes Co. - Business segments
              • Exhibit 129: Baker Hughes Co. - Key news
              • Exhibit 130: Baker Hughes Co. - Key offerings
              • Exhibit 131: Baker Hughes Co. - Segment focus
            • 12.5 China National Offshore Oil Corp.
              • Exhibit 132: China National Offshore Oil Corp. - Overview
              • Exhibit 133: China National Offshore Oil Corp. - Business segments
              • Exhibit 134: China National Offshore Oil Corp. - Key offerings
              • Exhibit 135: China National Offshore Oil Corp. - Segment focus
            • 12.6 Eni SpA
              • Exhibit 136: Eni SpA - Overview
              • Exhibit 137: Eni SpA - Business segments
              • Exhibit 138: Eni SpA - Key offerings
              • Exhibit 139: Eni SpA - Segment focus
            • 12.7 Halliburton Co.
              • Exhibit 140: Halliburton Co. - Overview
              • Exhibit 141: Halliburton Co. - Business segments
              • Exhibit 142: Halliburton Co. - Key news
              • Exhibit 143: Halliburton Co. - Key offerings
              • Exhibit 144: Halliburton Co. - Segment focus
            • 12.8 Hercules Offshore Inc.
              • Exhibit 145: Hercules Offshore Inc. - Overview
              • Exhibit 146: Hercules Offshore Inc. - Product / Service
              • Exhibit 147: Hercules Offshore Inc. - Key offerings
            • 12.9 Nabors Industries Ltd.
              • Exhibit 148: Nabors Industries Ltd. - Overview
              • Exhibit 149: Nabors Industries Ltd. - Business segments
              • Exhibit 150: Nabors Industries Ltd. - Key news
              • Exhibit 151: Nabors Industries Ltd. - Key offerings
              • Exhibit 152: Nabors Industries Ltd. - Segment focus
            • 12.10 Noble Corp. Plc
              • Exhibit 153: Noble Corp. Plc - Overview
              • Exhibit 154: Noble Corp. Plc - Business segments
              • Exhibit 155: Noble Corp. Plc - Key news
              • Exhibit 156: Noble Corp. Plc - Key offerings
              • Exhibit 157: Noble Corp. Plc - Segment focus
            • 12.11 Pacific Drilling Co.
              • Exhibit 158: Pacific Drilling Co. - Overview
              • Exhibit 159: Pacific Drilling Co. - Product / Service
              • Exhibit 160: Pacific Drilling Co. - Key offerings
            • 12.12 Parker Drilling Co.
              • Exhibit 161: Parker Drilling Co. - Overview
              • Exhibit 162: Parker Drilling Co. - Product / Service
              • Exhibit 163: Parker Drilling Co. - Key offerings
            • 12.13 Saudi Arabian Oil Co.
              • Exhibit 164: Saudi Arabian Oil Co. - Overview
              • Exhibit 165: Saudi Arabian Oil Co. - Product / Service
              • Exhibit 166: Saudi Arabian Oil Co. - Key offerings
            • 12.14 Seadrill Ltd.
              • Exhibit 167: Seadrill Ltd. - Overview
              • Exhibit 168: Seadrill Ltd. - Business segments
              • Exhibit 169: Seadrill Ltd. - Key offerings
              • Exhibit 170: Seadrill Ltd. - Segment focus
            • 12.15 Transocean Ltd.
              • Exhibit 171: Transocean Ltd. - Overview
              • Exhibit 172: Transocean Ltd. - Product / Service
              • Exhibit 173: Transocean Ltd. - Key offerings
            • 12.16 Valaris Ltd.
              • Exhibit 174: Valaris Ltd. - Overview
              • Exhibit 175: Valaris Ltd. - Business segments
              • Exhibit 176: Valaris Ltd. - Key offerings
              • Exhibit 177: Valaris Ltd. - Segment focus
            • 12.17 Weatherford International Plc
              • Exhibit 178: Weatherford International Plc - Overview
              • Exhibit 179: Weatherford International Plc - Business segments
              • Exhibit 180: Weatherford International Plc - Key news
              • Exhibit 181: Weatherford International Plc - Key offerings
              • Exhibit 182: Weatherford International Plc - Segment focus

            13 Appendix

            • 13.1 Scope of the report
              • 13.2 Inclusions and exclusions checklist
                • Exhibit 183: Inclusions checklist
                • Exhibit 184: Exclusions checklist
              • 13.3 Currency conversion rates for US$
                • Exhibit 185: Currency conversion rates for US$
              • 13.4 Research methodology
                • Exhibit 186: Research methodology
                • Exhibit 187: Validation techniques employed for market sizing
                • Exhibit 188: Information sources
              • 13.5 List of abbreviations
                • Exhibit 189: List of abbreviations

              Research Methodology

              Technavio presents a detailed picture of the market by way of study, synthesis, and summation of data from multiple sources. The analysts have presented the various facets of the market with a particular focus on identifying the key industry influencers. The data thus presented is comprehensive, reliable, and the result of extensive research, both primary and secondary.

              INFORMATION SOURCES

              Primary sources

              • Manufacturers and suppliers
              • Channel partners
              • Industry experts
              • Strategic decision makers

              Secondary sources

              • Industry journals and periodicals
              • Government data
              • Financial reports of key industry players
              • Historical data
              • Press releases

              DATA ANALYSIS

              Data Synthesis

              • Collation of data
              • Estimation of key figures
              • Analysis of derived insights

              Data Validation

              • Triangulation with data models
              • Reference against proprietary databases
              • Corroboration with industry experts

              REPORT WRITING

              Qualitative

              • Market drivers
              • Market challenges
              • Market trends
              • Five forces analysis

              Quantitative

              • Market size and forecast
              • Market segmentation
              • Geographical insights
              • Competitive landscape

              Interested in this report?

              Get your sample now to see our research methodology and insights!

              Download Now

              Frequently Asked Questions

              Offshore Drilling market growth will increase by $ 8.18 bn during 2024-2028.

              The Offshore Drilling market is expected to grow at a CAGR of 4.42% during 2024-2028.

              Offshore Drilling market is segmented by Application( Shallow water, Deepwater, Ultra deepwater) Type( Jack up rigs, Semisubmersibles, Drill ships, Others, South America)

              AP Moller Maersk AS, Archer Ltd., Baker Hughes Co., China National Offshore Oil Corp., Eni SpA, Halliburton Co., Hercules Offshore Inc., KCA Deutag Alpha Ltd., Loews Corp., Nabors Industries Ltd., Noble Corp. Plc, Pacific Drilling Co., Parker Drilling Co., Saudi Arabian Oil Co., Schlumberger Ltd., Seadrill Ltd., Sembcorp Marine Ltd., Transocean Ltd., Valaris Ltd., Weatherford International Plc are a few of the key vendors in the Offshore Drilling market.

              North America will register the highest growth rate of 40% among the other regions. Therefore, the Offshore Drilling market in North America is expected to garner significant business opportunities for the vendors during the forecast period.

              US, Saudi Arabia, United Arab Emirates, China, Russia

              • Growth in demand for oil and natural gasAccording to the US Energy Information Administration is the driving factor this market.
              • global liquid fuel consumption is expected to reach 101.1 mbpd by the fourth quarter of 2021 is the driving factor this market.
              • which was 100.08 mbpd in 2018 and 96.94 mbpd in 2016. It is expected to grow moderately during 2016-2021 due to the increase in the global demand for oil and gas and is expected to grow at a high rate during the forecast period. As the demand for oil and gas is increasing is the driving factor this market.
              • there is a need to explore and produce new oil and gas reservoirs. Existing reservoirs have started to mature or have been depleted. This has resulted in the drilling of new wells. Therefore is the driving factor this market.
              • new oil and gas wells are being drilled in countries that have not been major producers. Companies are also moving towards offshore E and P activities since offshore reservoirs for oil and gas are greater than onshore reservoirs and because offshore wells have longer production lives than onshore wells. In the previous decade is the driving factor this market.
              • the global consumption of natural gas exhibited a significant rise due to the increasing adoption of natural gas as a fuel. Also is the driving factor this market.
              • with the rise in fuel consumption from developing economies such as China and India is the driving factor this market.
              • the demand for natural gas is expected to propel during the forecast period. According to the IEA is the driving factor this market.
              • the demand for oil will continue to grow till 2040 is the driving factor this market.
              • and the use of natural gas will rise by 45% in 2040 compared with the demand in 2017 is the driving factor this market.
              • with a high scope for expansion in the power sector. The rise in E and P of oil and gas will be fueled by the growing demand for these resources. Even though producing gas and oil offshore involves significant expenses is the driving factor this market.
              • offshore well reserves are greater than those in onshore wells. Upstream companies are likely to exploit and produce oil and gas from these vast reserves. Thus is the driving factor this market.
              • the rise in demand for oil and gas will increase drilling activities in offshore locations is the driving factor this market.
              • thereby driving the global offshore drilling market. is the driving factor this market.

              The Offshore Drilling market vendors should focus on grabbing business opportunities from the Shallow water segment as it accounted for the largest market share in the base year.