Grain Handling Market Size and Growth Forecast 2026-2030
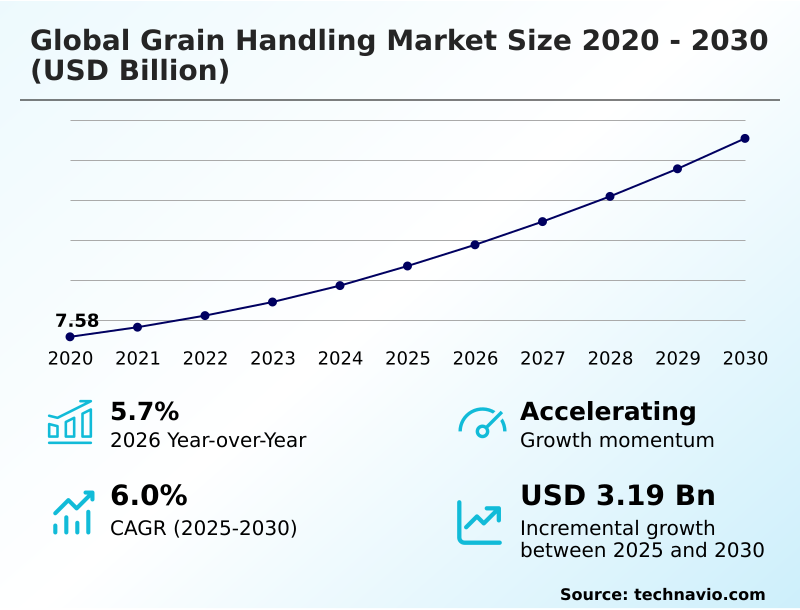
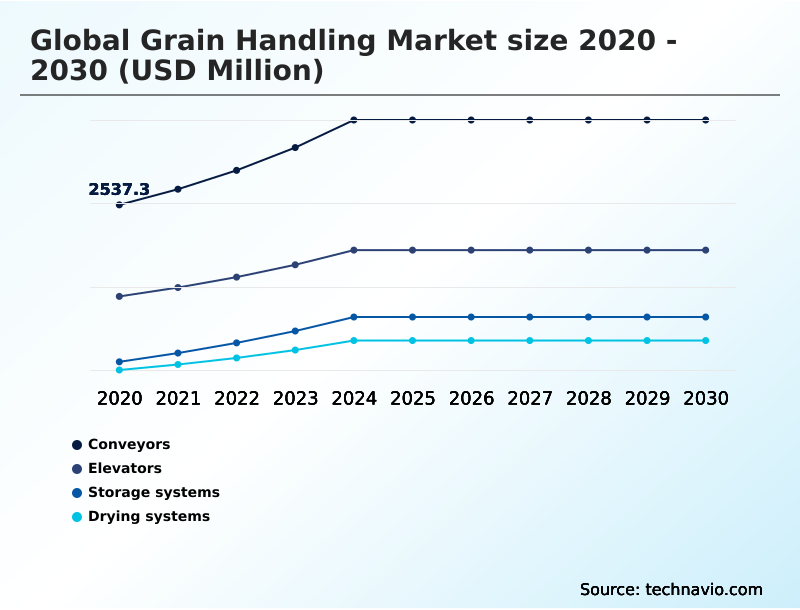
The Grain Handling Market size was valued at USD 9.35 billion in 2025 growing at a CAGR of 6% during the forecast period 2026-2030.
APAC accounts for 42.8% of incremental growth during the forecast period. The Conveyors segment by Product was valued at USD 3.06 billion in 2024, while the Farmers segment holds the largest revenue share by End-user.
The market is projected to grow by USD 4.96 billion from 2020 to 2030, with USD 3.19 billion of the growth expected during the forecast period of 2025 to 2030.
Get Key Insights on Market Forecast (PDF) Request Free Sample
Grain Handling Market Overview
The grain handling market is advancing beyond simple bulk material management, driven by the imperative to reduce significant post-harvest losses and enhance food security infrastructure. The integration of turnkey handling solutions is becoming standard as operators seek to improve operational efficiency from harvest to export. This involves deploying sophisticated material handling equipment like bucket elevators and drag conveyors within new agricultural infrastructure. For instance, a major port terminal upgrading its export facilities with new high-capacity ship loaders and integrated belt conveyors can reduce vessel loading times by over 30%, directly impacting supply chain logistics and profitability. This modernization is crucial in regions like APAC, which account for over 42% of the market's incremental growth. The industry's 5.7% year-over-year growth is a testament to the escalating investment in technologies that ensure commodity quality preservation and operational resilience.
Drivers, Trends, and Challenges in the Grain Handling Market
Strategic procurement in the grain handling market is increasingly influenced by the total cost of ownership, especially concerning energy-intensive processes. For example, facilities are now evaluating the long-term ROI on farm grain storage bins and the operational savings from installing energy-efficient grain drying systems.
A modern farm operation implementing portable grain conveyors for farm operations can see a significant reduction in labor costs and loading times compared to legacy auger systems. Compliance with regulations like the EU's Machinery Directive (2006/42/EC) is also shaping equipment design, compelling manufacturers to integrate advanced safety features.
As a result, investment in IIoT sensors for predictive maintenance in conveyors is becoming standard, as it allows for proactive management of asset integrity. Decisions on the cost of ownership for steel vs concrete silos are also being re-evaluated, with life-cycle maintenance costs now a primary consideration.
The focus on automated grain handling for commercial elevators and mitigating dust explosion in grain silos reflects a dual push toward greater efficiency and stricter safety adherence, shaping capital budgets and vendor selection criteria.
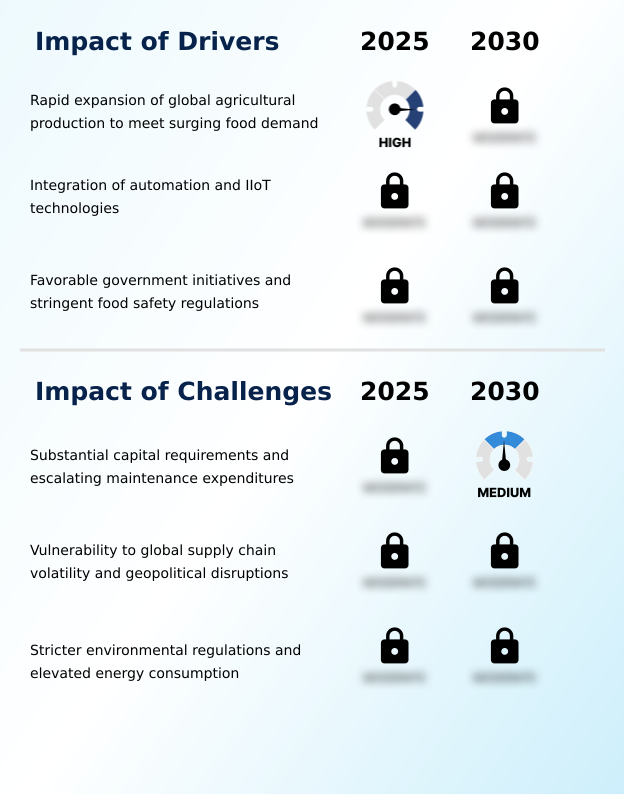
Primary Growth Driver: The rapid expansion of global agricultural production, necessitated by a surging worldwide demand for food, serves as a primary driver for the grain handling market.
Market growth is fundamentally propelled by the global imperative to bolster food security infrastructure and integrate digital technology into agriculture. The rapid expansion of agricultural production to feed a growing population necessitates advanced material handling equipment to minimize post-harvest losses.
The proliferation of automation, including IIoT-enabled predictive maintenance and centralized command centers for bin management software, significantly improves operational efficiency and reduces labor costs.
Furthermore, favorable government initiatives and stringent food safety regulations, which mandate features like mycotoxin contamination prevention and traceability, compel operators to upgrade from legacy systems to modern, compliant turnkey handling solutions, thereby sustaining demand for new equipment installations.
Emerging Market Trend: The global grain handling market is observing a significant shift toward modular and portable solutions. This trend is a direct response to the need for greater operational flexibility amid unpredictable harvest locations and fluctuating crop yields.
Key market trends are centered on enhancing operational flexibility and safety. The rising demand for modular and portable grain handling solutions allows operators to adapt to shifting production volumes and locations, optimizing capital expenditure.
Concurrently, a heightened focus on safety is driving the adoption of advanced dust control systems and explosion mitigation technologies, which are critical for compliance with standards such as NFPA 61 for agricultural facilities. The integration of pneumatic filters and enclosed belt conveyors helps manage fugitive dust emissions.
This trend is complemented by a move toward energy-efficient operations, with facilities installing heat recovery systems in dryers and adopting renewable power sources, reflecting a broader industry commitment to sustainability and reduced operating costs.
Key Industry Challenge: Substantial capital requirements for initial equipment procurement and escalating operational expenditures for maintenance represent a key challenge constraining market growth.
The market's primary challenges are financial and logistical, constraining the widespread adoption of modern technology. The substantial capital expenditure required for state-of-the-art agricultural infrastructure, from grain storage silos to bucket elevators, remains a significant barrier for many operators. These initial costs are compounded by escalating maintenance expenditures needed for asset integrity management in harsh operating environments.
Furthermore, the industry's reliance on global supply chains makes it vulnerable to disruptions affecting raw materials like steel and electronic components, leading to price volatility and project delays. Stricter environmental regulations governing energy consumption and fugitive dust emissions further inflate the total cost of ownership, complicating investment decisions for new projects.
Explore Full Market Dynamics Analysis Request Free Sample
Grain Handling Market Segmentation
The grain handling industry research report provides comprehensive data including region-wise segment analysis, with forecasts and analysis for the period 2026-2030, as well as historical data from 2020-2024 for the following segments.
Product Segment Analysis
The conveyors segment is estimated to witness significant growth during the forecast period.
Conveyors represent the vital circulatory system within grain handling, forming the largest product segment. These systems, encompassing belt conveyors, drag conveyors, and screw conveyors, are critical for the horizontal and inclined transfer of bulk commodities.
The push to minimize post-harvest losses and maintain commodity quality drives investment in gentle handling belt conveyors, which are essential for preventing kernel damage.
Enclosed drag conveyors are prioritized for their role in dust containment, a key safety requirement under OSHA guidelines for mitigating combustible dust hazards.
The segment's significant contribution to the market, accounting for over a third of product-related revenue, underscores its foundational role in overall operational efficiency and throughput capacity for any agricultural infrastructure.
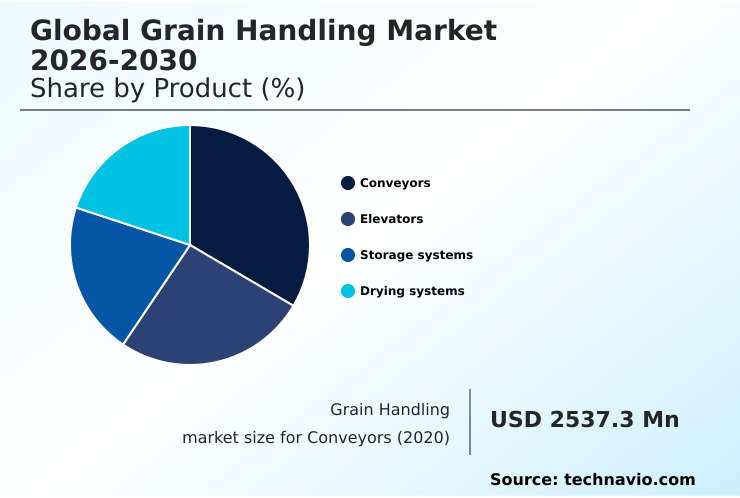
The Conveyors segment was valued at USD 3.06 billion in 2024 and showed a gradual increase during the forecast period.
Grain Handling Market by Region: APAC Leads with 42.8% Growth Share
APAC is estimated to contribute 42.8% to the growth of the global market during the forecast period.
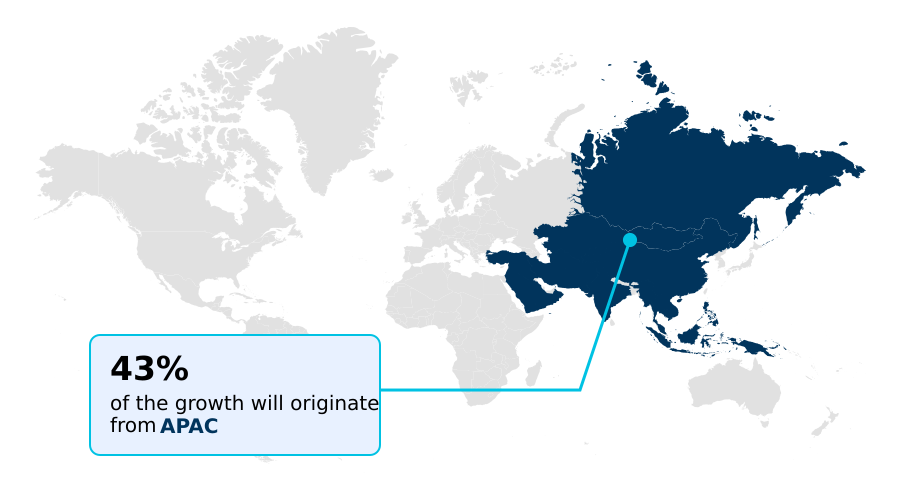
The geographic landscape of the grain handling market is dominated by APAC, which commands nearly 43% of the incremental growth, driven by aggressive government-led initiatives to build out food security infrastructure and reduce post-harvest losses.
In contrast, the mature North America market, accounting for approximately 23% of global opportunity, focuses on upgrading its existing agricultural infrastructure with automation and predictive maintenance technologies to improve operational efficiency.
At a typical inland terminal in the US, retrofitting existing galvanized steel silos with advanced temperature monitoring cables and aeration systems is a common capital expenditure aimed at enhancing commodity quality preservation.
This regional divergence highlights a global market characterized by modernization in developed regions and foundational capacity-building in emerging economies, with all regions prioritizing supply chain logistics.
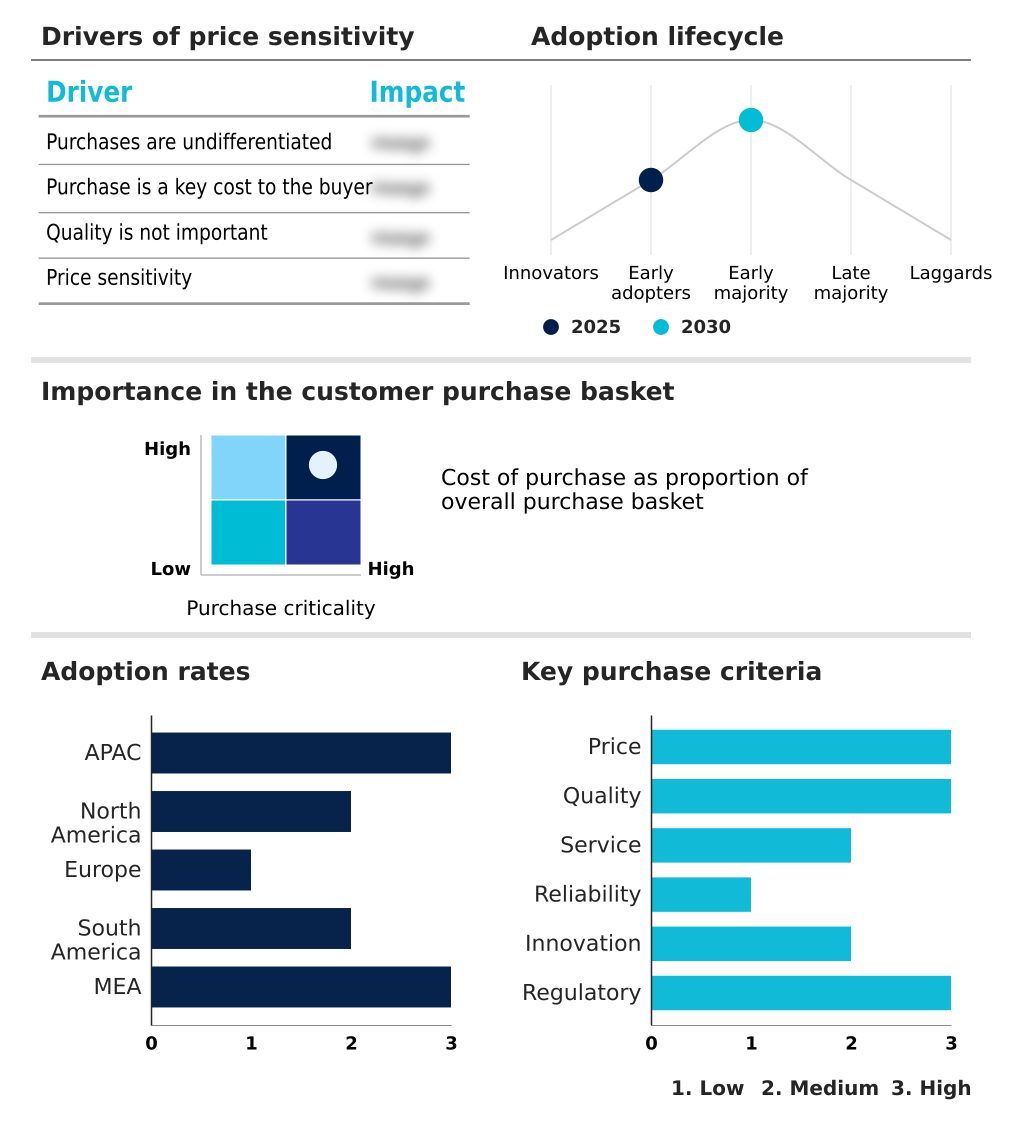
Customer Landscape Analysis for the Grain Handling Market
The grain handling market forecasting report includes the adoption lifecycle of the market, covering from the innovator’s stage to the laggard’s stage. It focuses on adoption rates in different regions based on penetration. Furthermore, the grain handling market report also includes key purchase criteria and drivers of price sensitivity to help companies evaluate and develop their market growth analysis strategies.
Competitive Landscape of the Grain Handling Market
Companies are implementing various strategies, such as strategic alliances, partnerships, mergers and acquisitions, geographical expansion, and product/service launches, to enhance their presence in the grain handling market industry.
Ag Growth International Inc. - Offerings are centered on integrated grain storage systems, including portable farm augers and commercial conveyors, engineered to improve on-farm and commercial handling efficiency.
The industry research and growth report includes detailed analyses of the competitive landscape of the market and information about key companies, including:
- Ag Growth International Inc.
- AGCO Corp.
- Bedeschi SpA
- Behlen Mfg Co.
- BROCK GRAIN SYSTEMS.
- Buhler AG
- Bunge Global SA
- Cargill Inc.
- Chief Agri Industrial Group
- COFCO Engineering
- Meridian Manufacturing Inc.
- Mysilo Grain Storage Systems
- PETKUS Technologie GmbH
- Satake Corp.
- Sioux Steel Co.
- Skandia Elevator
- Sukup Manufacturing Co.
- Sweet Material Handling.
- Symaga SA
- Tornum AB.
Qualitative and quantitative analysis of companies has been conducted to help clients understand the wider business environment as well as the strengths and weaknesses of key industry players. Data is qualitatively analyzed to categorize companies as pure play, category-focused, industry-focused, and diversified; it is quantitatively analyzed to categorize companies as dominant, leading, strong, tentative, and weak.
Recent Developments in the Grain Handling Market
- In September 2025, Bunge Global SA completed its acquisition of grain elevator assets from North West Terminal Ltd. in Saskatchewan, Canada, integrating a major inland facility equipped with advanced drying, cleaning, and vertical conveying systems.
- In October 2025, Delta Grain announced a $3.76 million investment to expand its Sidon operations, which includes a new ground pile and conveyance system designed to increase storage capacity by 2.15 million bushels.
- In November 2025, Ag Growth International launched its advanced FX4 SP and FX4 18S grain conveyor models, engineered for high-capacity transfer with throughputs of up to 10,500 bushels per hour.
- In June 2025, the Food Corporation of India commissioned a new 50,000-metric-tonne grain storage silo in Bihar, advancing its strategic move toward mechanized bulk storage to reduce post-harvest losses and improve storage efficiency.
Research Analyst Overview: Grain Handling Market
The grain handling market's evolution is now dictated by data-driven operational intelligence and stringent safety compliance. Boardroom decisions increasingly weigh the capital expenditure on advanced dust control systems and explosion mitigation technologies against the escalating costs of insurance and potential downtime from incidents governed by OSHA's Combustible Dust National Emphasis Program.
The deployment of automated sorting mechanisms, moisture sensing technologies, and predictive maintenance platforms is no longer a competitive advantage but a baseline requirement for maintaining asset integrity.
The choice between retrofitting existing corrugated steel silos and investing in new galvanized steel silos is now a complex calculation of structural longevity, energy consumption, and integration with modern aeration systems and temperature monitoring cables.
This highlights a market where long-term operational resilience and risk management are becoming more critical than initial procurement costs, fundamentally altering vendor qualification criteria and technology adoption roadmaps.
Dive into Technavio’s robust research methodology, blending expert interviews, extensive data synthesis, and validated models for unparalleled Grain Handling Market insights. See full methodology.
| Market Scope | |
|---|---|
| Page number | 311 |
| Base year | 2025 |
| Historic period | 2020-2024 |
| Forecast period | 2026-2030 |
| Growth momentum & CAGR | Accelerate at a CAGR of 6% |
| Market growth 2026-2030 | USD 3191.0 million |
| Market structure | Fragmented |
| YoY growth 2025-2026(%) | 5.7% |
| Key countries | China, India, Japan, Australia, South Korea, Indonesia, US, Canada, Mexico, Germany, France, UK, Italy, Spain, The Netherlands, Brazil, Argentina, Colombia, South Africa, Turkey, Saudi Arabia, UAE and Israel |
| Competitive landscape | Leading Companies, Market Positioning of Companies, Competitive Strategies, and Industry Risks |
Grain Handling Market: Key Questions Answered in This Report
-
What is the expected growth of the Grain Handling Market between 2026 and 2030?
-
The Grain Handling Market is expected to grow by USD 3.19 billion during 2026-2030, registering a CAGR of 6%. Year-over-year growth in 2026 is estimated at 5.7%%. This acceleration is shaped by rapid expansion of global agricultural production to meet surging food demand, which is intensifying demand across multiple end-use verticals covered in the report.
-
-
What segmentation does the market report cover?
-
The report is segmented by Product (Conveyors, Elevators, Storage systems, and Drying systems), End-user (Farmers, Processing plants, Grain trading companies, Port terminals, and Others), Application (Loading, Unloading, Storage, and Drying) and Geography (APAC, North America, Europe, South America, Middle East and Africa). Among these, the Conveyors segment is estimated to witness significant growth during the forecast period, driven by rising adoption across key application areas. Each segment includes detailed qualitative and quantitative analysis, along with historical data from 2020-2024 and forecasts through 2030 with year-over-year growth rates.
-
-
Which regions are analyzed in the report?
-
The report covers APAC, North America, Europe, South America and Middle East and Africa. APAC is estimated to contribute 42.8% to market growth during the forecast period. Country-level analysis includes China, India, Japan, Australia, South Korea, Indonesia, US, Canada, Mexico, Germany, France, UK, Italy, Spain, The Netherlands, Brazil, Argentina, Colombia, South Africa, Turkey, Saudi Arabia, UAE and Israel, with dedicated market size tables and year-over-year growth for each.
-
-
What are the key growth drivers and market challenges?
-
The primary driver is rapid expansion of global agricultural production to meet surging food demand, which is accelerating investment and industry demand. The main challenge is substantial capital requirements and escalating maintenance expenditures, creating operational barriers for key market participants. The report quantifies the impact of each driver and challenge across 2026 and 2030 with comparative analysis.
-
-
Who are the major players in the Grain Handling Market?
-
Key vendors include Ag Growth International Inc., AGCO Corp., Bedeschi SpA, Behlen Mfg Co., BROCK GRAIN SYSTEMS., Buhler AG, Bunge Global SA, Cargill Inc., Chief Agri Industrial Group, COFCO Engineering, Meridian Manufacturing Inc., Mysilo Grain Storage Systems, PETKUS Technologie GmbH, Satake Corp., Sioux Steel Co., Skandia Elevator, Sukup Manufacturing Co., Sweet Material Handling., Symaga SA and Tornum AB.. The report provides qualitative and quantitative analysis categorizing companies as dominant, leading, strong, tentative, and weak based on their market positioning. Company profiles include business segment analysis, SWOT assessment, key offerings, and recent strategic developments.
-
Grain Handling Market Research Insights
Market dynamics are increasingly shaped by the need for enhanced throughput capacity and asset integrity management across all end-user segments. While large-scale port terminals drive investment in heavy-duty infrastructure, the farmers segment, representing a substantially larger portion of the market, fuels demand for on-farm storage solutions and more efficient inventory management systems.
This shift reflects a broader strategy for commodity quality preservation, allowing individual producers to mitigate the risks of mycotoxin contamination prevention and optimize sale timings.
The focus on preventative maintenance schedules is now a critical component of capital expenditure planning, aiming to extend equipment life and ensure supply chain logistics remain uninterrupted during peak seasons, in compliance with standards like ISO 9001.
We can help! Our analysts can customize this grain handling market research report to meet your requirements.
 RIA -
RIA - 
