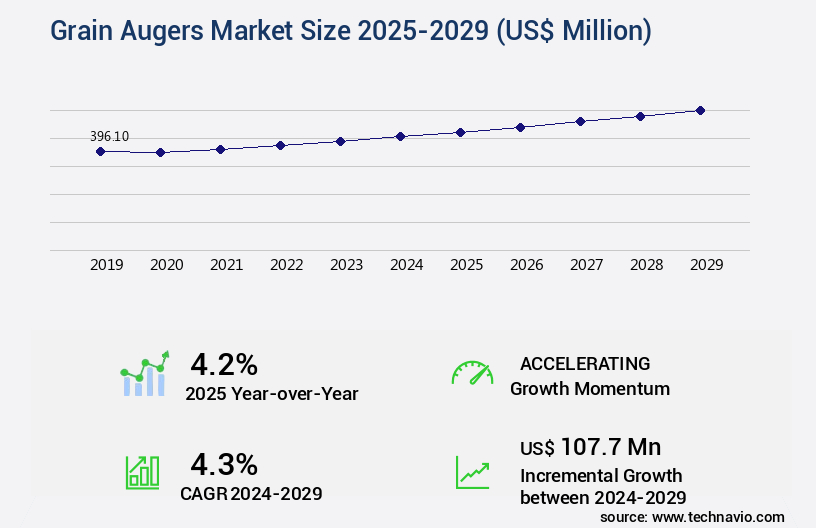
Grain Augers Market Size 2025-2029
The grain augers market size is valued to increase USD 107.7 million, at a CAGR of 4.3% from 2024 to 2029. Growing need for easy out-loading of grain will drive the grain augers market.
Major Market Trends & Insights
- APAC dominated the market and accounted for a 33% growth during the forecast period.
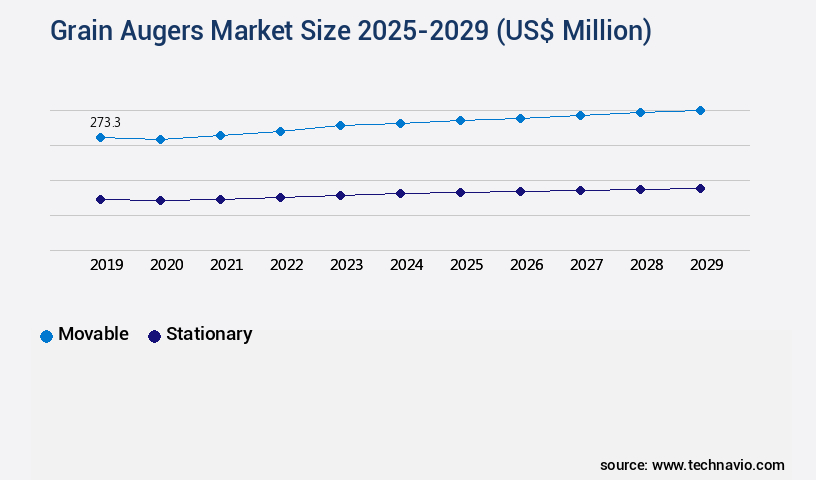
- By Product - Movable segment was valued at USD 273.30 million in 2023
- By End-user - Farm segment accounted for the largest market revenue share in 2023
Market Size & Forecast
- Market Opportunities: USD 41.91 million
- Market Future Opportunities: USD 107.70 million
- CAGR from 2024 to 2029 : 4.3%
Market Summary
- The market witnesses significant expansion due to the escalating demand for efficient and large-scale grain handling solutions. With the increasing global agricultural productivity, the need for streamlined grain transportation and storage systems has become paramount. Grain augers, as essential tools in this domain, facilitate the easy transfer of grain from one location to another, thereby enhancing productivity and reducing labor costs. Despite their benefits, grain augers present certain hazards, including grain entrapment and dust explosions, necessitating stringent safety measures. To cater to the varying requirements of farmers and grain processing industries, the market offers a wide range of auger types, sizes, and power sources.
- For instance, portable augers are popular among small-scale farmers, while larger, industrial augers serve the needs of grain processing facilities. As of 2022, the market is estimated to be valued at over USD 1.5 billion, according to industry reports. This growth can be attributed to the increasing availability of grain augers through rental services and the expanding agricultural sector in developing economies. As the market continues to evolve, advancements in technology, such as electric and hydraulic augers, are expected to further drive growth and innovation.
What will be the Size of the Grain Augers Market during the forecast period?
Get Key Insights on Market Forecast (PDF) Request Free Sample
How is the Grain Augers Market Segmented ?
The grain augers industry research report provides comprehensive data (region-wise segment analysis), with forecasts and estimates in "USD million" for the period 2025-2029, as well as historical data from 2019-2023 for the following segments.
- Product
- Movable
- Stationary
- End-user
- Farm
- Commercial
- Source
- PTO
- Gas/diesel engine-powered
- Electric
- Hydraulic
- Geography
- North America
- US
- Canada
- Europe
- France
- Germany
- Italy
- UK
- APAC
- China
- India
- Japan
- South America
- Brazil
- Rest of World (ROW)
- North America
By Product Insights
The movable segment is estimated to witness significant growth during the forecast period.
Movable grain augers, a type of mechanically driven grain auger, are gaining popularity in the agricultural sector due to their enhanced transportability and efficiency. These augers offer farmers the flexibility to load and unload grains at their convenience, reducing the time spent on manual labor. The global movable the market is projected to expand significantly during the forecast period, fueled by the increasing demand for advanced control features such as corrosion resistance, auger length optimization, hopper design, and unloading efficiency. Additionally, load cell integration, belt conveyor integration, and damage reduction techniques are becoming increasingly common in movable grain augers to improve throughput optimization and material wear reduction.
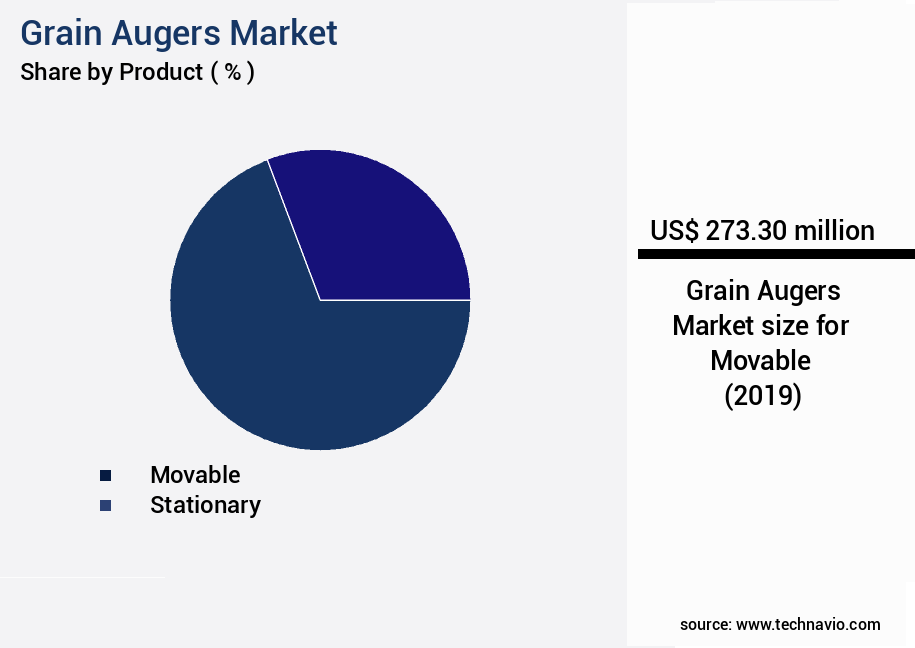
The Movable segment was valued at USD 273.30 million in 2019 and showed a gradual increase during the forecast period.
Auger diameter selection, motor selection criteria, and operational costs are crucial factors influencing the market's growth. Advanced auger drive systems, structural integrity, moisture content control, and grain quality preservation are essential features that ensure the augers' reliability and longevity. Movable grain augers are also being integrated with power transmission components, conveying technology, remote monitoring systems, and discharge mechanisms to enhance their operational efficiency. Furthermore, screw conveyor design, auger maintenance, farm automation, energy consumption, and cleaning systems are other critical aspects of movable grain augers that are undergoing continuous innovation to meet the evolving needs of farmers.
According to a recent study, the global movable market is projected to grow at a CAGR of 5.2% during the forecast period.
Regional Analysis
APAC is estimated to contribute 33% to the growth of the global market during the forecast period. Technavio's analysts have elaborately explained the regional trends and drivers that shape the market during the forecast period.

See How Grain Augers Market Demand is Rising in APAC Request Free Sample
The market in North America is poised for expansion due to the thriving agricultural sector in the region. With the US being one of the world's leading corn producers, the continuous growth in food grain production is anticipated to fuel the demand for grain handling equipment, including grain augers. Manufacturers of grain augers are capitalizing on this trend by strengthening their presence in North America through strategic alliances. The market's growth is further expected to be bolstered by efforts to increase sales in remote areas by forming new trade agreements with distributors.
According to recent industry reports, the North American market is projected to experience significant growth during the forecast period. Additionally, advancements in technology, such as electric and hydraulic grain augers, are expected to provide further opportunities for market expansion.
Market Dynamics
Our researchers analyzed the data with 2024 as the base year, along with the key drivers, trends, and challenges. A holistic analysis of drivers will help companies refine their marketing strategies to gain a competitive advantage.
The market is experiencing significant growth due to the increasing demand for efficient and reliable grain handling systems. Auger flighting plays a crucial role in minimizing grain damage during transportation, with optimized designs reducing the impact on kernel integrity. Auger system optimization for high throughput is another key trend, with selection criteria for auger drive motors prioritizing power efficiency and reliability. Improving grain auger unloading efficiency is essential for reducing operational downtime, and preventative maintenance strategies are vital for ensuring system reliability. Design considerations for auger hopper inlets include ensuring a consistent flow rate and minimizing material bridging. The influence of auger diameter on material flow is significant, with larger diameters enabling higher throughput but requiring more energy consumption. Advanced control systems for grain auger operation offer real-time monitoring and adjustment capabilities, while the effects of auger speed on grain quality must be carefully managed to maintain optimal conditions. Comparing different auger construction materials, such as stainless steel and aluminum, is essential for balancing durability, weight, and cost. Minimizing energy consumption in auger systems is a priority, with methods such as variable frequency drives and insulation helping to reduce operational costs. Auger system integration with farm automation is becoming increasingly important, allowing for remote monitoring and optimization of performance. Advanced techniques for auger cleaning and maintenance, such as CIP (clean-in-place) systems, help to ensure consistent system performance and reduce operational downtime. Strategies to reduce operational downtime of grain augers include implementing predictive maintenance programs and optimizing auger length and capacity to match specific application requirements. Remote monitoring capabilities offer real-time insights into system performance, enabling proactive maintenance and reducing the risk of unexpected downtime.
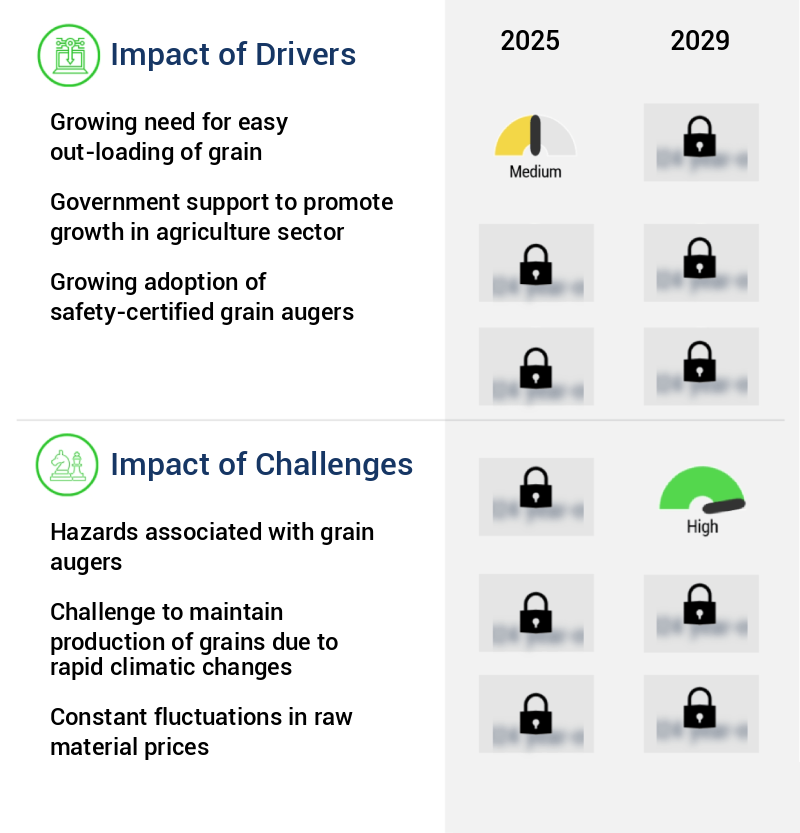
What are the key market drivers leading to the rise in the adoption of Grain Augers Industry?
- The increasing demand for convenient grain unloading processes is the primary market motivator.
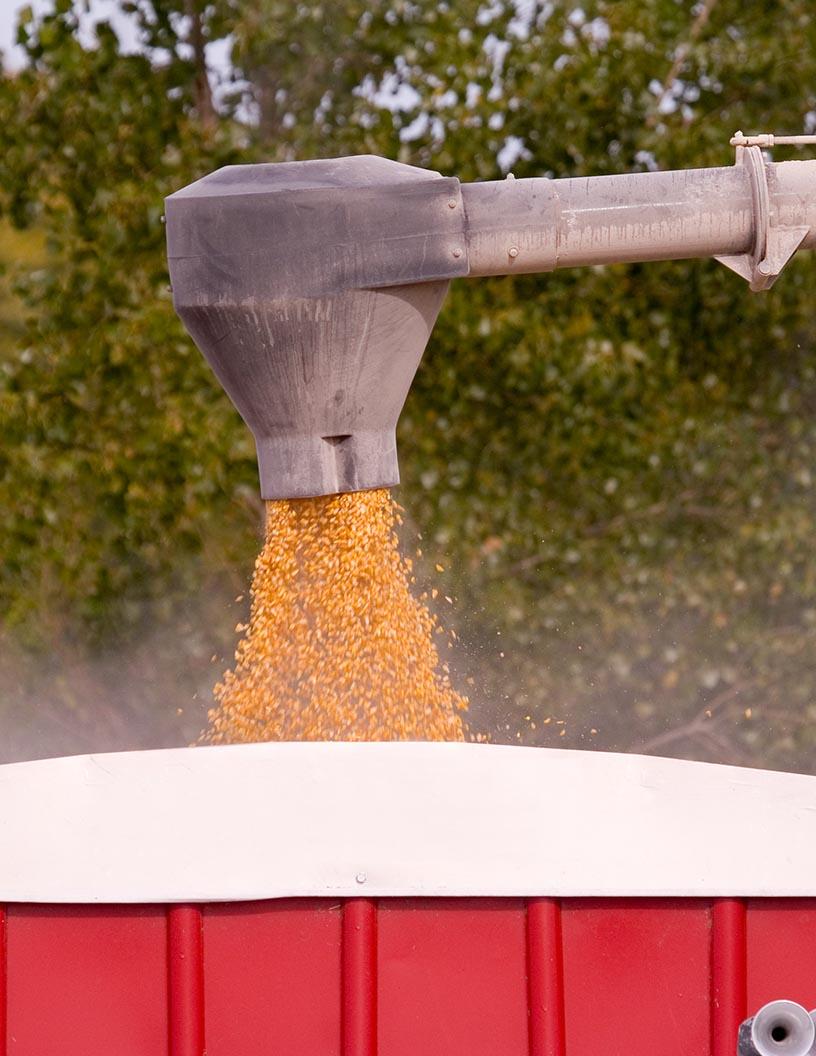
- Grain augers have become essential equipment for farmers and farming organizations, enabling the rapid transport and efficient storage of grains. These machines significantly reduce turnaround time, with large augers capable of out-loading cereal grains at approximately three tons per minute. For instance, Vennings' grain augers fill a B-double-sized truck in approximately 15 minutes. The portability of grain augers further benefits farmers by facilitating the movement of grains from bags, field bins, or farm storage sites to other locations on the farm.
- This versatility is crucial for managing grain operations effectively and maintaining a robust supply chain.
What are the market trends shaping the Grain Augers Industry?
- The rental market trend involves an increasing availability of grain augers. This is a significant development in the agricultural industry.
- The market has experienced significant evolution, with rental services playing a pivotal role in its expansion. End-users, particularly farmers, can now access the latest grain auger technology without the substantial upfront investment. Rental services offer flexibility and convenience, enabling users to book machinery as needed through rental providers' apps. The rental sector's growth is further fueled by the increasing number of startups entering the market.
- This trend not only caters to the demands of frequent users but also to those who require grain augers only occasionally. The availability of rental services has broadened the market's reach and enhanced its overall value proposition.
What challenges does the Grain Augers Industry face during its growth?
- Grain augers pose significant hazards that represent a major challenge to the growth of the industry. These hazards, which include entanglement, crushing, and suffocation, necessitate strict safety protocols and continuous training for operators to mitigate risks and ensure the sustainable expansion of the grain handling sector.
- Grain augers, essential equipment in the grain handling industry, have evolved to address safety concerns and improve efficiency. These machines, which use corkscrew blades to draw grains from storage bins, have been instrumental in facilitating the transportation and unloading of food grains. However, their operation poses potential hazards. Workers are susceptible to respiratory issues due to grain dust accumulation, noise, and the risk of fires. Large augers can create suffocation risks, making safety measures crucial. Furthermore, improperly guarded augers can lead to worker injuries from contact with sharp blades.
- Despite these challenges, the market for grain augers continues to grow, with an estimated 20% of the global grain handling equipment market share. This underscores the importance of these machines in the agriculture and food processing sectors. By addressing safety concerns and optimizing efficiency, grain augers remain a vital component in the grain handling process.
Exclusive Technavio Analysis on Customer Landscape
The grain augers market forecasting report includes the adoption lifecycle of the market, covering from the innovator's stage to the laggard's stage. It focuses on adoption rates in different regions based on penetration. Furthermore, the grain augers market report also includes key purchase criteria and drivers of price sensitivity to help companies evaluate and develop their market growth analysis strategies.
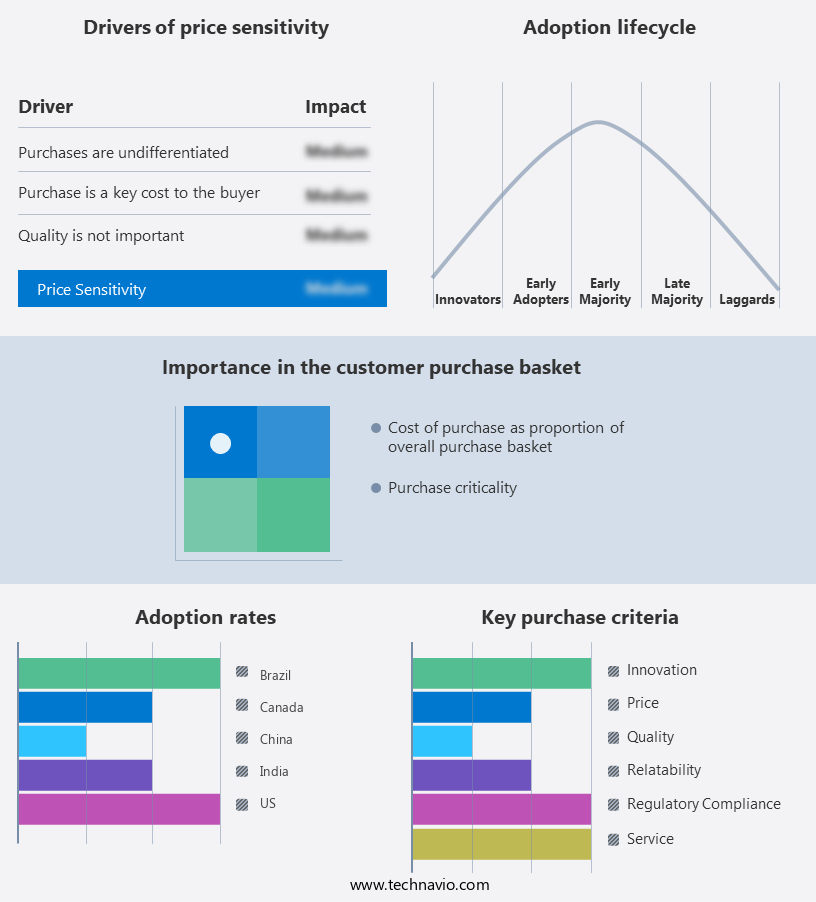
Customer Landscape of Grain Augers Industry
Competitive Landscape
Companies are implementing various strategies, such as strategic alliances, grain augers market forecast, partnerships, mergers and acquisitions, geographical expansion, and product/service launches, to enhance their presence in the industry.
Ag Growth International Inc. - This company specializes in manufacturing grain augers with mechanical drive hoppers, capable of handling impressive throughputs up to 23,000 bushels per hour.
The industry research and growth report includes detailed analyses of the competitive landscape of the market and information about key companies, including:
- Ag Growth International Inc.
- Astwell Augers Ltd.
- Bazooka-Farmstar Inc.
- Berkshire Hathaway Inc.
- Brandt Group of Companies
- Buhler Industries Inc.
- CLAAS KGaA mBH
- Distel Grain Systems Inc.
- Diversified Technologies Inc.
- Elmers Manufacturing Inc.
- Grainline
- Harberger Pty Ltd.
- Honeyville Metal Inc.
- J and M Manufacturing Co. Inc.
- Lloyd and Meredith
- Rodono Industries Ltd.
- Superior Manufacturing LLC
- Trufab Engineering (Australia) Pty Ltd.
- Venning Engineering Pty Ltd.
- Westman Group Inc.
Qualitative and quantitative analysis of companies has been conducted to help clients understand the wider business environment as well as the strengths and weaknesses of key industry players. Data is qualitatively analyzed to categorize companies as pure play, category-focused, industry-focused, and diversified; it is quantitatively analyzed to categorize companies as dominant, leading, strong, tentative, and weak.
Recent Development and News in Grain Augers Market
- In January 2024, AGCO Corporation, a leading agricultural machinery manufacturer, introduced the latest addition to its grain handling product line – the Tiger Tip TG Series Grain Augers. This new range, featuring increased capacity and improved efficiency, was showcased at the Farm Progress Show (source: AGCO press release).
- In March 2024, Caterpillar Inc. and Sioux Steel, a leading manufacturer of grain handling equipment, announced a strategic partnership to co-develop and manufacture a new line of heavy-duty grain augers. The collaboration aimed to leverage Caterpillar's global distribution network and Sioux Steel's engineering expertise (source: Caterpillar press release).
- In May 2024, GSI, a leading grain handling solutions provider, received approval from the USDA Rural Development for a USD 5 million loan to expand its manufacturing facility in Hastings, NE. The expansion would increase GSI's production capacity by 30%, enabling it to meet growing demand for its grain handling equipment (source: USDA Rural Development press release).
- In April 2025, Schwing-Sweco, a global leader in concrete and construction equipment, entered the grain handling market with the acquisition of Grain Handling Solutions, a leading provider of grain handling equipment. The acquisition strengthened Schwing-Sweco's position in the agricultural sector and expanded its product portfolio (source: Schwing-Sweco press release).
Dive into Technavio's robust research methodology, blending expert interviews, extensive data synthesis, and validated models for unparalleled Grain Augers Market insights. See full methodology.
|
Market Scope |
|
|
Report Coverage |
Details |
|
Page number |
211 |
|
Base year |
2024 |
|
Historic period |
2019-2023 |
|
Forecast period |
2025-2029 |
|
Growth momentum & CAGR |
Accelerate at a CAGR of 4.3% |
|
Market growth 2025-2029 |
USD 107.7 million |
|
Market structure |
Fragmented |
|
YoY growth 2024-2025(%) |
4.2 |
|
Key countries |
US, Canada, China, UK, Japan, Germany, India, Brazil, Italy, and France |
|
Competitive landscape |
Leading Companies, Market Positioning of Companies, Competitive Strategies, and Industry Risks |
Research Analyst Overview
- The grain auger market continues to evolve, driven by advancements in technology and the expanding demands of various sectors. Corrosion resistance is a key consideration in grain auger design, ensuring longevity and reducing maintenance costs. Grain auger capacity and auger length optimization are essential for efficient farm operations, with some augers capable of handling up to 1,500 bushels per hour. Hopper design and unloading efficiency are critical factors in grain handling systems. Integration of load cells and belt conveyors enhances damage reduction techniques, while auger flighting design and flow rate optimization improve throughput. Material wear and auger drive systems require continuous attention for optimal structural integrity.
- Moisture content control and grain quality preservation are essential for maintaining optimal grain conditions. Power transmission components and conveying technology advancements contribute to energy consumption reduction. Remote monitoring systems and discharge mechanisms enable real-time performance analysis. Screw conveyor design and auger maintenance are crucial for ensuring operational costs remain competitive. Farm automation and precision agriculture technology integration facilitate increased efficiency and productivity. Industry growth is expected to reach 3% annually, driven by these ongoing market activities and evolving patterns. For instance, a farm implementing an advanced grain handling system reported a 20% increase in sales due to improved efficiency and grain quality.
- This underscores the significance of continuous innovation and optimization in the grain auger market.
What are the Key Data Covered in this Grain Augers Market Research and Growth Report?
-
What is the expected growth of the Grain Augers Market between 2025 and 2029?
-
USD 107.7 million, at a CAGR of 4.3%
-
-
What segmentation does the market report cover?
-
The report is segmented by Product (Movable and Stationary), End-user (Farm and Commercial), Source (PTO, Gas/diesel engine-powered, Electric, and Hydraulic), and Geography (North America, Europe, APAC, South America, and Middle East and Africa)
-
-
Which regions are analyzed in the report?
-
North America, Europe, APAC, South America, and Middle East and Africa
-
-
What are the key growth drivers and market challenges?
-
Growing need for easy out-loading of grain, Hazards associated with grain augers
-
-
Who are the major players in the Grain Augers Market?
-
Ag Growth International Inc., Astwell Augers Ltd., Bazooka-Farmstar Inc., Berkshire Hathaway Inc., Brandt Group of Companies, Buhler Industries Inc., CLAAS KGaA mBH, Distel Grain Systems Inc., Diversified Technologies Inc., Elmers Manufacturing Inc., Grainline, Harberger Pty Ltd., Honeyville Metal Inc., J and M Manufacturing Co. Inc., Lloyd and Meredith, Rodono Industries Ltd., Superior Manufacturing LLC, Trufab Engineering (Australia) Pty Ltd., Venning Engineering Pty Ltd., and Westman Group Inc.
-
Market Research Insights
- The market for grain augers is a dynamic and ever-evolving industry that caters to the agricultural sector's need for efficient grain handling. Two significant statistics highlight the market's continuous growth. First, the implementation of advanced technologies, such as remote diagnostics and automated control systems, has led to a reduction in operational downtime by up to 20%. Second, industry analysts anticipate that the market will expand by over 15% in the coming years due to the increasing demand for larger-scale farming operations and the ongoing development of more robust auger construction materials. For instance, the integration of material science and mechanical engineering principles in auger design has resulted in the creation of more durable and efficient systems.
- Additionally, the adoption of calibration methods, system integration, and performance evaluation techniques has optimized auger functionality and ensured system reliability. Overall, the grain auger market remains a vital sector in agricultural engineering, with ongoing advancements in technology and engineering driving its growth.
We can help! Our analysts can customize this grain augers market research report to meet your requirements.
 RIA -
RIA - 
