Grow Light Market Analysis, Size, and Forecast 2026-2030: Europe (Germany, The Netherlands, and UK), North America (US, Canada, and Mexico), APAC (China, Japan, and India), Middle East and Africa (Saudi Arabia, South Africa, and UAE), South America (Brazil and Argentina), and Rest of World (ROW)

Grow Light Market Analysis, Size, and Forecast 2026-2030:
Europe (Germany, The Netherlands, and UK), North America (US, Canada, and Mexico), APAC (China, Japan, and India), Middle East and Africa (Saudi Arabia, South Africa, and UAE), South America (Brazil and Argentina), and Rest of World (ROW)

Published: Dec 2025 293 Pages SKU: IRTNTR74651

Market Overview at a Glance

$19.57 B
Market Opportunity
22.6%
CAGR 2025 - 2030
31.6%
Europe Growth
$2.96 B
Commercial green house segment 2024

Grow Light Market Size 2026-2030

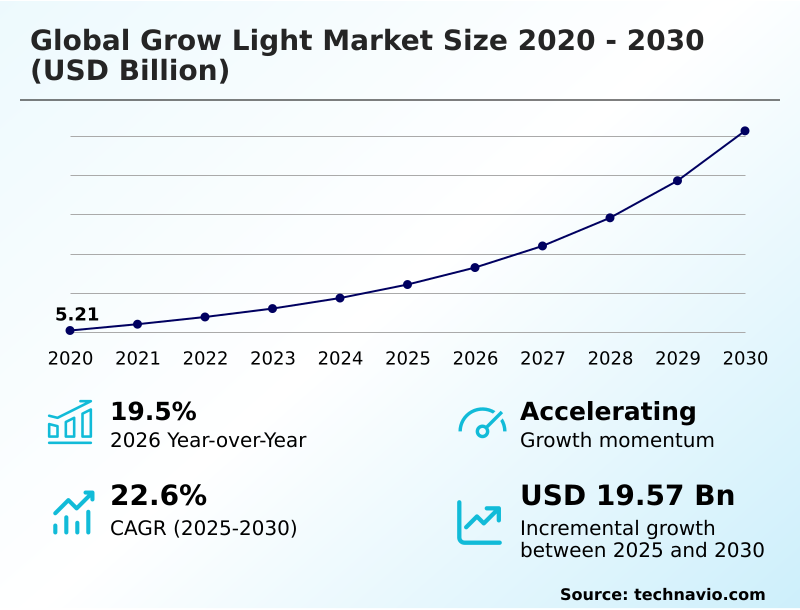
The grow light market size is valued to increase by USD 19.57 billion, at a CAGR of 22.6% from 2025 to 2030. Growing popularity of urban agriculture will drive the grow light market.

Major Market Trends & Insights

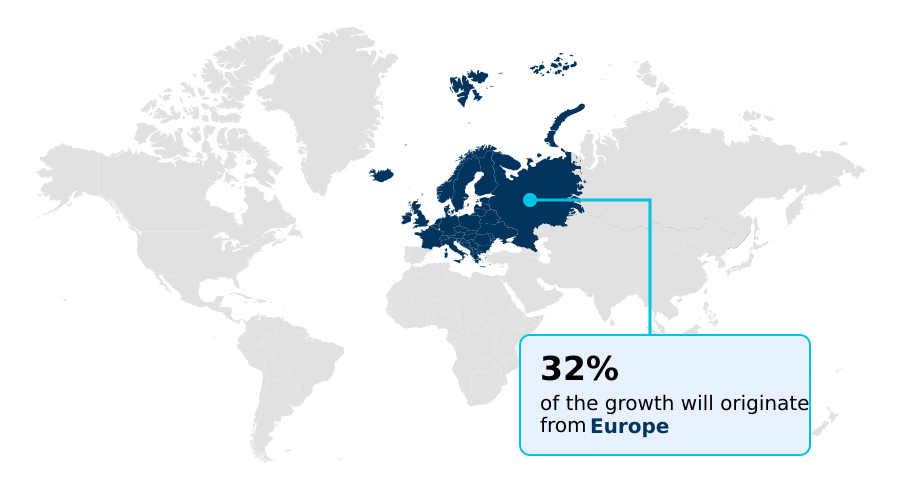
  • Europe dominated the market and accounted for a 31.6% growth during the forecast period.
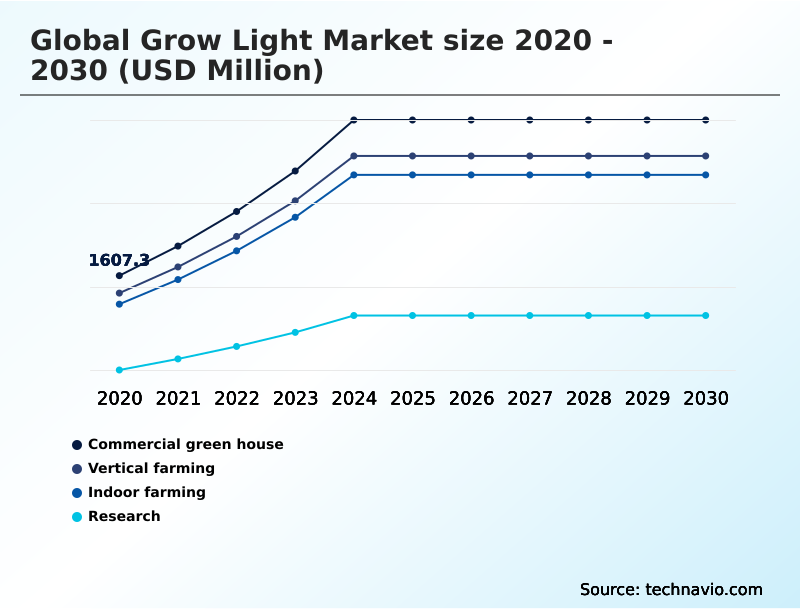
  • By Application - Commercial green house segment was valued at USD 2.96 billion in 2024
  • By Product - LED lights segment accounted for the largest market revenue share in 2024

Market Size & Forecast

  • Market Opportunities: USD 25.41 billion
  • Market Future Opportunities: USD 19.57 billion
  • CAGR from 2025 to 2030 : 22.6%

Market Summary

  • The grow light market is expanding rapidly, driven by the convergence of agricultural needs and technological innovation. At its core, the market provides critical illumination solutions for controlled environment agriculture, enabling year-round cultivation and bolstering food security solutions. Key drivers include the rise of urban agriculture lighting and indoor farming solutions, which depend on artificial light to operate.
  • Trends are shifting toward intelligent systems that leverage IoT-enabled farming for precision agriculture, allowing for real-time adjustments to light conditions.
  • For instance, a commercial vertical farm can implement dynamic spectrum tuning to align with the circadian rhythm lighting of its crops, automatically adjusting deep-red and blue LEDs to accelerate growth stages, thereby reducing the cultivation cycle by up to 10% and improving operational throughput.
  • However, challenges such as the high initial cost and the technical complexity of light recipe optimization for various crops, from leafy green production to medicinal plant cultivation, persist. The ongoing development of LED grow light efficacy and better thermal management systems is crucial for addressing these hurdles and sustaining market momentum.

What will be the Size of the Grow Light Market during the forecast period?

Get Key Insights on Market Forecast (PDF) Request Free Sample

How is the Grow Light Market Segmented?

The grow light industry research report provides comprehensive data (region-wise segment analysis), with forecasts and estimates in "USD million" for the period 2026-2030, as well as historical data from 2020-2024 for the following segments.

  • Application
    • Commercial green house
    • Vertical farming
    • Indoor farming
    • Research
  • Product
    • LED lights
    • HID
    • Fluorescent lights
    • Others
  • Power rating
    • Less than 300 watt
    • More than 300 watt
  • Geography
    • Europe
      • Germany
      • The Netherlands
      • UK
    • North America
      • US
      • Canada
      • Mexico
    • APAC
      • China
      • Japan
      • India
    • Middle East and Africa
      • Saudi Arabia
      • South Africa
      • UAE
    • South America
      • Brazil
      • Argentina
    • Rest of World (ROW)

By Application Insights

The commercial green house segment is estimated to witness significant growth during the forecast period.

The commercial greenhouse segment is a foundational component of the market, where greenhouse supplemental lighting is crucial for maintaining production schedules irrespective of seasonal variations. Operators are increasingly retrofitting older systems, evaluating ballast compatibility with modern fixtures.

While high-intensity discharge (HID) and compact fluorescent lamp (CFL) systems have been prevalent, the shift toward light-emitting diode (LED) technology is driven by significant gains in luminaire efficiency. This transition is pivotal for energy-efficient horticulture and sustainable agriculture technology.

Adopting advanced commercial greenhouse lighting directly impacts crop yield optimization and plant quality improvement, enabling consistent year-round cultivation. For instance, growers upgrading to high-efficiency LEDs have reported up to a 25% reduction in energy consumption per unit of produce.

Request Free Sample

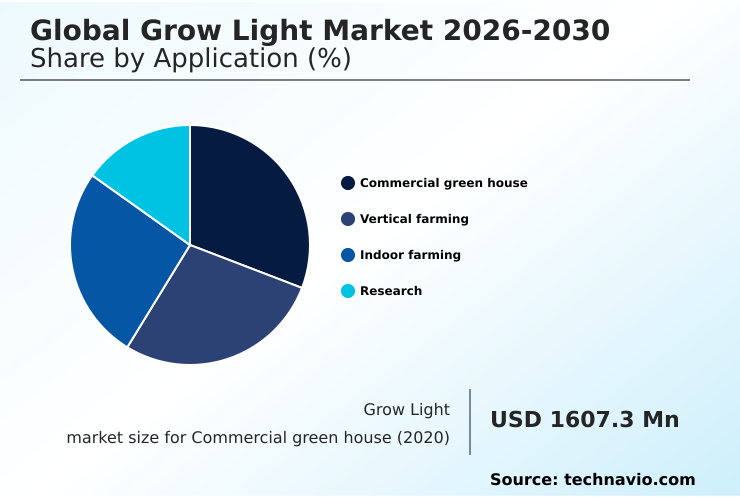
The Commercial green house segment was valued at USD 2.96 billion in 2024 and showed a gradual increase during the forecast period.

Request Free Sample

Regional Analysis

Europe is estimated to contribute 31.6% to the growth of the global market during the forecast period.Technavio’s analysts have elaborately explained the regional trends and drivers that shape the market during the forecast period.

See How Grow Light Market Demand is Rising in Europe Request Free Sample

The geographic landscape for the global grow light market 2026-2030 is defined by varied adoption rates of advanced horticultural lighting technologies.

In developed regions, there is a strong focus on photomorphogenesis control and photoperiod manipulation using sophisticated systems that include far-red light spectrum capabilities to influence flowering.

Niche applications are emerging for light emitting plasma (LEP) and quantum dot LEDs within research-grade grow lights and plant factory technology.

Meanwhile, expanding markets are seeing growth in aquaponics integration and accessible solutions for rooftop gardening lights and consumer home grow kits. This diversification in application, from industrial ornamental horticulture to personal cultivation, highlights the market's adaptability.

Adoption of smart circadian rhythm lighting in advanced markets is over 50% higher than in emerging regions.

Market Dynamics

Our researchers analyzed the data with 2025 as the base year, along with the key drivers, trends, and challenges. A holistic analysis of drivers will help companies refine their marketing strategies to gain a competitive advantage.

  • The global grow light market 2026-2030 is defined by a sophisticated interplay of technology and agricultural science, moving beyond simple illumination to precise environmental control. Strategic decisions now revolve around optimizing light spectrum for photosynthesis and understanding the impact of light quality on plants.
  • The ongoing debate of LED versus HID for crop yield is increasingly settled by data, with a comprehensive cost-benefit analysis of LED grow lights often favoring the former due to lower long-term operational expenses. The complexity of spectral tuning for plant morphology is a key differentiator for manufacturers.
  • Specialized grow light systems for vertical farms and full-spectrum lighting for cannabis have become distinct, high-value segments. Growers are also leveraging the UV light benefits in horticulture and using far-red light for flowering induction to manipulate crop cycles.
  • The integration of smart controls for greenhouse lighting and grow light automation with IoT is becoming standard, allowing for precise management of environmental factors. For compliance, measuring PPFD for plant growth is essential for validating performance claims. Advanced systems now feature better thermal management in LED fixtures, addressing a key failure point.
  • The customization of light recipes for leafy greens and other crops based on their specific DLI requirements for various crops is critical for improving crop quality with specific wavelengths.
  • Furthermore, effective canopy penetration with different light sources and photoperiod control for plant development are central to maximizing yield, with automated systems showing a 20% greater consistency in harvest timing compared to manually managed environments. These advancements underscore the market's shift toward data-driven, high-efficiency lighting solutions for indoor farming.

What are the key market drivers leading to the rise in the adoption of Grow Light Industry?

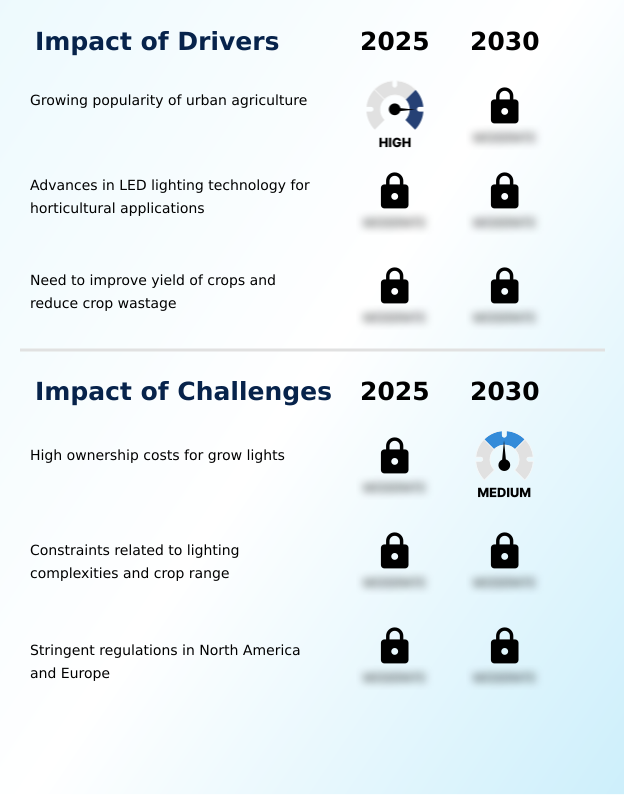
  • The growing popularity of urban agriculture is a key driver for the market's expansion.

  • The expansion of controlled environment agriculture is a primary driver for the global grow light market 2026-2030, fueling demand for specialized indoor farming solutions.
  • The proliferation of urban agriculture lighting for multi-tier farming and soilless cultivation systems addresses the need for local food production and enhances food security solutions.
  • In these setups, vertical farming lighting must deliver optimal photosynthetically active radiation (PAR) with high photon flux density.
  • The focus is on maximizing LED grow light efficacy to achieve the target daily light integral (DLI) using precise combinations of deep-red and blue LEDs.
  • Farms utilizing these advanced lighting systems report yield increases of over 40% per square meter compared to traditional methods, showcasing the technology's effectiveness.

What are the market trends shaping the Grow Light Industry?

  • The application of grow lights for plant disease detection and monitoring is an upcoming market trend. This involves using advanced illumination systems for early stress signal identification in crops.

  • A significant trend in the global grow light market 2026-2030 is the evolution of lighting systems into active diagnostic tools through IoT-enabled farming. The integration of sensors enables plant stress detection and facilitates data-driven horticulture and precision agriculture. Modern systems utilize smart lighting controls for dynamic spectrum tuning, adjusting wavelength-specific LEDs in real-time based on plant photobiology data.
  • Some advanced setups even incorporate low levels of UV-A and UV-B radiation to enhance crop characteristics. This level of automated cultivation leads to significant operational gains; for example, automated systems have demonstrated a 30% improvement in early disease detection accuracy compared to manual inspection. These technologies are also applied in specialized areas like plant propagation lighting and tissue culture lighting.

What challenges does the Grow Light Industry face during its growth?

  • The high ownership costs associated with grow lights present a key challenge affecting industry growth.

  • Key operational challenges persist in the global grow light market 2026-2030, particularly concerning the longevity and performance of solid-state lighting. Effective thermal management systems are critical, as heat can accelerate lumen depreciation and impact system lifespan.
  • The complexity of light recipe optimization for different crops, from leafy green production to fruiting crop lighting and high-value medicinal plant cultivation, requires significant expertise. Growers using hydroponic grow systems and aeroponic lighting also need fixtures with a high IP rating for grow lights to withstand humid environments.
  • Furthermore, achieving uniform canopy penetration and implementing effective inter-canopy lighting strategies for dense crops, such as those in cannabis cultivation lighting, adds to the technical difficulty, increasing upfront costs by as much as 15%.

Exclusive Technavio Analysis on Customer Landscape

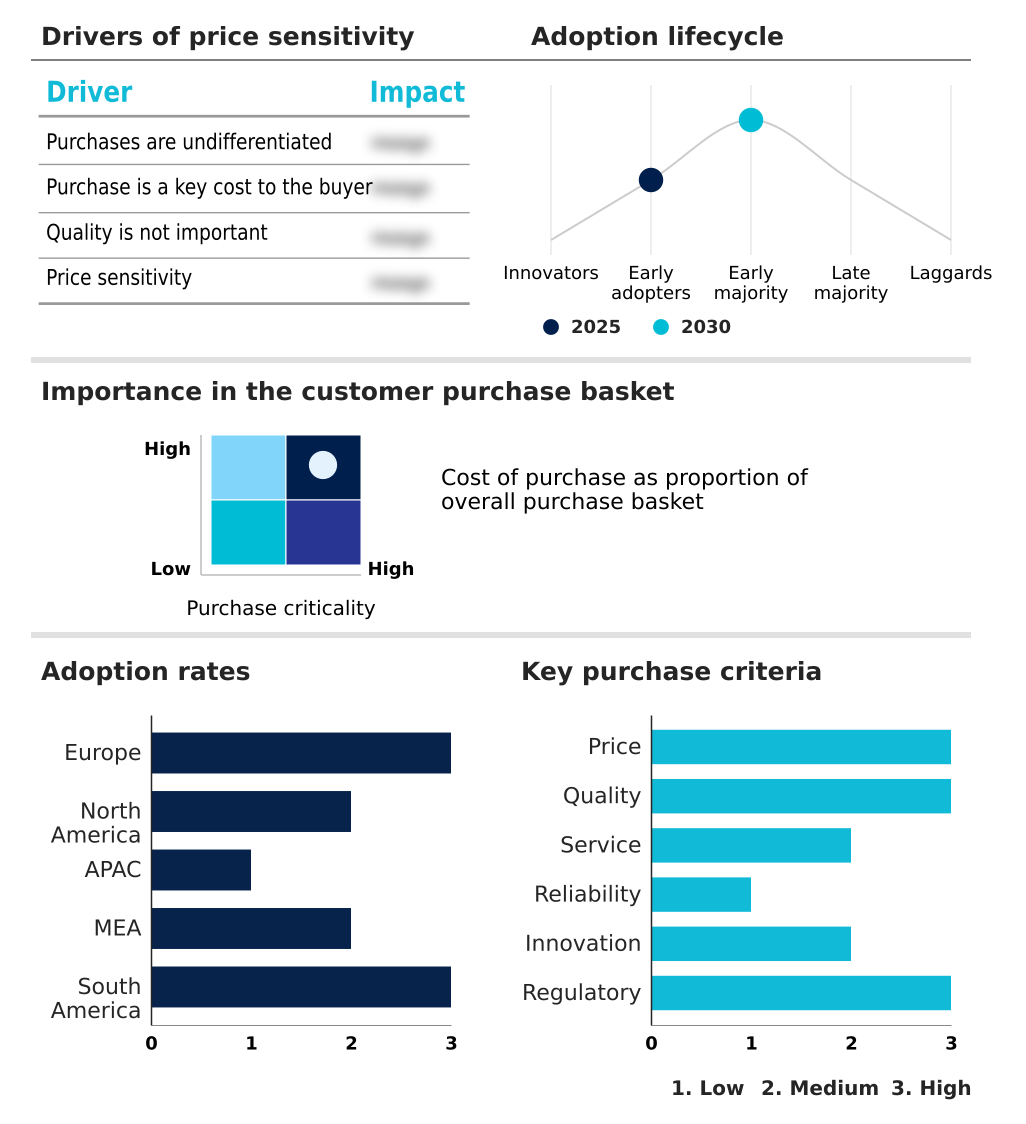
The grow light market forecasting report includes the adoption lifecycle of the market, covering from the innovator’s stage to the laggard’s stage. It focuses on adoption rates in different regions based on penetration. Furthermore, the grow light market report also includes key purchase criteria and drivers of price sensitivity to help companies evaluate and develop their market growth analysis strategies.

Customer Landscape of Grow Light Industry

Competitive Landscape

Companies are implementing various strategies, such as strategic alliances, grow light market forecast, partnerships, mergers and acquisitions, geographical expansion, and product/service launches, to enhance their presence in the industry.

Aerogrow International Inc. - Provides a range of specialized grow light solutions engineered to support various indoor and home-based cultivation applications, enhancing plant growth through optimized illumination.

The industry research and growth report includes detailed analyses of the competitive landscape of the market and information about key companies, including:

  • Aerogrow International Inc.
  • Agnetix
  • Altos India Limited
  • Black Dog Grow Technologies Inc.
  • California LightWorks
  • Crecer Lighting
  • EconoLux Industries Ltd.
  • EVERLIGHT ELECTRONICS CO. LTD.
  • General Electric Co.
  • Heliospectra AB
  • Koninklijke Philips NV
  • Lemnis Oreon BV
  • OSRAM GmbH
  • Sanan Optoelectronics Co. Ltd.
  • SANANBIO
  • Signify NV
  • Thrive Agritech
  • ViparSpectra

Qualitative and quantitative analysis of companies has been conducted to help clients understand the wider business environment as well as the strengths and weaknesses of key industry players. Data is qualitatively analyzed to categorize companies as pure play, category-focused, industry-focused, and diversified; it is quantitatively analyzed to categorize companies as dominant, leading, strong, tentative, and weak.

Recent Development and News in Grow light market

  • In May 2025, ams OSRAM launched its OSCONIQ P 3737 GEN 2, a high-power LED engineered for vertical farming and rooftop agriculture applications to enhance photon flux and efficiency.
  • In May 2025, Signify NV introduced a modular LED lighting system designed for cultivating leafy greens and berries in large-scale greenhouse operations across the Netherlands and Germany.
  • In March 2025, Cultilux announced a new double-ended 1000W high-intensity discharge (HID) lamp optimized for modern greenhouse applications requiring high photon output and canopy penetration.
  • In February 2025, California LightWorks unveiled its MegaDrive UnderCanopy LED system, a product designed to deliver high-intensity light to lower plant canopies to boost overall crop yield.

Dive into Technavio’s robust research methodology, blending expert interviews, extensive data synthesis, and validated models for unparalleled Grow Light Market insights. See full methodology.

Market Scope
Page number 293
Base year 2025
Historic period 2020-2024
Forecast period 2026-2030
Growth momentum & CAGR Accelerate at a CAGR of 22.6%
Market growth 2026-2030 USD 19565.8 million
Market structure Fragmented
YoY growth 2025-2026(%) 19.5%
Key countries Germany, The Netherlands, UK, France, Italy, Spain, US, Canada, Mexico, China, Japan, India, South Korea, Australia, Indonesia, Saudi Arabia, South Africa, UAE, Israel, Turkey, Brazil, Argentina and Chile
Competitive landscape Leading Companies, Market Positioning of Companies, Competitive Strategies, and Industry Risks

Request Free Sample

Research Analyst Overview

  • The grow light market is undergoing a significant transformation driven by advancements in solid-state lighting and plant photobiology. Innovations in quantum dot LEDs and wavelength-specific LEDs are enhancing LED grow light efficacy, allowing for precise photomorphogenesis control. The development of sophisticated light recipe optimization techniques enables growers to fine-tune spectral power distribution and daily light integral (DLI) for specific crops.
  • This level of control, managed through smart lighting controls and dynamic spectrum tuning, is critical for controlled environment agriculture. A key boardroom consideration is the investment in superior thermal management systems to mitigate lumen depreciation and ensure long-term ROI. For example, systems with advanced cooling reduce premature failures by over 20%.
  • The ability to manipulate the far-red light spectrum for photoperiod manipulation, along with strategies for deep canopy penetration and inter-canopy lighting, defines competitive horticultural lighting solutions. Achieving optimal photosynthetic photon flux (PPF) and photon flux density with high luminaire efficiency is the central goal.
  • Technologies like high-intensity discharge (HID) and light emitting plasma (LEP) continue to serve niche applications, while the demand for fixtures with high IP rating for grow lights is standard.
  • The market is also seeing specific applications of deep-red and blue LEDs, UV-A and UV-B radiation, compact fluorescent lamp (CFL), circadian rhythm lighting, plant stress detection, and ensuring ballast compatibility remains relevant for retrofitting.

What are the Key Data Covered in this Grow Light Market Research and Growth Report?

  • What is the expected growth of the Grow Light Market between 2026 and 2030?

    • USD 19.57 billion, at a CAGR of 22.6%

  • What segmentation does the market report cover?

    • The report is segmented by Application (Commercial green house, Vertical farming, Indoor farming, and Research), Product (LED lights, HID, Fluorescent lights, and Others), Power Rating (Less than 300 watt, and More than 300 watt) and Geography (Europe, North America, APAC, Middle East and Africa, South America)

  • Which regions are analyzed in the report?

    • Europe, North America, APAC, Middle East and Africa and South America

  • What are the key growth drivers and market challenges?

    • Growing popularity of urban agriculture, High ownership costs for grow lights

  • Who are the major players in the Grow Light Market?

    • Aerogrow International Inc., Agnetix, Altos India Limited, Black Dog Grow Technologies Inc., California LightWorks, Crecer Lighting, EconoLux Industries Ltd., EVERLIGHT ELECTRONICS CO. LTD., General Electric Co., Heliospectra AB, Koninklijke Philips NV, Lemnis Oreon BV, OSRAM GmbH, Sanan Optoelectronics Co. Ltd., SANANBIO, Signify NV, Thrive Agritech and ViparSpectra

Market Research Insights

  • Market dynamics are increasingly shaped by the integration of IoT-enabled farming, which facilitates precision agriculture and automated cultivation. The adoption of data-driven horticulture allows operators to optimize inputs, with some farms reporting a 15% reduction in energy waste. This shift supports the expansion of indoor farming solutions, soilless cultivation systems, and hydroponic grow systems for enhanced local food production.
  • The pursuit of sustainable agriculture technology and energy-efficient horticulture is a key factor, particularly as urban agriculture lighting becomes more widespread. The market also caters to high-value segments such as medicinal plant cultivation, including cannabis cultivation lighting, and specialized applications like plant propagation lighting, where controlled environments are critical.
  • Efficient lighting directly impacts crop yield optimization, with advanced systems improving output by over 35% in some cases.

We can help! Our analysts can customize this grow light market research report to meet your requirements.

Get in touch

1. Executive Summary

1.1 Market overview

Executive Summary - Chart on Market Overview
Executive Summary - Data Table on Market Overview
Executive Summary - Chart on Global Market Characteristics
Executive Summary - Chart on Market by Geography
Executive Summary - Chart on Market Segmentation by Application
Executive Summary - Chart on Market Segmentation by Product
Executive Summary - Chart on Market Segmentation by Power Rating
Executive Summary - Chart on Incremental Growth
Executive Summary - Data Table on Incremental Growth
Executive Summary - Chart on Company Market Positioning

2. Technavio Analysis

2.1 Analysis of price sensitivity, lifecycle, customer purchase basket, adoption rates, and purchase criteria

2.2 Criticality of inputs and Factors of differentiation

Chart on Overview on criticality of inputs and factors of differentiation

2.3 Factors of disruption

Chart on Overview on factors of disruption

2.4 Impact of drivers and challenges

Chart on Impact of drivers and challenges in 2025 and 2030

3. Market Landscape

3.1 Market ecosystem

Chart on Parent Market
Data Table on - Parent Market

3.2 Market characteristics

Chart on Market characteristics analysis

3.3 Value chain analysis

Chart on Value chain analysis

4. Market Sizing

4.1 Market definition

Data Table on Offerings of companies included in the market definition

4.2 Market segment analysis

Market segments

4.3 Market size 2025

4.4 Market outlook: Forecast for 2025-2030

Chart on Global - Market size and forecast 2025-2030 ($ million)
Data Table on Global - Market size and forecast 2025-2030 ($ million)
Chart on Global Market: Year-over-year growth 2025-2030 (%)
Data Table on Global Market: Year-over-year growth 2025-2030 (%)

5. Historic Market Size

5.1 Global Grow Light Market 2020 - 2024

Historic Market Size - Data Table on Global Grow Light Market 2020 - 2024 ($ million)

5.2 Application segment analysis 2020 - 2024

Historic Market Size - Application Segment 2020 - 2024 ($ million)

5.3 Product segment analysis 2020 - 2024

Historic Market Size - Product Segment 2020 - 2024 ($ million)

5.4 Power Rating segment analysis 2020 - 2024

Historic Market Size - Power Rating Segment 2020 - 2024 ($ million)

5.5 Geography segment analysis 2020 - 2024

Historic Market Size - Geography Segment 2020 - 2024 ($ million)

5.6 Country segment analysis 2020 - 2024

Historic Market Size - Country Segment 2020 - 2024 ($ million)

6. Qualitative Analysis

6.1 Impact of AI on global grow light market

7. Five Forces Analysis

7.1 Five forces summary

Five forces analysis - Comparison between 2025 and 2030

7.2 Bargaining power of buyers

Bargaining power of buyers - Impact of key factors 2025 and 2030

7.3 Bargaining power of suppliers

Bargaining power of suppliers - Impact of key factors in 2025 and 2030

7.4 Threat of new entrants

Threat of new entrants - Impact of key factors in 2025 and 2030

7.5 Threat of substitutes

Threat of substitutes - Impact of key factors in 2025 and 2030

7.6 Threat of rivalry

Threat of rivalry - Impact of key factors in 2025 and 2030

7.7 Market condition

Chart on Market condition - Five forces 2025 and 2030

8. Market Segmentation by Application

8.1 Market segments

Chart on Application - Market share 2025-2030 (%)
Data Table on Application - Market share 2025-2030 (%)

8.2 Comparison by Application

Chart on Comparison by Application
Data Table on Comparison by Application

8.3 Commercial green house - Market size and forecast 2025-2030

Chart on Commercial green house - Market size and forecast 2025-2030 ($ million)
Data Table on Commercial green house - Market size and forecast 2025-2030 ($ million)
Chart on Commercial green house - Year-over-year growth 2025-2030 (%)
Data Table on Commercial green house - Year-over-year growth 2025-2030 (%)

8.4 Vertical farming - Market size and forecast 2025-2030

Chart on Vertical farming - Market size and forecast 2025-2030 ($ million)
Data Table on Vertical farming - Market size and forecast 2025-2030 ($ million)
Chart on Vertical farming - Year-over-year growth 2025-2030 (%)
Data Table on Vertical farming - Year-over-year growth 2025-2030 (%)

8.5 Indoor farming - Market size and forecast 2025-2030

Chart on Indoor farming - Market size and forecast 2025-2030 ($ million)
Data Table on Indoor farming - Market size and forecast 2025-2030 ($ million)
Chart on Indoor farming - Year-over-year growth 2025-2030 (%)
Data Table on Indoor farming - Year-over-year growth 2025-2030 (%)

8.6 Research - Market size and forecast 2025-2030

Chart on Research - Market size and forecast 2025-2030 ($ million)
Data Table on Research - Market size and forecast 2025-2030 ($ million)
Chart on Research - Year-over-year growth 2025-2030 (%)
Data Table on Research - Year-over-year growth 2025-2030 (%)

8.7 Market opportunity by Application

Market opportunity by Application ($ million)
Data Table on Market opportunity by Application ($ million)

9. Market Segmentation by Product

9.1 Market segments

Chart on Product - Market share 2025-2030 (%)
Data Table on Product - Market share 2025-2030 (%)

9.2 Comparison by Product

Chart on Comparison by Product
Data Table on Comparison by Product

9.3 LED lights - Market size and forecast 2025-2030

Chart on LED lights - Market size and forecast 2025-2030 ($ million)
Data Table on LED lights - Market size and forecast 2025-2030 ($ million)
Chart on LED lights - Year-over-year growth 2025-2030 (%)
Data Table on LED lights - Year-over-year growth 2025-2030 (%)

9.4 HID - Market size and forecast 2025-2030

Chart on HID - Market size and forecast 2025-2030 ($ million)
Data Table on HID - Market size and forecast 2025-2030 ($ million)
Chart on HID - Year-over-year growth 2025-2030 (%)
Data Table on HID - Year-over-year growth 2025-2030 (%)

9.5 Fluorescent lights - Market size and forecast 2025-2030

Chart on Fluorescent lights - Market size and forecast 2025-2030 ($ million)
Data Table on Fluorescent lights - Market size and forecast 2025-2030 ($ million)
Chart on Fluorescent lights - Year-over-year growth 2025-2030 (%)
Data Table on Fluorescent lights - Year-over-year growth 2025-2030 (%)

9.6 Others - Market size and forecast 2025-2030

Chart on Others - Market size and forecast 2025-2030 ($ million)
Data Table on Others - Market size and forecast 2025-2030 ($ million)
Chart on Others - Year-over-year growth 2025-2030 (%)
Data Table on Others - Year-over-year growth 2025-2030 (%)

9.7 Market opportunity by Product

Market opportunity by Product ($ million)
Data Table on Market opportunity by Product ($ million)

10. Market Segmentation by Power Rating

10.1 Market segments

Chart on Power Rating - Market share 2025-2030 (%)
Data Table on Power Rating - Market share 2025-2030 (%)

10.2 Comparison by Power Rating

Chart on Comparison by Power Rating
Data Table on Comparison by Power Rating

10.3 Less than 300 watt - Market size and forecast 2025-2030

Chart on Less than 300 watt - Market size and forecast 2025-2030 ($ million)
Data Table on Less than 300 watt - Market size and forecast 2025-2030 ($ million)
Chart on Less than 300 watt - Year-over-year growth 2025-2030 (%)
Data Table on Less than 300 watt - Year-over-year growth 2025-2030 (%)

10.4 More than 300 watt - Market size and forecast 2025-2030

Chart on More than 300 watt - Market size and forecast 2025-2030 ($ million)
Data Table on More than 300 watt - Market size and forecast 2025-2030 ($ million)
Chart on More than 300 watt - Year-over-year growth 2025-2030 (%)
Data Table on More than 300 watt - Year-over-year growth 2025-2030 (%)

10.5 Market opportunity by Power Rating

Market opportunity by Power Rating ($ million)
Data Table on Market opportunity by Power Rating ($ million)

11. Customer Landscape

11.1 Customer landscape overview

Analysis of price sensitivity, lifecycle, customer purchase basket, adoption rates, and purchase criteria

12. Geographic Landscape

12.1 Geographic segmentation

Chart on Market share by geography 2025-2030 (%)
Data Table on Market share by geography 2025-2030 (%)

12.2 Geographic comparison

Chart on Geographic comparison
Data Table on Geographic comparison

12.3 Europe - Market size and forecast 2025-2030

Chart on Europe - Market size and forecast 2025-2030 ($ million)
Data Table on Europe - Market size and forecast 2025-2030 ($ million)
Chart on Europe - Year-over-year growth 2025-2030 (%)
Data Table on Europe - Year-over-year growth 2025-2030 (%)
Chart on Regional Comparison - Europe
Data Table on Regional Comparison - Europe

12.3.1 Germany - Market size and forecast 2025-2030

Chart on Germany - Market size and forecast 2025-2030 ($ million)
Data Table on Germany - Market size and forecast 2025-2030 ($ million)
Chart on Germany - Year-over-year growth 2025-2030 (%)
Data Table on Germany - Year-over-year growth 2025-2030 (%)

12.3.2 The Netherlands - Market size and forecast 2025-2030

Chart on The Netherlands - Market size and forecast 2025-2030 ($ million)
Data Table on The Netherlands - Market size and forecast 2025-2030 ($ million)
Chart on The Netherlands - Year-over-year growth 2025-2030 (%)
Data Table on The Netherlands - Year-over-year growth 2025-2030 (%)

12.3.3 UK - Market size and forecast 2025-2030

Chart on UK - Market size and forecast 2025-2030 ($ million)
Data Table on UK - Market size and forecast 2025-2030 ($ million)
Chart on UK - Year-over-year growth 2025-2030 (%)
Data Table on UK - Year-over-year growth 2025-2030 (%)

12.3.4 France - Market size and forecast 2025-2030

Chart on France - Market size and forecast 2025-2030 ($ million)
Data Table on France - Market size and forecast 2025-2030 ($ million)
Chart on France - Year-over-year growth 2025-2030 (%)
Data Table on France - Year-over-year growth 2025-2030 (%)

12.3.5 Italy - Market size and forecast 2025-2030

Chart on Italy - Market size and forecast 2025-2030 ($ million)
Data Table on Italy - Market size and forecast 2025-2030 ($ million)
Chart on Italy - Year-over-year growth 2025-2030 (%)
Data Table on Italy - Year-over-year growth 2025-2030 (%)

12.3.6 Spain - Market size and forecast 2025-2030

Chart on Spain - Market size and forecast 2025-2030 ($ million)
Data Table on Spain - Market size and forecast 2025-2030 ($ million)
Chart on Spain - Year-over-year growth 2025-2030 (%)
Data Table on Spain - Year-over-year growth 2025-2030 (%)

12.4 North America - Market size and forecast 2025-2030

Chart on North America - Market size and forecast 2025-2030 ($ million)
Data Table on North America - Market size and forecast 2025-2030 ($ million)
Chart on North America - Year-over-year growth 2025-2030 (%)
Data Table on North America - Year-over-year growth 2025-2030 (%)
Chart on Regional Comparison - North America
Data Table on Regional Comparison - North America

12.4.1 US - Market size and forecast 2025-2030

Chart on US - Market size and forecast 2025-2030 ($ million)
Data Table on US - Market size and forecast 2025-2030 ($ million)
Chart on US - Year-over-year growth 2025-2030 (%)
Data Table on US - Year-over-year growth 2025-2030 (%)

12.4.2 Canada - Market size and forecast 2025-2030

Chart on Canada - Market size and forecast 2025-2030 ($ million)
Data Table on Canada - Market size and forecast 2025-2030 ($ million)
Chart on Canada - Year-over-year growth 2025-2030 (%)
Data Table on Canada - Year-over-year growth 2025-2030 (%)

12.4.3 Mexico - Market size and forecast 2025-2030

Chart on Mexico - Market size and forecast 2025-2030 ($ million)
Data Table on Mexico - Market size and forecast 2025-2030 ($ million)
Chart on Mexico - Year-over-year growth 2025-2030 (%)
Data Table on Mexico - Year-over-year growth 2025-2030 (%)

12.5 APAC - Market size and forecast 2025-2030

Chart on APAC - Market size and forecast 2025-2030 ($ million)
Data Table on APAC - Market size and forecast 2025-2030 ($ million)
Chart on APAC - Year-over-year growth 2025-2030 (%)
Data Table on APAC - Year-over-year growth 2025-2030 (%)
Chart on Regional Comparison - APAC
Data Table on Regional Comparison - APAC

12.5.1 China - Market size and forecast 2025-2030

Chart on China - Market size and forecast 2025-2030 ($ million)
Data Table on China - Market size and forecast 2025-2030 ($ million)
Chart on China - Year-over-year growth 2025-2030 (%)
Data Table on China - Year-over-year growth 2025-2030 (%)

12.5.2 Japan - Market size and forecast 2025-2030

Chart on Japan - Market size and forecast 2025-2030 ($ million)
Data Table on Japan - Market size and forecast 2025-2030 ($ million)
Chart on Japan - Year-over-year growth 2025-2030 (%)
Data Table on Japan - Year-over-year growth 2025-2030 (%)

12.5.3 India - Market size and forecast 2025-2030

Chart on India - Market size and forecast 2025-2030 ($ million)
Data Table on India - Market size and forecast 2025-2030 ($ million)
Chart on India - Year-over-year growth 2025-2030 (%)
Data Table on India - Year-over-year growth 2025-2030 (%)

12.5.4 South Korea - Market size and forecast 2025-2030

Chart on South Korea - Market size and forecast 2025-2030 ($ million)
Data Table on South Korea - Market size and forecast 2025-2030 ($ million)
Chart on South Korea - Year-over-year growth 2025-2030 (%)
Data Table on South Korea - Year-over-year growth 2025-2030 (%)

12.5.5 Australia - Market size and forecast 2025-2030

Chart on Australia - Market size and forecast 2025-2030 ($ million)
Data Table on Australia - Market size and forecast 2025-2030 ($ million)
Chart on Australia - Year-over-year growth 2025-2030 (%)
Data Table on Australia - Year-over-year growth 2025-2030 (%)

12.5.6 Indonesia - Market size and forecast 2025-2030

Chart on Indonesia - Market size and forecast 2025-2030 ($ million)
Data Table on Indonesia - Market size and forecast 2025-2030 ($ million)
Chart on Indonesia - Year-over-year growth 2025-2030 (%)
Data Table on Indonesia - Year-over-year growth 2025-2030 (%)

12.6 Middle East and Africa - Market size and forecast 2025-2030

Chart on Middle East and Africa - Market size and forecast 2025-2030 ($ million)
Data Table on Middle East and Africa - Market size and forecast 2025-2030 ($ million)
Chart on Middle East and Africa - Year-over-year growth 2025-2030 (%)
Data Table on Middle East and Africa - Year-over-year growth 2025-2030 (%)
Chart on Regional Comparison - Middle East and Africa
Data Table on Regional Comparison - Middle East and Africa

12.6.1 Saudi Arabia - Market size and forecast 2025-2030

Chart on Saudi Arabia - Market size and forecast 2025-2030 ($ million)
Data Table on Saudi Arabia - Market size and forecast 2025-2030 ($ million)
Chart on Saudi Arabia - Year-over-year growth 2025-2030 (%)
Data Table on Saudi Arabia - Year-over-year growth 2025-2030 (%)

12.6.2 South Africa - Market size and forecast 2025-2030

Chart on South Africa - Market size and forecast 2025-2030 ($ million)
Data Table on South Africa - Market size and forecast 2025-2030 ($ million)
Chart on South Africa - Year-over-year growth 2025-2030 (%)
Data Table on South Africa - Year-over-year growth 2025-2030 (%)

12.6.3 UAE - Market size and forecast 2025-2030

Chart on UAE - Market size and forecast 2025-2030 ($ million)
Data Table on UAE - Market size and forecast 2025-2030 ($ million)
Chart on UAE - Year-over-year growth 2025-2030 (%)
Data Table on UAE - Year-over-year growth 2025-2030 (%)

12.6.4 Israel - Market size and forecast 2025-2030

Chart on Israel - Market size and forecast 2025-2030 ($ million)
Data Table on Israel - Market size and forecast 2025-2030 ($ million)
Chart on Israel - Year-over-year growth 2025-2030 (%)
Data Table on Israel - Year-over-year growth 2025-2030 (%)

12.6.5 Turkey - Market size and forecast 2025-2030

Chart on Turkey - Market size and forecast 2025-2030 ($ million)
Data Table on Turkey - Market size and forecast 2025-2030 ($ million)
Chart on Turkey - Year-over-year growth 2025-2030 (%)
Data Table on Turkey - Year-over-year growth 2025-2030 (%)

12.7 South America - Market size and forecast 2025-2030

Chart on South America - Market size and forecast 2025-2030 ($ million)
Data Table on South America - Market size and forecast 2025-2030 ($ million)
Chart on South America - Year-over-year growth 2025-2030 (%)
Data Table on South America - Year-over-year growth 2025-2030 (%)
Chart on Regional Comparison - South America
Data Table on Regional Comparison - South America

12.7.1 Brazil - Market size and forecast 2025-2030

Chart on Brazil - Market size and forecast 2025-2030 ($ million)
Data Table on Brazil - Market size and forecast 2025-2030 ($ million)
Chart on Brazil - Year-over-year growth 2025-2030 (%)
Data Table on Brazil - Year-over-year growth 2025-2030 (%)

12.7.2 Argentina - Market size and forecast 2025-2030

Chart on Argentina - Market size and forecast 2025-2030 ($ million)
Data Table on Argentina - Market size and forecast 2025-2030 ($ million)
Chart on Argentina - Year-over-year growth 2025-2030 (%)
Data Table on Argentina - Year-over-year growth 2025-2030 (%)

12.7.3 Chile - Market size and forecast 2025-2030

Chart on Chile - Market size and forecast 2025-2030 ($ million)
Data Table on Chile - Market size and forecast 2025-2030 ($ million)
Chart on Chile - Year-over-year growth 2025-2030 (%)
Data Table on Chile - Year-over-year growth 2025-2030 (%)

12.8 Market opportunity by geography

Market opportunity by geography ($ million)
Data Tables on Market opportunity by geography ($ million)

13. Drivers, Challenges, and Opportunity

13.1 Market drivers

Growing popularity of urban agriculture
Advances in LED lighting technology for horticultural applications
Need to improve yield of crops and reduce crop wastage

13.2 Market challenges

High ownership costs for grow lights
Constraints related to lighting complexities and crop range
Stringent regulations in North America and Europe

13.3 Impact of drivers and challenges

Impact of drivers and challenges in 2025 and 2030

13.4 Market opportunities

Application of grow lights in plant disease detection and monitoring
Rising popularity of hydroponic and soil free farming systems
Rising prominence of IoT in grow light technology

14. Competitive Landscape

14.1 Overview

14.2

Overview on criticality of inputs and factors of differentiation

14.3 Landscape disruption

Overview on factors of disruption

14.4 Industry risks

Impact of key risks on business

15. Competitive Analysis

15.1 Companies profiled

Companies covered

15.2 Company ranking index

15.3 Market positioning of companies

Matrix on companies position and classification

15.4 Aerogrow International Inc.

Aerogrow International Inc. - Overview
Aerogrow International Inc. - Product / Service
Aerogrow International Inc. - Key offerings
SWOT

15.5 Agnetix

Agnetix - Overview
Agnetix - Product / Service
Agnetix - Key offerings
SWOT

15.6 California LightWorks

California LightWorks - Overview
California LightWorks - Product / Service
California LightWorks - Key offerings
SWOT

15.7 Crecer Lighting

Crecer Lighting - Overview
Crecer Lighting - Product / Service
Crecer Lighting - Key offerings
SWOT

15.8 EVERLIGHT ELECTRONICS CO. LTD.

EVERLIGHT ELECTRONICS CO. LTD. - Overview
EVERLIGHT ELECTRONICS CO. LTD. - Product / Service
EVERLIGHT ELECTRONICS CO. LTD. - Key offerings
SWOT

15.9 General Electric Co.

General Electric Co. - Overview
General Electric Co. - Business segments
General Electric Co. - Key news
General Electric Co. - Key offerings
General Electric Co. - Segment focus
SWOT

15.10 Heliospectra AB

Heliospectra AB - Overview
Heliospectra AB - Product / Service
Heliospectra AB - Key offerings
SWOT

15.11 Koninklijke Philips NV

Koninklijke Philips NV - Overview
Koninklijke Philips NV - Business segments
Koninklijke Philips NV - Key news
Koninklijke Philips NV - Key offerings
Koninklijke Philips NV - Segment focus
SWOT

15.12 Lemnis Oreon BV

Lemnis Oreon BV - Overview
Lemnis Oreon BV - Product / Service
Lemnis Oreon BV - Key offerings
SWOT

15.13 OSRAM GmbH

OSRAM GmbH - Overview
OSRAM GmbH - Business segments
OSRAM GmbH - Key news
OSRAM GmbH - Key offerings
OSRAM GmbH - Segment focus
SWOT

15.14 Sanan Optoelectronics Co. Ltd.

Sanan Optoelectronics Co. Ltd. - Overview
Sanan Optoelectronics Co. Ltd. - Product / Service
Sanan Optoelectronics Co. Ltd. - Key offerings
SWOT

15.15 SANANBIO

SANANBIO - Overview
SANANBIO - Product / Service
SANANBIO - Key offerings
SWOT

15.16 Signify NV

Signify NV - Overview
Signify NV - Business segments
Signify NV - Key news
Signify NV - Key offerings
Signify NV - Segment focus
SWOT

15.17 Thrive Agritech

Thrive Agritech - Overview
Thrive Agritech - Product / Service
Thrive Agritech - Key offerings
SWOT

15.18 ViparSpectra

ViparSpectra - Overview
ViparSpectra - Product / Service
ViparSpectra - Key offerings
SWOT

16. Appendix

16.1 Scope of the report

Market definition
Objectives
Notes and caveats

16.2 Inclusions and exclusions checklist

Inclusions checklist
Exclusions checklist

16.3 Currency conversion rates for US$

16.4 Research methodology

16.5 Data procurement

Information sources

16.6 Data validation

16.7 Validation techniques employed for market sizing

16.8 Data synthesis

16.9 360 degree market analysis

16.10 List of abbreviations

Research Methodology

Technavio presents a detailed picture of the market by way of study, synthesis, and summation of data from multiple sources. The analysts have presented the various facets of the market with a particular focus on identifying the key industry influencers. The data thus presented is comprehensive, reliable, and the result of extensive research, both primary and secondary.

INFORMATION SOURCES

Primary sources

  • Manufacturers and suppliers
  • Channel partners
  • Industry experts
  • Strategic decision makers

Secondary sources

  • Industry journals and periodicals
  • Government data
  • Financial reports of key industry players
  • Historical data
  • Press releases

DATA ANALYSIS

Data Synthesis

  • Collation of data
  • Estimation of key figures
  • Analysis of derived insights

Data Validation

  • Triangulation with data models
  • Reference against proprietary databases
  • Corroboration with industry experts

REPORT WRITING

Qualitative

  • Market drivers
  • Market challenges
  • Market trends
  • Five forces analysis

Quantitative

  • Market size and forecast
  • Market segmentation
  • Geographical insights
  • Competitive landscape

Interested in this report?

Get your sample now to see our research methodology and insights!

Download Now

Frequently Asked Questions

Grow Light market growth will increase by USD 19565.8 million during 2026-2030.

The Grow Light market is expected to grow at a CAGR of 22.6% during 2026-2030.

Grow Light market is segmented by Application (Commercial green house, Vertical farming, Indoor farming, Research) Product (LED lights, HID, Fluorescent lights, Others) Power rating (Less than 300 watt, More than 300 watt)

Aerogrow International Inc., Agnetix, Altos India Limited, Black Dog Grow Technologies Inc., California LightWorks, Crecer Lighting, EconoLux Industries Ltd., EVERLIGHT ELECTRONICS CO. LTD., General Electric Co., Heliospectra AB, Koninklijke Philips NV, Lemnis Oreon BV, OSRAM GmbH, Sanan Optoelectronics Co. Ltd., SANANBIO, Signify NV, Thrive Agritech, ViparSpectra are a few of the key vendors in the Grow Light market.

Europe will register the highest growth rate of 31.6% among the other regions. Therefore, the Grow Light market in Europe is expected to garner significant business opportunities for the vendors during the forecast period.

Germany, The Netherlands, UK, France, Italy, Spain, US, Canada, Mexico, China, Japan, India, South Korea, Australia, Indonesia, Saudi Arabia, South Africa, UAE, Israel, Turkey, Brazil, Argentina, Chile

  • Growing popularity of urban agriculture is the driving factor this market.

The Grow Light market vendors should focus on grabbing business opportunities from the Application segment as it accounted for the largest market share in the base year.