Indoor Farming Technologies Market Size 2024-2028
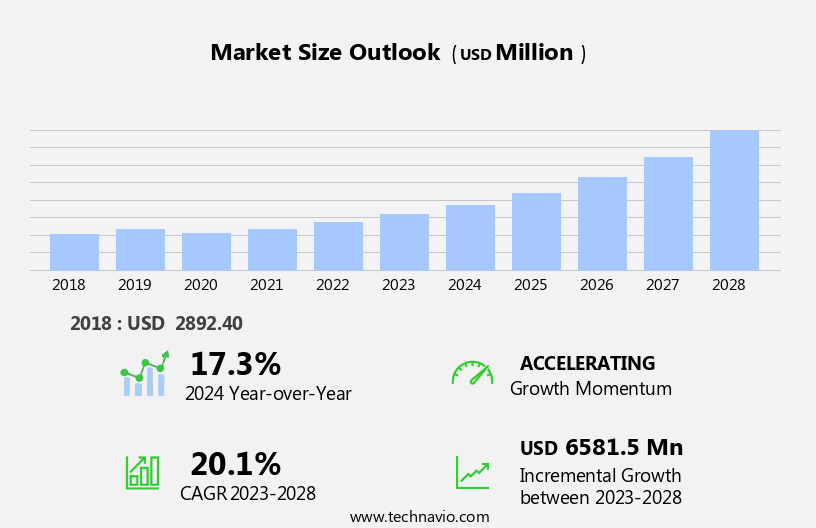
The indoor farming technologies market size is forecast to increase by USD 6.58 billion, at a CAGR of 20.1% between 2023 and 2028.
- Indoor farming technologies, including aquaponics and aeroponics, have gained significant traction due to the pressing need to improve crop yield and reduce wastage, particularly in the context of increasing food security concerns. This trend is driven by the potential for year-round production and controlled environmental conditions, which can lead to higher crop yields and improved product quality. However, the adoption of indoor farming technologies faces challenges, most notably the high energy consumption required for artificial lighting. This issue, which can significantly increase operational costs, necessitates the development of more energy-efficient lighting solutions.
- Effective management of these challenges will be crucial for companies seeking to capitalize on the opportunities presented by the indoor farming market. By focusing on innovations in energy-efficient lighting and optimizing operational processes, businesses can navigate these challenges and drive growth in this dynamic and evolving market.
What will be the Size of the Indoor Farming Technologies Market during the forecast period?

Explore in-depth regional segment analysis with market size data - historical 2018-2022 and forecasts 2024-2028 - in the full report.
Request Free Sample
Indoor farming technologies continue to evolve, shaping the agricultural landscape with innovative solutions that address food security, investment opportunities, and sustainable practices. Modular farming units and vertical farming systems, such as stackable growing structures, are gaining traction in urban areas due to their efficiency and reduced water usage. Precision agriculture techniques, including automated irrigation and climate monitoring, optimize crop yields and reduce environmental impact. Plant growth regulators and nutrient solutions enhance crop health and productivity, while pest control methods employ artificial intelligence and machine learning for disease management. Food safety is ensured through controlled environments, and LED grow lights provide energy-efficient light sources.
Vertical farming startups are revolutionizing the industry with advanced designs and data analytics, focusing on yield optimization and labor efficiency. Sustainable farming practices, such as crop rotation and water conservation, are integrated into these systems. Organic farming methods are also being explored, expanding the market's reach. Indoor farming technologies offer significant investment opportunities, with potential for high returns on investment and continuous market penetration. The integration of environmental controls and energy efficiency further solidifies their role in the future of agriculture. Microgreen production and plant phenotyping are additional applications that contribute to the sector's growth and diversity.
How is this Indoor Farming Technologies Industry segmented?
The indoor farming technologies industry research report provides comprehensive data (region-wise segment analysis), with forecasts and estimates in "USD million" for the period 2024-2028, as well as historical data from 2018-2022 for the following segments.
- Application
- Greenhouse farming
- Vertical farming
- Hydroponics
- Aeroponics
- Aquaponics
- Component
- Hardware (LED Grow Lights, HVAC Systems, Irrigation Systems, Sensors)
- Software (Farm Management Software, AI and Automation)
- Crop Type
- Fruits & Vegetables
- Herbs & Microgreens
- Flowers & Ornamentals
- Cannabis
- Geography
- North America
- Europe
- Middle East and Africa
- APAC
- South America
- Rest of World (ROW)
By Application Insights
The greenhouse farming segment is estimated to witness significant growth during the forecast period.
Indoor farming technologies have gained significant traction in the agriculture industry, driven by the increasing need for sustainable, efficient, and secure food production. Precision agriculture, a key component of this market, leverages data analytics and automation to optimize crop growth and yield. Consumer demand for fresh, locally grown produce, particularly leafy greens, fuels the adoption of indoor farming systems, including modular farming units and vertical farming. Cost analysis and energy efficiency are critical considerations for indoor farming, with LED grow lights and environmental controls playing essential roles. Water conservation is another significant benefit, especially in urban agriculture and arid regions.
Indoor farming also offers advantages in pest control, automated irrigation, and disease management through climate monitoring and artificial intelligence. Investment opportunities abound in this sector, with vertical farming startups and organic farming gaining popularity. Sustainable farming practices, such as crop rotation and nutrient solutions, further enhance the market's appeal. Machine learning and data analytics facilitate yield optimization and plant phenotyping, while plant growth regulators ensure consistent, high-quality produce. Market penetration for indoor farming technologies continues to expand, with market leaders focusing on energy efficiency, return on investment, and microgreen production. The integration of these technologies in greenhouse farming enhances food security and offers a harmonious balance between labor efficiency and climate control.

Request Free Sample
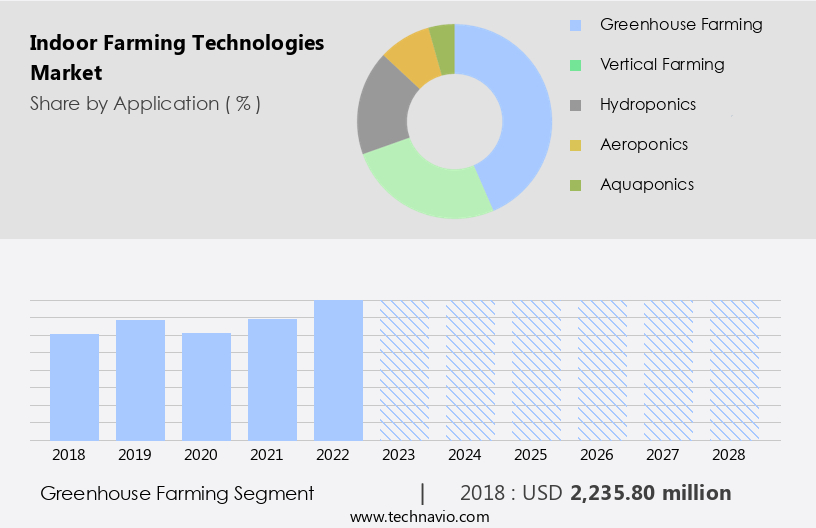
The Greenhouse farming segment was valued at USD 2.24 billion in 2018 and showed a gradual increase during the forecast period.
Regional Analysis
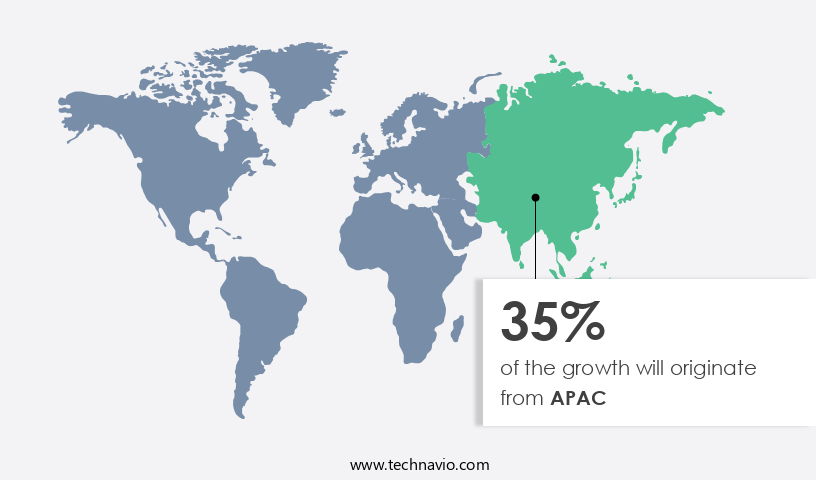
APAC is estimated to contribute 35% to the growth of the global market during the forecast period.Technavio's analysts have elaborately explained the regional trends and drivers that shape the market during the forecast period.

Request Free Sample
Indoor farming technologies have gained significant traction in the European Union (EU) as farmers seek sustainable alternatives to traditional outdoor farming methods. With increasing concerns over surface pollution, groundwater issues, loss of biodiversity, soil erosion, and health risks associated with insecticides, indoor farming is becoming an attractive solution. Moreover, the need for food security due to population growth is another driving factor. The Netherlands, France, Germany, Spain, and the UK are key countries in the EU the market. Precision agriculture and modular farming units are integral to this trend, allowing for cost analysis, crop rotation, and water conservation.
Urban agriculture is also gaining popularity, with indoor growing systems providing food security in densely populated areas. Pest control, automated irrigation, and climate monitoring are essential components of these systems, ensuring food safety and disease management. Sustainable farming practices, such as LED grow lights, environmental controls, and labor efficiency, are increasingly adopted in indoor farming. Vertical farming startups and plant phenotyping have revolutionized yield optimization, while organic farming and machine learning enable data analytics and energy efficiency. Nutrient solutions and controlled environment agriculture further enhance crop production. Investment opportunities abound in this sector, with plant growth regulators, yield optimization, and market penetration being key areas of focus.
Artificial intelligence and vertical farm design play a crucial role in optimizing operations and reducing costs. As the indoor farming market continues to evolve, it offers significant potential for return on investment, particularly in microgreen production.
Market Dynamics
Our researchers analyzed the data with 2023 as the base year, along with the key drivers, trends, and challenges. A holistic analysis of drivers will help companies refine their marketing strategies to gain a competitive advantage.
Indoor farming technologies have revolutionized agriculture, enabling the production of fresh, locally grown produce year-round. These advanced systems utilize hydroponics, aeroponics, and vertical farming techniques to optimize resource usage and maximize crop yield. LED lighting, temperature and humidity control, and automated irrigation systems ensure ideal growing conditions. Sensors monitor plant health and nutrient levels, while precision farming software allows for real-time data analysis. Indoor farming also reduces water usage and eliminates the need for harmful pesticides, making it an eco-friendly alternative. With urbanization and population growth, this market is poised for significant expansion, offering opportunities for tech innovations and sustainable agriculture solutions. The future of indoor farming is bright, with continued advancements in automation, energy efficiency, and crop diversity.
What are the key market drivers leading to the rise in the adoption of Indoor Farming Technologies Industry?
- The market growth is driven by the need to enhance crop yields in urban settings, which is achievable through various indoor farming technologies.
- To enhance agricultural productivity and minimize crop losses, there is a pressing need in the market to improve crop yields and reduce wastage. Indoor farming, also known as controlled environment agriculture, has gained significant traction in both small and large-scale commercial production. This farming method is particularly popular in urban areas where land availability is limited. In such environments, indoor farming plays a crucial role in augmenting local food supplies and ensuring access to fresh produce for communities. Compared to traditional outdoor farming, indoor farming enables the production of greater crop yields in a smaller area.
- For instance, Sky Greens' patented vertical farming system can intensify land use and yield up to ten times more produce per unit area compared to monolayer farms. This technology, along with others, contributes to the growth of the global indoor farming market. The use of advanced technologies such as hydroponics, aeroponics, and LED lighting systems allows for optimal crop growth conditions, resulting in higher yields and improved product quality. Overall, the indoor farming market is poised for growth due to its ability to address the challenges of land scarcity and the demand for locally grown, fresh produce in urban areas.
What are the market trends shaping the Indoor Farming Technologies Industry?
- The requirement for food security is becoming increasingly more significant in today's market. A trend that is both noteworthy and essential for professionals to acknowledge.
- Indoor farming technologies have gained significant traction in response to increasing consumer demand for locally grown, fresh produce and the need for food security, particularly in urban areas. Precision agriculture techniques, such as modular farming units and automated irrigation systems, enable efficient use of resources, including water conservation and effective pest control. Indoor farming offers several advantages, including the ability to practice crop rotation year-round, reducing the environmental impact of transportation, and minimizing the use of synthetic fertilizers and pesticides.
- The cost analysis of indoor farming is favorable due to controlled growing conditions and reduced reliance on external factors. Urban agriculture initiatives have further fueled the growth of indoor farming, providing opportunities for local food production and community engagement. Overall, indoor farming technologies offer a harmonious solution to address food security challenges, while also promoting sustainable agricultural practices.
What challenges does the Indoor Farming Technologies Industry face during its growth?
- The growth of the industry is significantly impacted by the complexities and intricacies of implementing artificial lighting as an alternative to natural light.
- Indoor farming technologies, which utilize controlled environments for plant growth, present significant opportunities for food security and sustainable farming. These systems employ advanced technologies such as plant growth regulators, artificial intelligence, climate monitoring, and disease management to optimize plant growth and ensure food safety. However, one challenge is the use of indoor growing systems with LED lighting, which may not efficiently deliver the necessary light for plant growth and can result in high electricity bills. While indoor LED lights have advanced to mimic sunlight, they cannot fully replicate the emission wavelength of natural sunlight.
- Despite this limitation, the indoor farming market continues to grow, driven by the need for year-round production, reduced water usage, and increased crop yields. Investors are taking notice of this trend, recognizing the potential for profitable returns in this dynamic industry.
Exclusive Customer Landscape
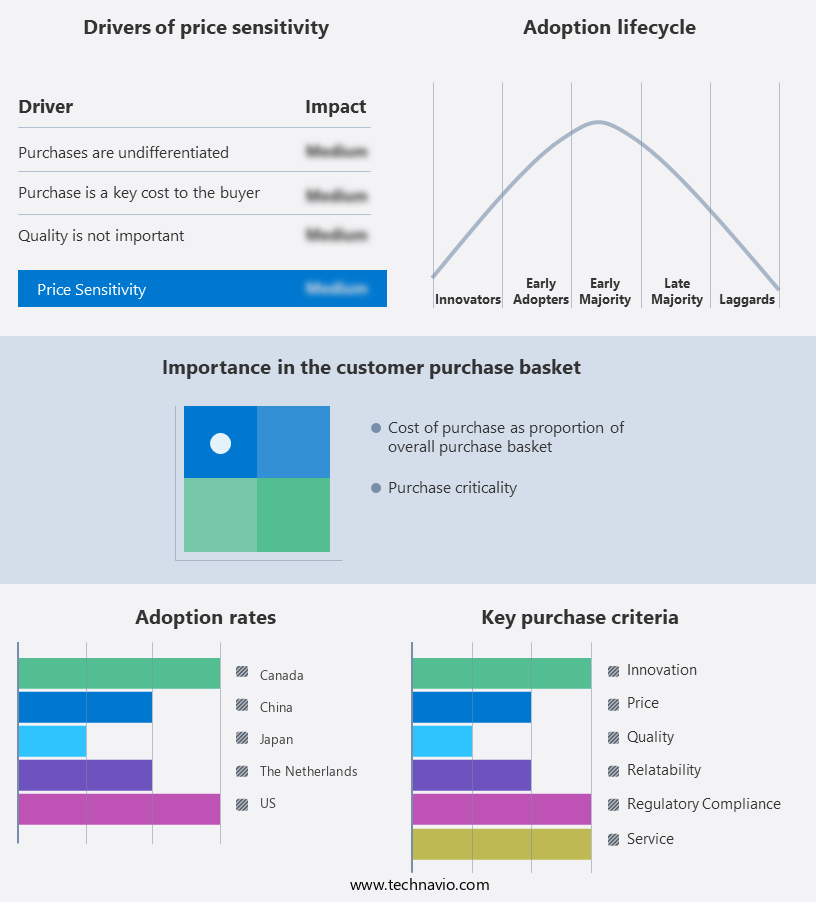
The indoor farming technologies market forecasting report includes the adoption lifecycle of the market, covering from the innovator's stage to the laggard's stage. It focuses on adoption rates in different regions based on penetration. Furthermore, the indoor farming technologies market report also includes key purchase criteria and drivers of price sensitivity to help companies evaluate and develop their market growth analysis strategies.

Customer Landscape
Key Companies & Market Insights
Companies are implementing various strategies, such as strategic alliances, indoor farming technologies market forecast, partnerships, mergers and acquisitions, geographical expansion, and product/service launches, to enhance their presence in the industry.
AeroFarms - The company specializes in advanced indoor farming technologies, including the innovative Raging Kale 2.0 system. This cutting-edge solution optimizes plant growth through precise environmental control and efficient resource utilization.
The industry research and growth report includes detailed analyses of the competitive landscape of the market and information about key companies, including:
- AeroFarms
- Agri-Sense
- Bowery Farming
- BrightFarms
- Freight Farms
- Gotham Greens
- Green Sense Farms LLC
- Infarm
- Lettuce Grow
- Local Bounti Corporation
- Netafim (Orbia)
- Plenty Unlimited Inc.
- Priva
- Sananbio
- Signify Holding
- Superior Fresh
- Vertical Harvest
- Village Farms International, Inc.
- Voelker Equipment
- ZipGrow Inc.
Qualitative and quantitative analysis of companies has been conducted to help clients understand the wider business environment as well as the strengths and weaknesses of key industry players. Data is qualitatively analyzed to categorize companies as pure play, category-focused, industry-focused, and diversified; it is quantitatively analyzed to categorize companies as dominant, leading, strong, tentative, and weak.
Recent Development and News in Indoor Farming Technologies Market
- In January 2024, Plenty, a leading indoor farming company, announced the launch of its new hydroponic farming system, the 'Harvest Cube,' designed to increase yield by 30% and reduce water usage by 90% compared to traditional farming methods (Plenty Press Release).
- In March 2024, BrightFarms, a leading vertical farming company, entered into a strategic partnership with Walmart, the world's largest retailer, to expand its supply chain and increase the availability of locally grown produce in Walmart stores (Walmart Press Release).
- In May 2024, Infarm, a German urban farming startup, raised a USD200 million Series D funding round, bringing its total funding to over USD370 million, to expand its operations and further develop its vertical farming technology (Infarm Press Release).
- In February 2025, the European Union approved the use of hydroponic and aeroponic farming methods under its Organic Farming Regulation, paving the way for the adoption of indoor farming technologies in the European organic farming sector (European Commission Press Release).
Research Analyst Overview
- Indoor farming technologies have gained significant traction in the global market, with yield forecasting and precision farming tools playing crucial roles in optimizing crop production. Indoor climate control, achieved through advanced HVAC systems and LED lighting technology, ensures consistent growing conditions. Vertical farming economics are shaped by factors such as energy management, water recycling, and urban farming regulations. Growth monitoring through plant sensors and genetic modification enable farmers to optimize nutrient intake and improve crop health. Smart agriculture, including automated harvesting and hydroponic nutrient systems, streamlines operations and enhances sustainability assessments. Urban farming projects utilizing aeroponic towers, nutrient film technique, and cultivation chambers are transforming food distribution in densely populated areas.
- Vertical farm development relies on seed selection, plant breeding, and vertical farming infrastructure to maximize space utilization and consumer acceptance. Local sourcing and sustainable practices further boost the market's appeal. Indoor farming research continues to advance, driving innovation in areas like air filtration and urban farming projects.
Dive into Technavio's robust research methodology, blending expert interviews, extensive data synthesis, and validated models for unparalleled Indoor Farming Technologies Market insights. See full methodology.
Market Scope
|
Report Coverage
|
Details
|
Page number
|
136
|
Base year
|
2023
|
Historic period
|
2018-2022 |
Forecast period
|
2024-2028
|
Growth momentum & CAGR
|
Accelerate at a CAGR of 20.1%
|
Market growth 2024-2028
|
USD 6581.5 million
|
Market structure
|
Fragmented
|
YoY growth 2023-2024(%)
|
17.3
|
Key countries
|
US, Canada, Germany, UK, Italy, France, China, India, Japan, Brazil, Egypt, UAE, Oman, Argentina, KSA, UAE, Brazil, and Rest of World (ROW)
|
Competitive landscape
|
Leading Companies, Market Positioning of Companies, Competitive Strategies, and Industry Risks
|
Request Free Sample
What are the Key Data Covered in this Indoor Farming Technologies Market Research and Growth Report?
- CAGR of the Indoor Farming Technologies industry during the forecast period
- Detailed information on factors that will drive the growth and forecasting between 2024 and 2028
- Precise estimation of the size of the market and its contribution of the industry in focus to the parent market
- Accurate predictions about upcoming growth and trends and changes in consumer behaviour
- Growth of the market across Europe, APAC, North America, South America, and Middle East and Africa
- Thorough analysis of the market's competitive landscape and detailed information about companies
- Comprehensive analysis of factors that will challenge the indoor farming technologies market growth of industry companies
We can help! Our analysts can customize this indoor farming technologies market research report to meet your requirements.
Get in touch
1 Executive Summary
- 1.1 Market overview
- Executive Summary - Chart on Market Overview
- Executive Summary - Data Table on Market Overview
- Executive Summary - Chart on Global Market Characteristics
- Executive Summary - Chart on Market by Geography
- Executive Summary - Chart on Market Segmentation by Application
- Executive Summary - Chart on Incremental Growth
- Executive Summary - Data Table on Incremental Growth
- Executive Summary - Chart on Company Market Positioning
2 Market Landscape
- 2.1 Market ecosystem
- Parent Market
- Data Table on - Parent Market
- 2.2 Market characteristics
- Market characteristics analysis
3 Market Sizing
- 3.1 Market definition
- Offerings of companies included in the market definition
- 3.2 Market segment analysis
- 3.4 Market outlook: Forecast for 2023-2028
- Chart on Global - Market size and forecast 2023-2028 ($ million)
- Data Table on Global - Market size and forecast 2023-2028 ($ million)
- Chart on Global Market: Year-over-year growth 2023-2028 (%)
- Data Table on Global Market: Year-over-year growth 2023-2028 (%)
4 Historic Market Size
- 4.1 Global Indoor Farming Technologies Market 2018 - 2022
- Historic Market Size - Data Table on Global Indoor Farming Technologies Market 2018 - 2022 ($ million)
- 4.2 Application segment analysis 2018 - 2022
- Historic Market Size - Application Segment 2018 - 2022 ($ million)
- 4.3 Geography segment analysis 2018 - 2022
- Historic Market Size - Geography Segment 2018 - 2022 ($ million)
- 4.4 Country segment analysis 2018 - 2022
- Historic Market Size - Country Segment 2018 - 2022 ($ million)
5 Five Forces Analysis
- 5.1 Five forces summary
- Five forces analysis - Comparison between 2023 and 2028
- 5.2 Bargaining power of buyers
- Bargaining power of buyers - Impact of key factors 2023 and 2028
- 5.3 Bargaining power of suppliers
- Bargaining power of suppliers - Impact of key factors in 2023 and 2028
- 5.4 Threat of new entrants
- Threat of new entrants - Impact of key factors in 2023 and 2028
- 5.5 Threat of substitutes
- Threat of substitutes - Impact of key factors in 2023 and 2028
- 5.6 Threat of rivalry
- Threat of rivalry - Impact of key factors in 2023 and 2028
- 5.7 Market condition
- Chart on Market condition - Five forces 2023 and 2028
6 Market Segmentation by Application
- 6.1 Market segments
- Chart on Application - Market share (2023-2028) (%)
- Data Table on Application - Market share (2023-2028) (%)
- 6.2 Comparison by Application
- Chart on Comparison by Application
- Data Table on Comparison by Application
- 6.3 Greenhouse farming - Market size and forecast (2023-2028)
- Chart on Greenhouse farming - Market size and forecast (2023-2028) ($ million)
- Data Table on Greenhouse farming - Market size and forecast (2023-2028) ($ million)
- Chart on Greenhouse farming - Year-over-year growth (2023-2028) (%)
- Data Table on Greenhouse farming - Year-over-year growth (2023-2028) (%)
- 6.4 Vertical farming - Market size and forecast (2023-2028)
- Chart on Vertical farming - Market size and forecast (2023-2028) ($ million)
- Data Table on Vertical farming - Market size and forecast (2023-2028) ($ million)
- Chart on Vertical farming - Year-over-year growth (2023-2028) (%)
- Data Table on Vertical farming - Year-over-year growth (2023-2028) (%)
- 6.5 Hydroponics - Market size and forecast (2023-2028)
- Chart on Hydroponics - Market size and forecast (2023-2028) ($ million)
- Data Table on Hydroponics - Market size and forecast (2023-2028) ($ million)
- Chart on Hydroponics - Year-over-year growth (2023-2028) (%)
- Data Table on Hydroponics - Year-over-year growth (2023-2028) (%)
- 6.6 Aeroponics - Market size and forecast (2023-2028)
- Chart on Aeroponics - Market size and forecast (2023-2028) ($ million)
- Data Table on Aeroponics - Market size and forecast (2023-2028) ($ million)
- Chart on Aeroponics - Year-over-year growth (2023-2028) (%)
- Data Table on Aeroponics - Year-over-year growth (2023-2028) (%)
- 6.7 Aquaponics - Market size and forecast (2023-2028)
- Chart on Aquaponics - Market size and forecast (2023-2028) ($ million)
- Data Table on Aquaponics - Market size and forecast (2023-2028) ($ million)
- Chart on Aquaponics - Year-over-year growth (2023-2028) (%)
- Data Table on Aquaponics - Year-over-year growth (2023-2028) (%)
- 6.8 Market opportunity by Application
- Market opportunity by Application ($ million)
- Data Table on Market opportunity by Application ($ million)
7 Market Segmentation by Component
- 7.1 Market segments
- Chart on Component - Market share (2023-2028) (%)
- Data Table on Component - Market share (2023-2028) (%)
- 7.2 Comparison by Component
- Chart on Comparison by Component
- Data Table on Comparison by Component
- 7.3 Hardware (LED Grow Lights, HVAC Systems, Irrigation Systems, Sensors) - Market size and forecast (2023-2028)
- Chart on Hardware (LED Grow Lights, HVAC Systems, Irrigation Systems, Sensors) - Market size and forecast (2023-2028) ($ million)
- Data Table on Hardware (LED Grow Lights, HVAC Systems, Irrigation Systems, Sensors) - Market size and forecast (2023-2028) ($ million)
- Chart on Hardware (LED Grow Lights, HVAC Systems, Irrigation Systems, Sensors) - Year-over-year growth (2023-2028) (%)
- Data Table on Hardware (LED Grow Lights, HVAC Systems, Irrigation Systems, Sensors) - Year-over-year growth (2023-2028) (%)
- 7.4 Software (Farm Management Software, AI and Automation) - Market size and forecast (2023-2028)
- Chart on Software (Farm Management Software, AI and Automation) - Market size and forecast (2023-2028) ($ million)
- Data Table on Software (Farm Management Software, AI and Automation) - Market size and forecast (2023-2028) ($ million)
- Chart on Software (Farm Management Software, AI and Automation) - Year-over-year growth (2023-2028) (%)
- Data Table on Software (Farm Management Software, AI and Automation) - Year-over-year growth (2023-2028) (%)
- 7.5 Market opportunity by Component
- Market opportunity by Component ($ million)
- Data Table on Market opportunity by Component ($ million)
8 Market Segmentation by Crop Type
- 8.1 Market segments
- Chart on Crop Type - Market share (2023-2028) (%)
- Data Table on Crop Type - Market share (2023-2028) (%)
- 8.2 Comparison by Crop Type
- Chart on Comparison by Crop Type
- Data Table on Comparison by Crop Type
- 8.3 Fruits & Vegetables - Market size and forecast (2023-2028)
- Chart on Fruits & Vegetables - Market size and forecast (2023-2028) ($ million)
- Data Table on Fruits & Vegetables - Market size and forecast (2023-2028) ($ million)
- Chart on Fruits & Vegetables - Year-over-year growth (2023-2028) (%)
- Data Table on Fruits & Vegetables - Year-over-year growth (2023-2028) (%)
- 8.4 Herbs & Microgreens - Market size and forecast (2023-2028)
- Chart on Herbs & Microgreens - Market size and forecast (2023-2028) ($ million)
- Data Table on Herbs & Microgreens - Market size and forecast (2023-2028) ($ million)
- Chart on Herbs & Microgreens - Year-over-year growth (2023-2028) (%)
- Data Table on Herbs & Microgreens - Year-over-year growth (2023-2028) (%)
- 8.5 Flowers & Ornamentals - Market size and forecast (2023-2028)
- Chart on Flowers & Ornamentals - Market size and forecast (2023-2028) ($ million)
- Data Table on Flowers & Ornamentals - Market size and forecast (2023-2028) ($ million)
- Chart on Flowers & Ornamentals - Year-over-year growth (2023-2028) (%)
- Data Table on Flowers & Ornamentals - Year-over-year growth (2023-2028) (%)
- 8.6 Cannabis - Market size and forecast (2023-2028)
- Chart on Cannabis - Market size and forecast (2023-2028) ($ million)
- Data Table on Cannabis - Market size and forecast (2023-2028) ($ million)
- Chart on Cannabis - Year-over-year growth (2023-2028) (%)
- Data Table on Cannabis - Year-over-year growth (2023-2028) (%)
- 8.7 Market opportunity by Crop Type
- Market opportunity by Crop Type ($ million)
- Data Table on Market opportunity by Crop Type ($ million)
9 Customer Landscape
- 9.1 Customer landscape overview
- Analysis of price sensitivity, lifecycle, customer purchase basket, adoption rates, and purchase criteria
10 Geographic Landscape
- 10.1 Geographic segmentation
- Chart on Market share by geography 2023-2028 (%)
- Data Table on Market share by geography 2023-2028 (%)
- 10.2 Geographic comparison
- Chart on Geographic comparison
- Data Table on Geographic comparison
- 10.3 Europe - Market size and forecast 2023-2028
- Chart on Europe - Market size and forecast 2023-2028 ($ million)
- Data Table on Europe - Market size and forecast 2023-2028 ($ million)
- Chart on Europe - Year-over-year growth 2023-2028 (%)
- Data Table on Europe - Year-over-year growth 2023-2028 (%)
- 10.4 APAC - Market size and forecast 2023-2028
- Chart on APAC - Market size and forecast 2023-2028 ($ million)
- Data Table on APAC - Market size and forecast 2023-2028 ($ million)
- Chart on APAC - Year-over-year growth 2023-2028 (%)
- Data Table on APAC - Year-over-year growth 2023-2028 (%)
- 10.5 North America - Market size and forecast 2023-2028
- Chart on North America - Market size and forecast 2023-2028 ($ million)
- Data Table on North America - Market size and forecast 2023-2028 ($ million)
- Chart on North America - Year-over-year growth 2023-2028 (%)
- Data Table on North America - Year-over-year growth 2023-2028 (%)
- 10.6 South America - Market size and forecast 2023-2028
- Chart on South America - Market size and forecast 2023-2028 ($ million)
- Data Table on South America - Market size and forecast 2023-2028 ($ million)
- Chart on South America - Year-over-year growth 2023-2028 (%)
- Data Table on South America - Year-over-year growth 2023-2028 (%)
- 10.7 Middle East and Africa - Market size and forecast 2023-2028
- Chart on Middle East and Africa - Market size and forecast 2023-2028 ($ million)
- Data Table on Middle East and Africa - Market size and forecast 2023-2028 ($ million)
- Chart on Middle East and Africa - Year-over-year growth 2023-2028 (%)
- Data Table on Middle East and Africa - Year-over-year growth 2023-2028 (%)
- 10.8 US - Market size and forecast 2023-2028
- Chart on US - Market size and forecast 2023-2028 ($ million)
- Data Table on US - Market size and forecast 2023-2028 ($ million)
- Chart on US - Year-over-year growth 2023-2028 (%)
- Data Table on US - Year-over-year growth 2023-2028 (%)
- 10.9 The Netherlands - Market size and forecast 2023-2028
- Chart on The Netherlands - Market size and forecast 2023-2028 ($ million)
- Data Table on The Netherlands - Market size and forecast 2023-2028 ($ million)
- Chart on The Netherlands - Year-over-year growth 2023-2028 (%)
- Data Table on The Netherlands - Year-over-year growth 2023-2028 (%)
- 10.10 Japan - Market size and forecast 2023-2028
- Chart on Japan - Market size and forecast 2023-2028 ($ million)
- Data Table on Japan - Market size and forecast 2023-2028 ($ million)
- Chart on Japan - Year-over-year growth 2023-2028 (%)
- Data Table on Japan - Year-over-year growth 2023-2028 (%)
- 10.11 China - Market size and forecast 2023-2028
- Chart on China - Market size and forecast 2023-2028 ($ million)
- Data Table on China - Market size and forecast 2023-2028 ($ million)
- Chart on China - Year-over-year growth 2023-2028 (%)
- Data Table on China - Year-over-year growth 2023-2028 (%)
- 10.12 Canada - Market size and forecast 2023-2028
- Chart on Canada - Market size and forecast 2023-2028 ($ million)
- Data Table on Canada - Market size and forecast 2023-2028 ($ million)
- Chart on Canada - Year-over-year growth 2023-2028 (%)
- Data Table on Canada - Year-over-year growth 2023-2028 (%)
- 10.13 Market opportunity by geography
- Market opportunity by geography ($ million)
- Data Tables on Market opportunity by geography ($ million)
- 10.14 Germany - Market size and forecast (2023-2028)
- Chart on Germany - Market size and forecast (2023-2028) ($ million)
- Data Table on Germany - Market size and forecast (2023-2028) ($ million)
- Chart on Germany - Year-over-year growth (2023-2028) (%)
- Data Table on Germany - Year-over-year growth (2023-2028) (%)
- 10.15 UK - Market size and forecast (2023-2028)
- Chart on UK - Market size and forecast (2023-2028) ($ million)
- Data Table on UK - Market size and forecast (2023-2028) ($ million)
- Chart on UK - Year-over-year growth (2023-2028) (%)
- Data Table on UK - Year-over-year growth (2023-2028) (%)
- 10.16 Italy - Market size and forecast (2023-2028)
- Chart on Italy - Market size and forecast (2023-2028) ($ million)
- Data Table on Italy - Market size and forecast (2023-2028) ($ million)
- Chart on Italy - Year-over-year growth (2023-2028) (%)
- Data Table on Italy - Year-over-year growth (2023-2028) (%)
- 10.17 France - Market size and forecast (2023-2028)
- Chart on France - Market size and forecast (2023-2028) ($ million)
- Data Table on France - Market size and forecast (2023-2028) ($ million)
- Chart on France - Year-over-year growth (2023-2028) (%)
- Data Table on France - Year-over-year growth (2023-2028) (%)
- 10.18 India - Market size and forecast (2023-2028)
- Chart on India - Market size and forecast (2023-2028) ($ million)
- Data Table on India - Market size and forecast (2023-2028) ($ million)
- Chart on India - Year-over-year growth (2023-2028) (%)
- Data Table on India - Year-over-year growth (2023-2028) (%)
- 10.19 Brazil - Market size and forecast (2023-2028)
- Chart on Brazil - Market size and forecast (2023-2028) ($ million)
- Data Table on Brazil - Market size and forecast (2023-2028) ($ million)
- Chart on Brazil - Year-over-year growth (2023-2028) (%)
- Data Table on Brazil - Year-over-year growth (2023-2028) (%)
- 10.20 Egypt - Market size and forecast (2023-2028)
- Chart on Egypt - Market size and forecast (2023-2028) ($ million)
- Data Table on Egypt - Market size and forecast (2023-2028) ($ million)
- Chart on Egypt - Year-over-year growth (2023-2028) (%)
- Data Table on Egypt - Year-over-year growth (2023-2028) (%)
- 10.21 UAE - Market size and forecast (2023-2028)
- Chart on UAE - Market size and forecast (2023-2028) ($ million)
- Data Table on UAE - Market size and forecast (2023-2028) ($ million)
- Chart on UAE - Year-over-year growth (2023-2028) (%)
- Data Table on UAE - Year-over-year growth (2023-2028) (%)
- 10.22 Oman - Market size and forecast (2023-2028)
- Chart on Oman - Market size and forecast (2023-2028) ($ million)
- Data Table on Oman - Market size and forecast (2023-2028) ($ million)
- Chart on Oman - Year-over-year growth (2023-2028) (%)
- Data Table on Oman - Year-over-year growth (2023-2028) (%)
- 10.23 Argentina - Market size and forecast (2023-2028)
- Chart on Argentina - Market size and forecast (2023-2028) ($ million)
- Data Table on Argentina - Market size and forecast (2023-2028) ($ million)
- Chart on Argentina - Year-over-year growth (2023-2028) (%)
- Data Table on Argentina - Year-over-year growth (2023-2028) (%)
- 10.24 KSA - Market size and forecast (2023-2028)
- Chart on KSA - Market size and forecast (2023-2028) ($ million)
- Data Table on KSA - Market size and forecast (2023-2028) ($ million)
- Chart on KSA - Year-over-year growth (2023-2028) (%)
- Data Table on KSA - Year-over-year growth (2023-2028) (%)
- 10.25 Rest of World (ROW) - Market size and forecast (2023-2028)
- Chart on Rest of World (ROW) - Market size and forecast (2023-2028) ($ million)
- Data Table on Rest of World (ROW) - Market size and forecast (2023-2028) ($ million)
- Chart on Rest of World (ROW) - Year-over-year growth (2023-2028) (%)
- Data Table on Rest of World (ROW) - Year-over-year growth (2023-2028) (%)
11 Drivers, Challenges, and Opportunity/Restraints
- 11.3 Impact of drivers and challenges
- Impact of drivers and challenges in 2023 and 2028
- 11.4 Market opportunities/restraints
12 Competitive Landscape
- 12.2 Competitive Landscape
- Overview on criticality of inputs and factors of differentiation
- 12.3 Landscape disruption
- Overview on factors of disruption
- 12.4 Industry risks
- Impact of key risks on business
13 Competitive Analysis
- 13.2 Market positioning of companies
- Matrix on companies position and classification
- 13.3 AeroFarms
- AeroFarms - Overview
- AeroFarms - Product / Service
- AeroFarms - Key offerings
- 13.4 Agri-Sense
- Agri-Sense - Overview
- Agri-Sense - Product / Service
- Agri-Sense - Key offerings
- 13.5 Bowery Farming
- Bowery Farming - Overview
- Bowery Farming - Product / Service
- Bowery Farming - Key offerings
- 13.6 BrightFarms
- BrightFarms - Overview
- BrightFarms - Product / Service
- BrightFarms - Key offerings
- 13.7 Freight Farms
- Freight Farms - Overview
- Freight Farms - Product / Service
- Freight Farms - Key offerings
- 13.8 Gotham Greens
- Gotham Greens - Overview
- Gotham Greens - Product / Service
- Gotham Greens - Key offerings
- 13.9 Green Sense Farms LLC
- Green Sense Farms LLC - Overview
- Green Sense Farms LLC - Product / Service
- Green Sense Farms LLC - Key offerings
- 13.10 Infarm
- Infarm - Overview
- Infarm - Product / Service
- Infarm - Key offerings
- 13.11 Lettuce Grow
- Lettuce Grow - Overview
- Lettuce Grow - Product / Service
- Lettuce Grow - Key offerings
- 13.12 Local Bounti Corporation
- Local Bounti Corporation - Overview
- Local Bounti Corporation - Product / Service
- Local Bounti Corporation - Key offerings
- 13.13 Netafim (Orbia)
- Netafim (Orbia) - Overview
- Netafim (Orbia) - Product / Service
- Netafim (Orbia) - Key offerings
- 13.14 Plenty Unlimited Inc.
- Plenty Unlimited Inc. - Overview
- Plenty Unlimited Inc. - Product / Service
- Plenty Unlimited Inc. - Key offerings
- 13.15 Priva
- Priva - Overview
- Priva - Product / Service
- Priva - Key offerings
- 13.16 Sananbio
- Sananbio - Overview
- Sananbio - Product / Service
- Sananbio - Key offerings
- 13.17 Signify Holding
- Signify Holding - Overview
- Signify Holding - Product / Service
- Signify Holding - Key offerings
- 13.18 Superior Fresh
- Superior Fresh - Overview
- Superior Fresh - Product / Service
- Superior Fresh - Key offerings
- 13.19 Vertical Harvest
- Vertical Harvest - Overview
- Vertical Harvest - Product / Service
- Vertical Harvest - Key offerings
- 13.20 Village Farms International, Inc.
- Village Farms International, Inc. - Overview
- Village Farms International, Inc. - Product / Service
- Village Farms International, Inc. - Key offerings
- 13.21 Voelker Equipment
- Voelker Equipment - Overview
- Voelker Equipment - Product / Service
- Voelker Equipment - Key offerings
- 13.22 ZipGrow Inc.
- ZipGrow Inc. - Overview
- ZipGrow Inc. - Product / Service
- ZipGrow Inc. - Key offerings
- 13.23 Advanced Grow Lights American Co.
- Advanced Grow Lights American Co. - Overview
- Advanced Grow Lights American Co. - Product / Service
- Advanced Grow Lights American Co. - Key offerings
- 13.24 Agrowtek Inc.
- Agrowtek Inc. - Overview
- Agrowtek Inc. - Product / Service
- Agrowtek Inc. - Key offerings
- 13.25 Argus Control Systems Ltd.
- Argus Control Systems Ltd. - Overview
- Argus Control Systems Ltd. - Product / Service
- Argus Control Systems Ltd. - Key offerings
- 13.26 California LightWorks
- California LightWorks - Overview
- California LightWorks - Product / Service
- California LightWorks - Key offerings
- 13.27 Certhon Build B.V.
- Certhon Build B.V. - Overview
- Certhon Build B.V. - Product / Service
- Certhon Build B.V. - Key offerings
- 13.28 Dalsem Greenhouse Projects BV
- Dalsem Greenhouse Projects BV - Overview
- Dalsem Greenhouse Projects BV - Product / Service
- Dalsem Greenhouse Projects BV - Key offerings
- 13.29 General Electric Co.
- General Electric Co. - Overview
- General Electric Co. - Product / Service
- General Electric Co. - Key offerings
- 13.30 GreenTech Agro LLC
- GreenTech Agro LLC - Overview
- GreenTech Agro LLC - Product / Service
- GreenTech Agro LLC - Key offerings
- 13.31 Growlink
- Growlink - Overview
- Growlink - Product / Service
- Growlink - Key offerings
- 13.32 Honeywell International Inc.
- Honeywell International Inc. - Overview
- Honeywell International Inc. - Product / Service
- Honeywell International Inc. - Key offerings
- 13.33 Industries Harnois Inc.
- Industries Harnois Inc. - Overview
- Industries Harnois Inc. - Product / Service
- Industries Harnois Inc. - Key offerings
- 13.34 KCC Companies
- KCC Companies - Overview
- KCC Companies - Product / Service
- KCC Companies - Key offerings
- 13.35 Koninklijke Philips N.V.
- Koninklijke Philips N.V. - Overview
- Koninklijke Philips N.V. - Product / Service
- Koninklijke Philips N.V. - Key offerings
- 13.36 Link4 Corp.
- Link4 Corp. - Overview
- Link4 Corp. - Product / Service
- Link4 Corp. - Key offerings
- 13.37 LumiGrow Inc
- LumiGrow Inc - Overview
- LumiGrow Inc - Product / Service
- LumiGrow Inc - Key offerings
- 13.38 Motorleaf
- Motorleaf - Overview
- Motorleaf - Product / Service
- Motorleaf - Key offerings
- 13.39 Richel Group SAS
- Richel Group SAS - Overview
- Richel Group SAS - Product / Service
- Richel Group SAS - Key offerings
- 13.40 Urban Crop Solutions
- Urban Crop Solutions - Overview
- Urban Crop Solutions - Product / Service
- Urban Crop Solutions - Key offerings
- 13.41 Vertical Farm Systems Pty Ltd
- Vertical Farm Systems Pty Ltd - Overview
- Vertical Farm Systems Pty Ltd - Product / Service
- Vertical Farm Systems Pty Ltd - Key offerings
- 13.42 ZipGrow Inc.
- ZipGrow Inc. - Overview
- ZipGrow Inc. - Product / Service
- ZipGrow Inc. - Key offerings
14 Appendix
- 14.2 Inclusions and exclusions checklist
- Inclusions checklist
- Exclusions checklist
- 14.3 Currency conversion rates for US$
- Currency conversion rates for US$
- 14.4 Research methodology
- 14.7 Validation techniques employed for market sizing
- Validation techniques employed for market sizing
- 14.9 360 degree market analysis
- 360 degree market analysis
- 14.10 List of abbreviations