Handicrafts Market Analysis, Size, and Forecast 2026-2030: North America (US, Canada, and Mexico), Europe (Germany, France, and UK), APAC (India, China, and Indonesia), Middle East and Africa (Turkey, South Africa, and UAE), South America (Brazil and Argentina), and Rest of World (ROW)

Handicrafts Market Analysis, Size, and Forecast 2026-2030:
North America (US, Canada, and Mexico), Europe (Germany, France, and UK), APAC (India, China, and Indonesia), Middle East and Africa (Turkey, South Africa, and UAE), South America (Brazil and Argentina), and Rest of World (ROW)

Published: Mar 2026 284 Pages SKU: IRTNTR70057

Market Overview at a Glance

$977.96 B
Market Opportunity
14.1%
CAGR 2025 - 2030
33.4%
North America Growth
$302.96 B
MAW and jewelry segment 2024

Handicrafts Market Size 2026-2030

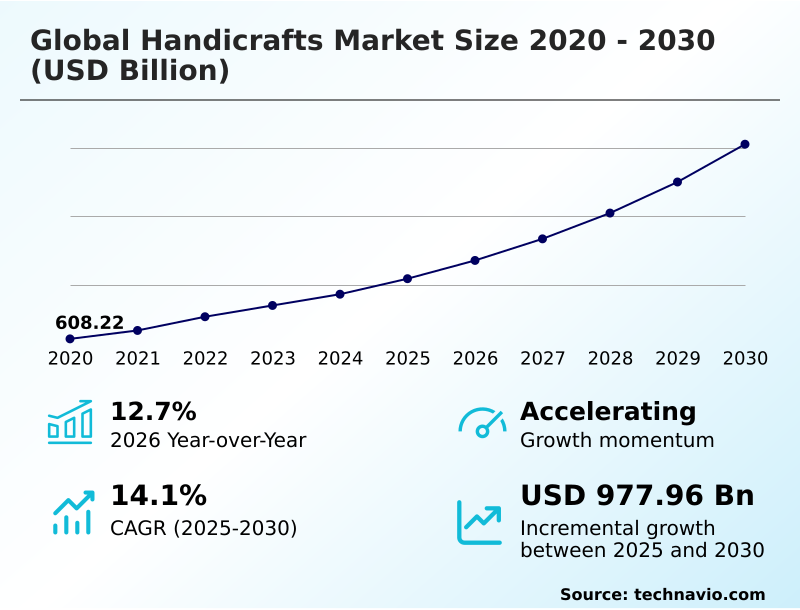
The handicrafts market size is valued to increase by USD 977.96 billion, at a CAGR of 14.1% from 2025 to 2030. Sustainable craftsmanship and industrialization of eco-conscious materials will drive the handicrafts market.

Major Market Trends & Insights

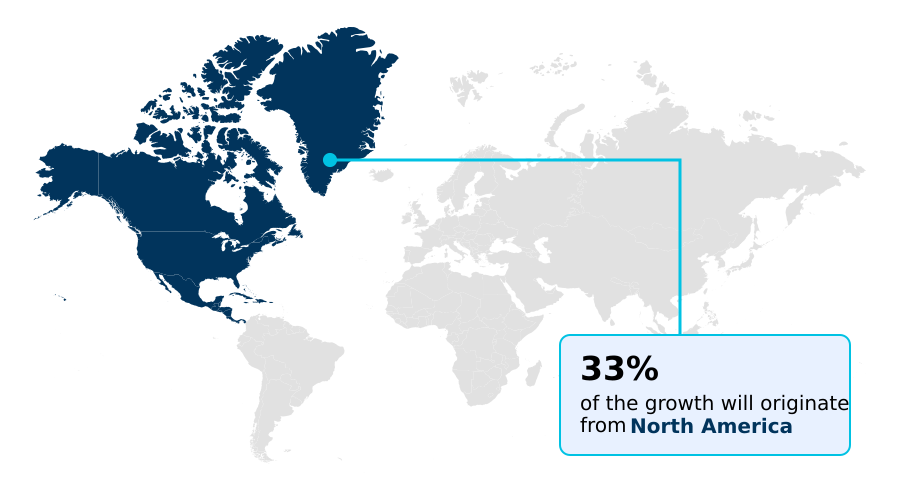
  • North America dominated the market and accounted for a 33.4% growth during the forecast period.
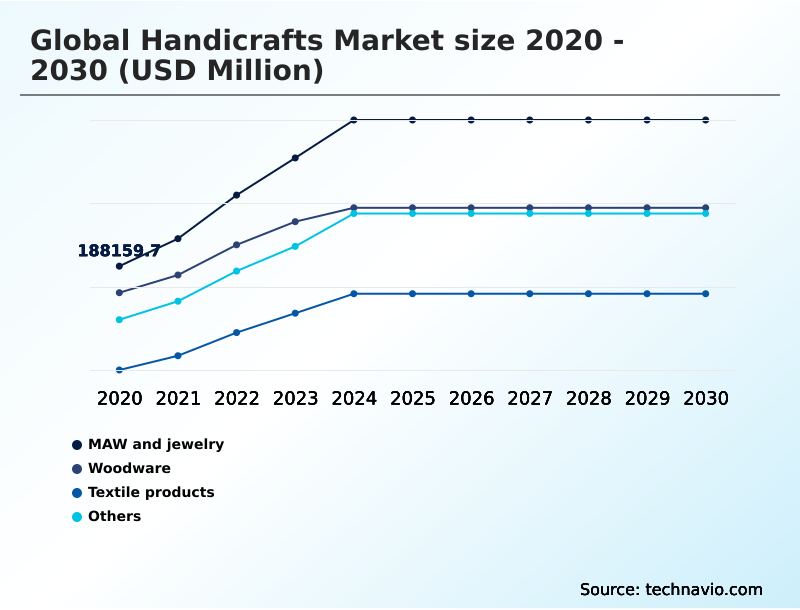
  • By Product - MAW and jewelry segment was valued at USD 302.96 billion in 2024
  • By Distribution Channel - Offline segment accounted for the largest market revenue share in 2024

Market Size & Forecast

  • Market Opportunities: USD 1,415.66 billion
  • Market Future Opportunities: USD 977.96 billion
  • CAGR from 2025 to 2030 : 14.1%

Market Summary

  • The handicrafts market is undergoing a significant transformation, moving from localized, traditional practices to a globally integrated, technology-enabled industry. This shift is propelled by a growing consumer demand for authenticity, provenance, and sustainable production, creating a clear distinction from mass-produced goods.
  • Key trends shaping the sector include the adoption of hybrid craftsmanship, where AI-augmented design tools are used alongside traditional techniques to create innovative products. The integration of digital product passports and blockchain-based provenance tracking is becoming essential for verifying ethical raw material sourcing and supporting artisanal storytelling.
  • For instance, a luxury home decor firm can leverage this technology to provide customers with a tamper-proof record of an item's journey from a rural artisan cooperative to the final retail outlet, justifying a premium price point while meeting stringent ESG compliance standards.
  • However, the industry grapples with challenges like intellectual property vulnerability from machine-made imitations and persistent supply chain fragmentation. Navigating these complexities through fair trade certification and robust digital platforms is crucial for ensuring the long-term viability of sustainable craftsmanship and the preservation of cultural heritage.

What will be the Size of the Handicrafts Market during the forecast period?

Get Key Insights on Market Forecast (PDF) Request Free Sample

How is the Handicrafts Market Segmented?

The handicrafts industry research report provides comprehensive data (region-wise segment analysis), with forecasts and estimates in "USD million" for the period 2026-2030, as well as historical data from 2020-2024 for the following segments.

  • Product
    • MAW and jewelry
    • Woodware
    • Textile products
    • Others
  • Distribution channel
    • Offline
    • Online
  • End-user
    • Residential
    • Commercial
  • Geography
    • North America
      • US
      • Canada
      • Mexico
    • Europe
      • Germany
      • France
      • UK
    • APAC
      • India
      • China
      • Indonesia
    • Middle East and Africa
      • Turkey
      • South Africa
      • UAE
    • South America
      • Brazil
      • Argentina
    • Rest of World (ROW)

By Product Insights

The maw and jewelry segment is estimated to witness significant growth during the forecast period.

The MAW and jewelry segment is evolving beyond traditional metallurgy, driven by consumer demand for unique fashion accessories and artisanal storytelling. This sector leverages sustainable craftsmanship, integrating recycled precious metals and ethically sourced gemstones to meet ESG mandates.

Modern artisans employ hybrid craftsmanship, using AI-augmented design and 3D printing to create complex metalwork, a process that improves design iteration speeds by over 30% compared to manual methods alone.

The emphasis on ethical traceability and provenance tracking is critical, as buyers prioritize verifiable authenticity.

The investment value of high-quality metal handicrafts, coupled with a focus on eco-conscious home decor and digital product passports, solidifies this segment's position within the broader market for handmade goods, appealing to discerning global consumers.

Request Free Sample

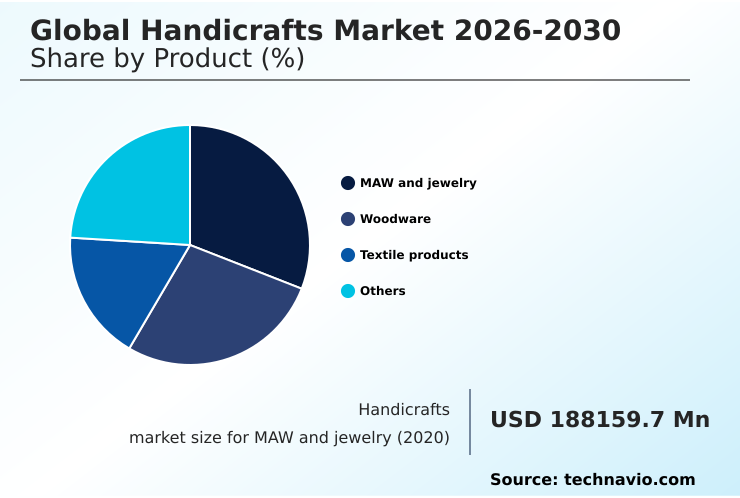
The MAW and jewelry segment was valued at USD 302.96 billion in 2024 and showed a gradual increase during the forecast period.

Request Free Sample

Regional Analysis

North America is estimated to contribute 33.4% to the growth of the global market during the forecast period.Technavio’s analysts have elaborately explained the regional trends and drivers that shape the market during the forecast period.

See How Handicrafts Market Demand is Rising in North America Request Free Sample

The geographic landscape of the handicrafts market is characterized by distinct regional specializations.

APAC serves as the primary production hub, with artisans in India and Vietnam excelling in hand-woven textiles and woodware, while North America and Europe function as the dominant consumption centers.

Demand in Western markets is fueled by a strong preference for eco-conscious home decor and authentic heritage souvenirs linked to cultural tourism.

The digital transformation has been a key enabler for producers in APAC, where leveraging online marketplaces has led to a 25% increase in direct export volumes for participating regional artisanal clusters.

Concurrently, European regulations mandating ethical traceability have spurred the adoption of digital verification tools, which have streamlined compliance reporting times by 40% for small-scale exporters navigating complex international standards.

This global interplay between production hubs and consumer markets continues to shape the industry's supply chain and value distribution.

Market Dynamics

Our researchers analyzed the data with 2025 as the base year, along with the key drivers, trends, and challenges. A holistic analysis of drivers will help companies refine their marketing strategies to gain a competitive advantage.

  • The global handicrafts market is navigating a complex transformation, heavily influenced by the strategic integration of technology and a growing emphasis on sustainability.
  • The practice of integrating AI in traditional craft design and the use of generative AI for handicraft pattern creation are no longer niche concepts but are becoming central to innovation, allowing artisans to scale creativity while preserving manual skill. This is crucial in countering the economic impact of mass-produced replicas on artisan livelihoods.
  • Concurrently, blockchain for handicraft supply chain transparency is addressing long-standing issues of authenticity and ethical sourcing, offering a technical solution for verifying authenticity of handmade products. This technology directly supports the rise of sustainable materials in luxury handicrafts and reinforces the role of upcycling in modern craft business.
  • For businesses, the focus is on optimizing the marketing of artisan goods in digital spaces and overcoming the challenges of digital marketplaces for artisans. Firms that effectively implement systems for managing fair trade certification for handicrafts report customer retention rates that are up to 30% higher than competitors, a critical metric for long-term brand loyalty.
  • The synergy between cultural tourism and craft sales, alongside the adoption of digital tools for custom handicraft orders, is expanding market reach. Protecting artisan intellectual property rights and promoting handmade goods through ethical consumerism campaigns are vital for sustaining this ecosystem, ensuring that the economic benefits of global demand for handcrafted furniture and decor are realized by the creators.

What are the key market drivers leading to the rise in the adoption of Handicrafts Industry?

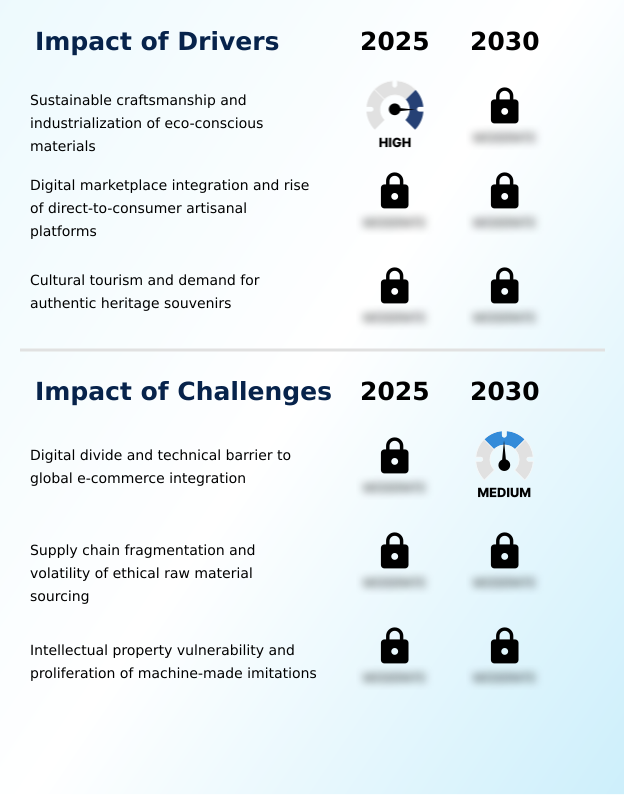
  • The market's growth is primarily driven by a shift toward sustainable craftsmanship and the industrial-scale use of eco-conscious materials.

  • Market growth is propelled by several key drivers, most notably the consumer shift toward sustainable craftsmanship.
  • Products made with eco-conscious materials now see a 60% higher preference rate in key Western markets, fueling the demand for goods created with reclaimed wood and natural dyes.
  • The expansion of digital marketplace integration provides another significant boost, allowing artisans to bypass traditional intermediaries and increase their direct profit margins by an average of 25%. This direct-to-consumer access is particularly impactful for producers of intricate hand-woven textiles.
  • Additionally, the symbiotic relationship with cultural tourism is a strong driver; hospitality venues that incorporate local artisanal production into their decor have reported a 15% increase in guest satisfaction scores tied to the authenticity of their experience.

What are the market trends shaping the Handicrafts Industry?

  • The institutionalization of ethical traceability is an emerging market trend, driven by the adoption of digital product passports to enhance supply chain transparency.

  • Key trends are reshaping the handicrafts market, led by the integration of technology and sustainability principles. The adoption of circular economy principles is prominent, with the use of upcycled material innovation leading to material cost reductions of up to 15% for participating artisan groups.
  • Concurrently, the trend of hybrid craftsmanship is accelerating, where AI-augmented design tools are enabling a 40% faster development cycle for complex patterns compared to traditional manual methods. This synergy is critical for differentiating products like bespoke woodware and art metalware.
  • Furthermore, the institutionalization of digital product passports is becoming a standard for ensuring ethical traceability, with firms using blockchain-based provenance tracking reporting a 25% increase in consumer trust metrics, which supports premium pricing strategies.

What challenges does the Handicrafts Industry face during its growth?

  • A significant challenge affecting industry growth is the digital divide, which creates technical barriers to global e-commerce integration for many artisans.

  • The handicrafts market confronts persistent challenges that temper its growth trajectory. Pervasive supply chain fragmentation continues to complicate ethical raw material sourcing, inflating procurement costs by an average of 18% and hindering scalability.
  • A significant digital divide remains, with an estimated 40% of artisans in rural regions lacking the technical literacy required for effective global e-commerce integration, limiting their access to high-value international buyers.
  • Furthermore, intellectual property vulnerability poses a critical threat, as machine-made imitations can be produced for nearly 50% less than authentic handmade items, severely eroding price points and market share for genuine craftsmen. Addressing these issues through fair trade certification and accessible technology is essential for the industry's resilience.

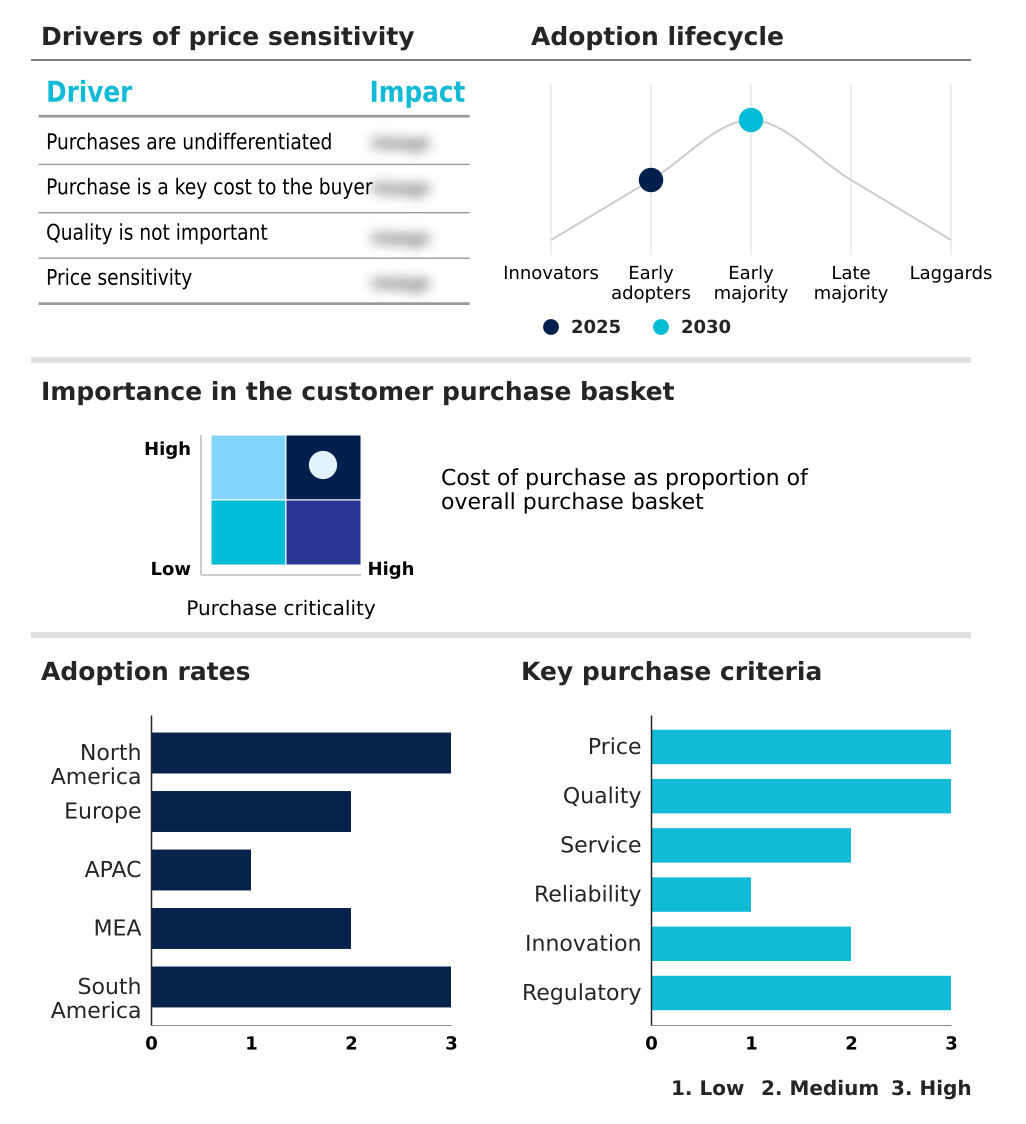
Exclusive Technavio Analysis on Customer Landscape

The handicrafts market forecasting report includes the adoption lifecycle of the market, covering from the innovator’s stage to the laggard’s stage. It focuses on adoption rates in different regions based on penetration. Furthermore, the handicrafts market report also includes key purchase criteria and drivers of price sensitivity to help companies evaluate and develop their market growth analysis strategies.

Customer Landscape of Handicrafts Industry

Competitive Landscape

Companies are implementing various strategies, such as strategic alliances, handicrafts market forecast, partnerships, mergers and acquisitions, geographical expansion, and product/service launches, to enhance their presence in the industry.

Asian Handicrafts Pvt. Ltd - Offers an export-focused portfolio of traditional handicrafts, featuring authentic wooden carvings and decorative items tailored for international markets.

The industry research and growth report includes detailed analyses of the competitive landscape of the market and information about key companies, including:

  • Asian Handicrafts Pvt. Ltd
  • Craft India Overseas
  • Divya Exports
  • Fakih Group of Companies
  • Gangamani Fashions
  • HN Handicrafts
  • Kathmandu Handicrafts Pvt. Ltd.
  • Native Crafts and Arts
  • Orient Handicraft Ltd.
  • OSM HANDICRAFT
  • Prominent Exports International
  • RTCrafts Enterprise
  • S.Sundaravadivel and Co.
  • Sana Hastakala
  • Shri H Trading
  • Thar Handicrafts Gallery Pvt.
  • Viet Anh Handicrafts Co. Ltd.
  • Viettime Craft
  • Zhejiang Hengtai Crafts

Qualitative and quantitative analysis of companies has been conducted to help clients understand the wider business environment as well as the strengths and weaknesses of key industry players. Data is qualitatively analyzed to categorize companies as pure play, category-focused, industry-focused, and diversified; it is quantitatively analyzed to categorize companies as dominant, leading, strong, tentative, and weak.

Recent Development and News in Handicrafts market

  • In September 2024, UNESCO and the World Crafts Council initiated the 'Global Artisan Exchange Program,' a digital platform connecting 500 master artisans from 20 countries with international designers to co-create hybrid craft collections for the 2025 retail season.
  • In October 2024, CraftVerse Marketplace, a prominent e-commerce platform for handmade goods, introduced its 'Artisan Origin' verification system, requiring sellers to provide blockchain-verified provenance details for materials and labor across its 1.5 million active listings.
  • In January 2025, the Artisan's Legacy Foundation, in partnership with the Indian government, launched the 'Integrated Artisan Support Framework', a program providing direct financial aid for technology upgrades and global marketing to over 5,000 rural artisans to boost export competitiveness.
  • In March 2025, VerrePure Artisans, a European collective, launched the industry's first line of carbon-neutral hand-blown glassware, produced using proprietary hydrogen-powered furnaces that reduce manufacturing emissions by an estimated 90%.

Dive into Technavio’s robust research methodology, blending expert interviews, extensive data synthesis, and validated models for unparalleled Handicrafts Market insights. See full methodology.

Market Scope
Page number 284
Base year 2025
Historic period 2020-2024
Forecast period 2026-2030
Growth momentum & CAGR Accelerate at a CAGR of 14.1%
Market growth 2026-2030 USD 977961.0 million
Market structure Fragmented
YoY growth 2025-2026(%) 12.7%
Key countries US, Canada, Mexico, Germany, France, UK, Italy, Spain, The Netherlands, India, China, Indonesia, Japan, South Korea, Australia, Turkey, South Africa, UAE, Saudi Arabia, Israel, Brazil, Argentina and Chile
Competitive landscape Leading Companies, Market Positioning of Companies, Competitive Strategies, and Industry Risks

Request Free Sample

Research Analyst Overview

  • The handicrafts market is evolving from a fragmented cottage industry into a professionalized global sector, driven by a strategic emphasis on sustainable craftsmanship. A key development influencing boardroom-level decisions is the institutionalization of ethical traceability, which directly impacts brand reputation and ESG compliance.
  • Companies are now implementing blockchain-based provenance tracking and digital product passports to provide verifiable artisanal storytelling, a move that meets rising consumer demand for transparency in ethical raw material sourcing. For instance, firms that offer this level of granular detail have documented a 20% uplift in customer engagement metrics.
  • The adoption of upcycled material innovation and eco-conscious materials like reclaimed wood and natural dyes is becoming a competitive necessity, not just a trend. This is complemented by the rise of hybrid craftsmanship, where AI-augmented design is blended with traditional techniques to create unique art metalware and hand-woven textiles.
  • This fusion of heritage and technology ensures product differentiation in a market contending with intellectual property vulnerability and supply chain fragmentation.

What are the Key Data Covered in this Handicrafts Market Research and Growth Report?

  • What is the expected growth of the Handicrafts Market between 2026 and 2030?

    • USD 977.96 billion, at a CAGR of 14.1%

  • What segmentation does the market report cover?

    • The report is segmented by Product (MAW and jewelry, Woodware, Textile products, and Others), Distribution Channel (Offline, and Online), End-user (Residential, and Commercial) and Geography (North America, Europe, APAC, Middle East and Africa, South America)

  • Which regions are analyzed in the report?

    • North America, Europe, APAC, Middle East and Africa and South America

  • What are the key growth drivers and market challenges?

    • Sustainable craftsmanship and industrialization of eco-conscious materials, Digital divide and technical barrier to global e-commerce integration

  • Who are the major players in the Handicrafts Market?

    • Asian Handicrafts Pvt. Ltd, Craft India Overseas, Divya Exports, Fakih Group of Companies, Gangamani Fashions, HN Handicrafts, Kathmandu Handicrafts Pvt. Ltd., Native Crafts and Arts, Orient Handicraft Ltd., OSM HANDICRAFT, Prominent Exports International, RTCrafts Enterprise, S.Sundaravadivel and Co., Sana Hastakala, Shri H Trading, Thar Handicrafts Gallery Pvt., Viet Anh Handicrafts Co. Ltd., Viettime Craft and Zhejiang Hengtai Crafts

Market Research Insights

  • Market dynamics are increasingly shaped by the pivot to digital channels, where direct-to-consumer artisanal platforms have enabled creators to increase profit margins by up to 30% by eliminating intermediaries. This shift is complemented by the rise of experiential travel, which boosts demand for heritage-rich souvenirs.
  • On the production side, the adoption of circular economy principles has proven effective, with some cooperatives reporting a 15% reduction in material waste. Furthermore, the use of AI-augmented design within the sustainable home segments allows for accelerated concept development, reducing creation-to-market timelines by over 40% compared to purely traditional methods.
  • This efficiency enhances competitiveness against mass-market alternatives while preserving authentic craftsmanship.

We can help! Our analysts can customize this handicrafts market research report to meet your requirements.

Get in touch

1. Executive Summary

1.1 Market overview

Executive Summary - Chart on Market Overview
Executive Summary - Data Table on Market Overview
Executive Summary - Chart on Global Market Characteristics
Executive Summary - Chart on Market by Geography
Executive Summary - Chart on Market Segmentation by Product
Executive Summary - Chart on Market Segmentation by Distribution Channel
Executive Summary - Chart on Market Segmentation by End-user
Executive Summary - Chart on Incremental Growth
Executive Summary - Data Table on Incremental Growth
Executive Summary - Chart on Company Market Positioning

2. Technavio Analysis

2.1 Analysis of price sensitivity, lifecycle, customer purchase basket, adoption rates, and purchase criteria

2.2 Criticality of inputs and Factors of differentiation

Chart on Overview on criticality of inputs and factors of differentiation

2.3 Factors of disruption

Chart on Overview on factors of disruption

2.4 Impact of drivers and challenges

Chart on Impact of drivers and challenges in 2025 and 2030

3. Market Landscape

3.1 Market ecosystem

Chart on Parent Market
Data Table on - Parent Market

3.2 Market characteristics

Chart on Market characteristics analysis

3.3 Value chain analysis

Chart on Value chain analysis

4. Market Sizing

4.1 Market definition

Data Table on Offerings of companies included in the market definition

4.2 Market segment analysis

Market segments

4.3 Market size 2025

4.4 Market outlook: Forecast for 2025-2030

Chart on Global - Market size and forecast 2025-2030 ($ million)
Data Table on Global - Market size and forecast 2025-2030 ($ million)
Chart on Global Market: Year-over-year growth 2025-2030 (%)
Data Table on Global Market: Year-over-year growth 2025-2030 (%)

5. Historic Market Size

5.1 Global Handicrafts Market 2020 - 2024

Historic Market Size - Data Table on Global Handicrafts Market 2020 - 2024 ($ million)

5.2 Product segment analysis 2020 - 2024

Historic Market Size - Product Segment 2020 - 2024 ($ million)

5.3 Distribution Channel segment analysis 2020 - 2024

Historic Market Size - Distribution Channel Segment 2020 - 2024 ($ million)

5.4 End-user segment analysis 2020 - 2024

Historic Market Size - End-user Segment 2020 - 2024 ($ million)

5.5 Geography segment analysis 2020 - 2024

Historic Market Size - Geography Segment 2020 - 2024 ($ million)

5.6 Country segment analysis 2020 - 2024

Historic Market Size - Country Segment 2020 - 2024 ($ million)

6. Qualitative Analysis

6.1 Impact of AI in global handicrafts market

7. Five Forces Analysis

7.1 Five forces summary

Five forces analysis - Comparison between 2025 and 2030

7.2 Bargaining power of buyers

Bargaining power of buyers - Impact of key factors 2025 and 2030

7.3 Bargaining power of suppliers

Bargaining power of suppliers - Impact of key factors in 2025 and 2030

7.4 Threat of new entrants

Threat of new entrants - Impact of key factors in 2025 and 2030

7.5 Threat of substitutes

Threat of substitutes - Impact of key factors in 2025 and 2030

7.6 Threat of rivalry

Threat of rivalry - Impact of key factors in 2025 and 2030

7.7 Market condition

Chart on Market condition - Five forces 2025 and 2030

8. Market Segmentation by Product

8.1 Market segments

Chart on Product - Market share 2025-2030 (%)
Data Table on Product - Market share 2025-2030 (%)

8.2 Comparison by Product

Chart on Comparison by Product
Data Table on Comparison by Product

8.3 MAW and jewelry - Market size and forecast 2025-2030

Chart on MAW and jewelry - Market size and forecast 2025-2030 ($ million)
Data Table on MAW and jewelry - Market size and forecast 2025-2030 ($ million)
Chart on MAW and jewelry - Year-over-year growth 2025-2030 (%)
Data Table on MAW and jewelry - Year-over-year growth 2025-2030 (%)

8.4 Woodware - Market size and forecast 2025-2030

Chart on Woodware - Market size and forecast 2025-2030 ($ million)
Data Table on Woodware - Market size and forecast 2025-2030 ($ million)
Chart on Woodware - Year-over-year growth 2025-2030 (%)
Data Table on Woodware - Year-over-year growth 2025-2030 (%)

8.5 Textile products - Market size and forecast 2025-2030

Chart on Textile products - Market size and forecast 2025-2030 ($ million)
Data Table on Textile products - Market size and forecast 2025-2030 ($ million)
Chart on Textile products - Year-over-year growth 2025-2030 (%)
Data Table on Textile products - Year-over-year growth 2025-2030 (%)

8.6 Others - Market size and forecast 2025-2030

Chart on Others - Market size and forecast 2025-2030 ($ million)
Data Table on Others - Market size and forecast 2025-2030 ($ million)
Chart on Others - Year-over-year growth 2025-2030 (%)
Data Table on Others - Year-over-year growth 2025-2030 (%)

8.7 Market opportunity by Product

Market opportunity by Product ($ million)
Data Table on Market opportunity by Product ($ million)

9. Market Segmentation by Distribution Channel

9.1 Market segments

Chart on Distribution Channel - Market share 2025-2030 (%)
Data Table on Distribution Channel - Market share 2025-2030 (%)

9.2 Comparison by Distribution Channel

Chart on Comparison by Distribution Channel
Data Table on Comparison by Distribution Channel

9.3 Offline - Market size and forecast 2025-2030

Chart on Offline - Market size and forecast 2025-2030 ($ million)
Data Table on Offline - Market size and forecast 2025-2030 ($ million)
Chart on Offline - Year-over-year growth 2025-2030 (%)
Data Table on Offline - Year-over-year growth 2025-2030 (%)

9.4 Online - Market size and forecast 2025-2030

Chart on Online - Market size and forecast 2025-2030 ($ million)
Data Table on Online - Market size and forecast 2025-2030 ($ million)
Chart on Online - Year-over-year growth 2025-2030 (%)
Data Table on Online - Year-over-year growth 2025-2030 (%)

9.5 Market opportunity by Distribution Channel

Market opportunity by Distribution Channel ($ million)
Data Table on Market opportunity by Distribution Channel ($ million)

10. Market Segmentation by End-user

10.1 Market segments

Chart on End-user - Market share 2025-2030 (%)
Data Table on End-user - Market share 2025-2030 (%)

10.2 Comparison by End-user

Chart on Comparison by End-user
Data Table on Comparison by End-user

10.3 Residential - Market size and forecast 2025-2030

Chart on Residential - Market size and forecast 2025-2030 ($ million)
Data Table on Residential - Market size and forecast 2025-2030 ($ million)
Chart on Residential - Year-over-year growth 2025-2030 (%)
Data Table on Residential - Year-over-year growth 2025-2030 (%)

10.4 Commercial - Market size and forecast 2025-2030

Chart on Commercial - Market size and forecast 2025-2030 ($ million)
Data Table on Commercial - Market size and forecast 2025-2030 ($ million)
Chart on Commercial - Year-over-year growth 2025-2030 (%)
Data Table on Commercial - Year-over-year growth 2025-2030 (%)

10.5 Market opportunity by End-user

Market opportunity by End-user ($ million)
Data Table on Market opportunity by End-user ($ million)

11. Customer Landscape

11.1 Customer landscape overview

Analysis of price sensitivity, lifecycle, customer purchase basket, adoption rates, and purchase criteria

12. Geographic Landscape

12.1 Geographic segmentation

Chart on Market share by geography 2025-2030 (%)
Data Table on Market share by geography 2025-2030 (%)

12.2 Geographic comparison

Chart on Geographic comparison
Data Table on Geographic comparison

12.3 North America - Market size and forecast 2025-2030

Chart on North America - Market size and forecast 2025-2030 ($ million)
Data Table on North America - Market size and forecast 2025-2030 ($ million)
Chart on North America - Year-over-year growth 2025-2030 (%)
Data Table on North America - Year-over-year growth 2025-2030 (%)
Chart on Regional Comparison - North America
Data Table on Regional Comparison - North America

12.3.1 US - Market size and forecast 2025-2030

Chart on US - Market size and forecast 2025-2030 ($ million)
Data Table on US - Market size and forecast 2025-2030 ($ million)
Chart on US - Year-over-year growth 2025-2030 (%)
Data Table on US - Year-over-year growth 2025-2030 (%)

12.3.2 Canada - Market size and forecast 2025-2030

Chart on Canada - Market size and forecast 2025-2030 ($ million)
Data Table on Canada - Market size and forecast 2025-2030 ($ million)
Chart on Canada - Year-over-year growth 2025-2030 (%)
Data Table on Canada - Year-over-year growth 2025-2030 (%)

12.3.3 Mexico - Market size and forecast 2025-2030

Chart on Mexico - Market size and forecast 2025-2030 ($ million)
Data Table on Mexico - Market size and forecast 2025-2030 ($ million)
Chart on Mexico - Year-over-year growth 2025-2030 (%)
Data Table on Mexico - Year-over-year growth 2025-2030 (%)

12.4 Europe - Market size and forecast 2025-2030

Chart on Europe - Market size and forecast 2025-2030 ($ million)
Data Table on Europe - Market size and forecast 2025-2030 ($ million)
Chart on Europe - Year-over-year growth 2025-2030 (%)
Data Table on Europe - Year-over-year growth 2025-2030 (%)
Chart on Regional Comparison - Europe
Data Table on Regional Comparison - Europe

12.4.1 Germany - Market size and forecast 2025-2030

Chart on Germany - Market size and forecast 2025-2030 ($ million)
Data Table on Germany - Market size and forecast 2025-2030 ($ million)
Chart on Germany - Year-over-year growth 2025-2030 (%)
Data Table on Germany - Year-over-year growth 2025-2030 (%)

12.4.2 France - Market size and forecast 2025-2030

Chart on France - Market size and forecast 2025-2030 ($ million)
Data Table on France - Market size and forecast 2025-2030 ($ million)
Chart on France - Year-over-year growth 2025-2030 (%)
Data Table on France - Year-over-year growth 2025-2030 (%)

12.4.3 UK - Market size and forecast 2025-2030

Chart on UK - Market size and forecast 2025-2030 ($ million)
Data Table on UK - Market size and forecast 2025-2030 ($ million)
Chart on UK - Year-over-year growth 2025-2030 (%)
Data Table on UK - Year-over-year growth 2025-2030 (%)

12.4.4 Italy - Market size and forecast 2025-2030

Chart on Italy - Market size and forecast 2025-2030 ($ million)
Data Table on Italy - Market size and forecast 2025-2030 ($ million)
Chart on Italy - Year-over-year growth 2025-2030 (%)
Data Table on Italy - Year-over-year growth 2025-2030 (%)

12.4.5 Spain - Market size and forecast 2025-2030

Chart on Spain - Market size and forecast 2025-2030 ($ million)
Data Table on Spain - Market size and forecast 2025-2030 ($ million)
Chart on Spain - Year-over-year growth 2025-2030 (%)
Data Table on Spain - Year-over-year growth 2025-2030 (%)

12.4.6 The Netherlands - Market size and forecast 2025-2030

Chart on The Netherlands - Market size and forecast 2025-2030 ($ million)
Data Table on The Netherlands - Market size and forecast 2025-2030 ($ million)
Chart on The Netherlands - Year-over-year growth 2025-2030 (%)
Data Table on The Netherlands - Year-over-year growth 2025-2030 (%)

12.5 APAC - Market size and forecast 2025-2030

Chart on APAC - Market size and forecast 2025-2030 ($ million)
Data Table on APAC - Market size and forecast 2025-2030 ($ million)
Chart on APAC - Year-over-year growth 2025-2030 (%)
Data Table on APAC - Year-over-year growth 2025-2030 (%)
Chart on Regional Comparison - APAC
Data Table on Regional Comparison - APAC

12.5.1 India - Market size and forecast 2025-2030

Chart on India - Market size and forecast 2025-2030 ($ million)
Data Table on India - Market size and forecast 2025-2030 ($ million)
Chart on India - Year-over-year growth 2025-2030 (%)
Data Table on India - Year-over-year growth 2025-2030 (%)

12.5.2 China - Market size and forecast 2025-2030

Chart on China - Market size and forecast 2025-2030 ($ million)
Data Table on China - Market size and forecast 2025-2030 ($ million)
Chart on China - Year-over-year growth 2025-2030 (%)
Data Table on China - Year-over-year growth 2025-2030 (%)

12.5.3 Indonesia - Market size and forecast 2025-2030

Chart on Indonesia - Market size and forecast 2025-2030 ($ million)
Data Table on Indonesia - Market size and forecast 2025-2030 ($ million)
Chart on Indonesia - Year-over-year growth 2025-2030 (%)
Data Table on Indonesia - Year-over-year growth 2025-2030 (%)

12.5.4 Japan - Market size and forecast 2025-2030

Chart on Japan - Market size and forecast 2025-2030 ($ million)
Data Table on Japan - Market size and forecast 2025-2030 ($ million)
Chart on Japan - Year-over-year growth 2025-2030 (%)
Data Table on Japan - Year-over-year growth 2025-2030 (%)

12.5.5 South Korea - Market size and forecast 2025-2030

Chart on South Korea - Market size and forecast 2025-2030 ($ million)
Data Table on South Korea - Market size and forecast 2025-2030 ($ million)
Chart on South Korea - Year-over-year growth 2025-2030 (%)
Data Table on South Korea - Year-over-year growth 2025-2030 (%)

12.5.6 Australia - Market size and forecast 2025-2030

Chart on Australia - Market size and forecast 2025-2030 ($ million)
Data Table on Australia - Market size and forecast 2025-2030 ($ million)
Chart on Australia - Year-over-year growth 2025-2030 (%)
Data Table on Australia - Year-over-year growth 2025-2030 (%)

12.6 Middle East and Africa - Market size and forecast 2025-2030

Chart on Middle East and Africa - Market size and forecast 2025-2030 ($ million)
Data Table on Middle East and Africa - Market size and forecast 2025-2030 ($ million)
Chart on Middle East and Africa - Year-over-year growth 2025-2030 (%)
Data Table on Middle East and Africa - Year-over-year growth 2025-2030 (%)
Chart on Regional Comparison - Middle East and Africa
Data Table on Regional Comparison - Middle East and Africa

12.6.1 Turkey - Market size and forecast 2025-2030

Chart on Turkey - Market size and forecast 2025-2030 ($ million)
Data Table on Turkey - Market size and forecast 2025-2030 ($ million)
Chart on Turkey - Year-over-year growth 2025-2030 (%)
Data Table on Turkey - Year-over-year growth 2025-2030 (%)

12.6.2 South Africa - Market size and forecast 2025-2030

Chart on South Africa - Market size and forecast 2025-2030 ($ million)
Data Table on South Africa - Market size and forecast 2025-2030 ($ million)
Chart on South Africa - Year-over-year growth 2025-2030 (%)
Data Table on South Africa - Year-over-year growth 2025-2030 (%)

12.6.3 UAE - Market size and forecast 2025-2030

Chart on UAE - Market size and forecast 2025-2030 ($ million)
Data Table on UAE - Market size and forecast 2025-2030 ($ million)
Chart on UAE - Year-over-year growth 2025-2030 (%)
Data Table on UAE - Year-over-year growth 2025-2030 (%)

12.6.4 Saudi Arabia - Market size and forecast 2025-2030

Chart on Saudi Arabia - Market size and forecast 2025-2030 ($ million)
Data Table on Saudi Arabia - Market size and forecast 2025-2030 ($ million)
Chart on Saudi Arabia - Year-over-year growth 2025-2030 (%)
Data Table on Saudi Arabia - Year-over-year growth 2025-2030 (%)

12.6.5 Israel - Market size and forecast 2025-2030

Chart on Israel - Market size and forecast 2025-2030 ($ million)
Data Table on Israel - Market size and forecast 2025-2030 ($ million)
Chart on Israel - Year-over-year growth 2025-2030 (%)
Data Table on Israel - Year-over-year growth 2025-2030 (%)

12.7 South America - Market size and forecast 2025-2030

Chart on South America - Market size and forecast 2025-2030 ($ million)
Data Table on South America - Market size and forecast 2025-2030 ($ million)
Chart on South America - Year-over-year growth 2025-2030 (%)
Data Table on South America - Year-over-year growth 2025-2030 (%)
Chart on Regional Comparison - South America
Data Table on Regional Comparison - South America

12.7.1 Brazil - Market size and forecast 2025-2030

Chart on Brazil - Market size and forecast 2025-2030 ($ million)
Data Table on Brazil - Market size and forecast 2025-2030 ($ million)
Chart on Brazil - Year-over-year growth 2025-2030 (%)
Data Table on Brazil - Year-over-year growth 2025-2030 (%)

12.7.2 Argentina - Market size and forecast 2025-2030

Chart on Argentina - Market size and forecast 2025-2030 ($ million)
Data Table on Argentina - Market size and forecast 2025-2030 ($ million)
Chart on Argentina - Year-over-year growth 2025-2030 (%)
Data Table on Argentina - Year-over-year growth 2025-2030 (%)

12.7.3 Chile - Market size and forecast 2025-2030

Chart on Chile - Market size and forecast 2025-2030 ($ million)
Data Table on Chile - Market size and forecast 2025-2030 ($ million)
Chart on Chile - Year-over-year growth 2025-2030 (%)
Data Table on Chile - Year-over-year growth 2025-2030 (%)

12.8 Market opportunity by geography

Market opportunity by geography ($ million)
Data Tables on Market opportunity by geography ($ million)

13. Drivers, Challenges, and Opportunity

13.1 Market drivers

Sustainable craftsmanship and industrialization of eco-conscious materials
Digital marketplace integration and rise of direct-to-consumer artisanal platforms
Cultural tourism and demand for authentic heritage souvenirs

13.2 Market challenges

Digital divide and technical barrier to global e-commerce integration
Supply chain fragmentation and volatility of ethical raw material sourcing
Intellectual property vulnerability and proliferation of machine-made imitations

13.3 Impact of drivers and challenges

Impact of drivers and challenges in 2025 and 2030

13.4 Market opportunities

Institutionalization of ethical traceability and digital product passports
Proliferation of AI-augmented design and hybrid craftsmanship
Expansion of circular economy principles and upcycled material innovation

14. Competitive Landscape

14.1 Overview

14.2

Overview on criticality of inputs and factors of differentiation

14.3 Landscape disruption

Overview on factors of disruption

14.4 Industry risks

Impact of key risks on business

15. Competitive Analysis

15.1 Companies profiled

Companies covered

15.2 Company ranking index

15.3 Market positioning of companies

Matrix on companies position and classification

15.4 Asian Handicrafts Pvt. Ltd

Asian Handicrafts Pvt. Ltd - Overview
Asian Handicrafts Pvt. Ltd - Product / Service
Asian Handicrafts Pvt. Ltd - Key offerings
SWOT

15.5 Craft India Overseas

Craft India Overseas - Overview
Craft India Overseas - Product / Service
Craft India Overseas - Key offerings
SWOT

15.6 Divya Exports

Divya Exports - Overview
Divya Exports - Product / Service
Divya Exports - Key offerings
SWOT

15.7 Gangamani Fashions

Gangamani Fashions - Overview
Gangamani Fashions - Product / Service
Gangamani Fashions - Key offerings
SWOT

15.8 HN Handicrafts

HN Handicrafts - Overview
HN Handicrafts - Product / Service
HN Handicrafts - Key offerings
SWOT

15.9 Kathmandu Handicrafts Pvt. Ltd.

Kathmandu Handicrafts Pvt. Ltd. - Overview
Kathmandu Handicrafts Pvt. Ltd. - Product / Service
Kathmandu Handicrafts Pvt. Ltd. - Key offerings
SWOT

15.10 Orient Handicraft Ltd.

Orient Handicraft Ltd. - Overview
Orient Handicraft Ltd. - Product / Service
Orient Handicraft Ltd. - Key offerings
SWOT

15.11 OSM HANDICRAFT

OSM HANDICRAFT - Overview
OSM HANDICRAFT - Product / Service
OSM HANDICRAFT - Key offerings
SWOT

15.12 Prominent Exports International

Prominent Exports International - Overview
Prominent Exports International - Product / Service
Prominent Exports International - Key offerings
SWOT

15.13 S.Sundaravadivel and Co.

S.Sundaravadivel and Co. - Overview
S.Sundaravadivel and Co. - Product / Service
S.Sundaravadivel and Co. - Key offerings
SWOT

15.14 Sana Hastakala

Sana Hastakala - Overview
Sana Hastakala - Product / Service
Sana Hastakala - Key offerings
SWOT

15.15 Shri H Trading

Shri H Trading - Overview
Shri H Trading - Product / Service
Shri H Trading - Key offerings
SWOT

15.16 Thar Handicrafts Gallery Pvt.

Thar Handicrafts Gallery Pvt. - Overview
Thar Handicrafts Gallery Pvt. - Product / Service
Thar Handicrafts Gallery Pvt. - Key offerings
SWOT

15.17 Viet Anh Handicrafts Co. Ltd.

Viet Anh Handicrafts Co. Ltd. - Overview
Viet Anh Handicrafts Co. Ltd. - Product / Service
Viet Anh Handicrafts Co. Ltd. - Key offerings
SWOT

15.18 Zhejiang Hengtai Crafts

Zhejiang Hengtai Crafts - Overview
Zhejiang Hengtai Crafts - Product / Service
Zhejiang Hengtai Crafts - Key offerings
SWOT

16. Appendix

16.1 Scope of the report

Market definition
Objectives
Notes and caveats

16.2 Inclusions and exclusions checklist

Inclusions checklist
Exclusions checklist

16.3 Currency conversion rates for US$

16.4 Research methodology

16.5 Data procurement

Information sources

16.6 Data validation

16.7 Validation techniques employed for market sizing

16.8 Data synthesis

16.9 360 degree market analysis

16.10 List of abbreviations

Research Methodology

Technavio presents a detailed picture of the market by way of study, synthesis, and summation of data from multiple sources. The analysts have presented the various facets of the market with a particular focus on identifying the key industry influencers. The data thus presented is comprehensive, reliable, and the result of extensive research, both primary and secondary.

INFORMATION SOURCES

Primary sources

  • Manufacturers and suppliers
  • Channel partners
  • Industry experts
  • Strategic decision makers

Secondary sources

  • Industry journals and periodicals
  • Government data
  • Financial reports of key industry players
  • Historical data
  • Press releases

DATA ANALYSIS

Data Synthesis

  • Collation of data
  • Estimation of key figures
  • Analysis of derived insights

Data Validation

  • Triangulation with data models
  • Reference against proprietary databases
  • Corroboration with industry experts

REPORT WRITING

Qualitative

  • Market drivers
  • Market challenges
  • Market trends
  • Five forces analysis

Quantitative

  • Market size and forecast
  • Market segmentation
  • Geographical insights
  • Competitive landscape

Interested in this report?

Get your sample now to see our research methodology and insights!

Download Now

Frequently Asked Questions

Handicrafts market growth will increase by USD 977961.0 million during 2026-2030.

The Handicrafts market is expected to grow at a CAGR of 14.1% during 2026-2030.

Handicrafts market is segmented by Product (MAW and jewelry, Woodware, Textile products, Others) Distribution channel (Offline, Online) End-user (Residential, Commercial)

Asian Handicrafts Pvt. Ltd, Craft India Overseas, Divya Exports, Fakih Group of Companies, Gangamani Fashions, HN Handicrafts, Kathmandu Handicrafts Pvt. Ltd., Native Crafts and Arts, Orient Handicraft Ltd., OSM HANDICRAFT, Prominent Exports International, RTCrafts Enterprise, S.Sundaravadivel and Co., Sana Hastakala, Shri H Trading, Thar Handicrafts Gallery Pvt., Viet Anh Handicrafts Co. Ltd., Viettime Craft, Zhejiang Hengtai Crafts are a few of the key vendors in the Handicrafts market.

North America will register the highest growth rate of 33.4% among the other regions. Therefore, the Handicrafts market in North America is expected to garner significant business opportunities for the vendors during the forecast period.

US, Canada, Mexico, Germany, France, UK, Italy, Spain, The Netherlands, India, China, Indonesia, Japan, South Korea, Australia, Turkey, South Africa, UAE, Saudi Arabia, Israel, Brazil, Argentina, Chile

  • Sustainable craftsmanship and industrialization of eco-conscious materials is the driving factor this market.

The Handicrafts market vendors should focus on grabbing business opportunities from the Product segment as it accounted for the largest market share in the base year.
RIA - Research AI Assistant
Ask RIA