Home Decor Market Size 2025-2029
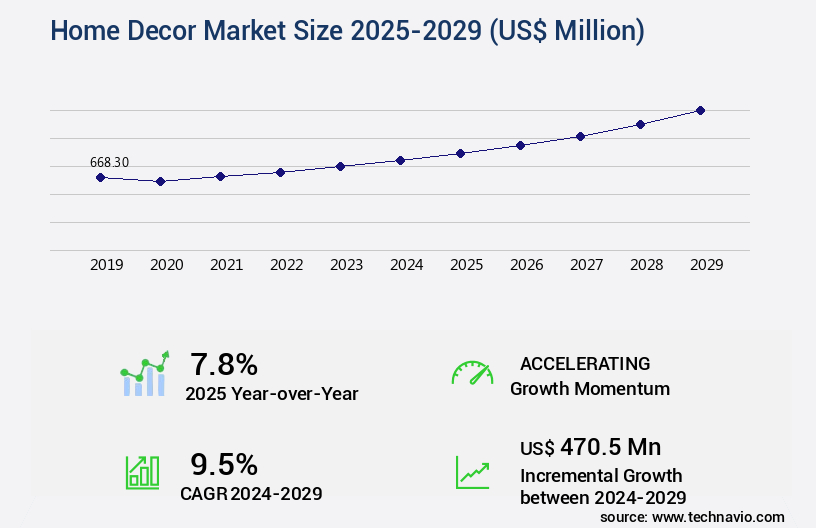
The home decor market size is valued to increase by USD 470.5 million, at a CAGR of 9.5% from 2024 to 2029. Rising disposable income among global consumers will drive the home decor market.
Major Market Trends & Insights
- APAC dominated the market and accounted for a 60% growth during the forecast period.
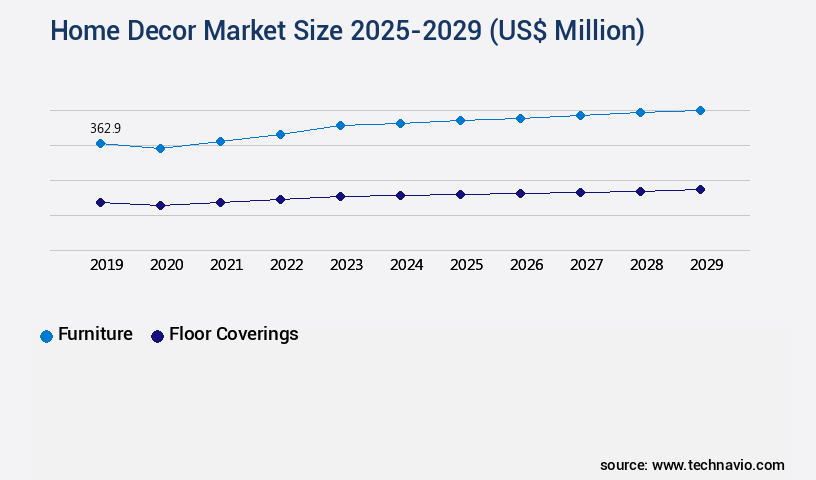
- By Product - Furniture segment was valued at USD 362.90 million in 2023
- By Distribution Channel - Offline segment accounted for the largest market revenue share in 2023
Market Size & Forecast
- Market Opportunities: USD 93.69 million
- Market Future Opportunities: USD 470.50 million
- CAGR from 2024 to 2029 : 9.5%
Market Summary
- The market experiences continuous expansion, fueled by increasing disposable income among consumers worldwide. This financial growth translates into a heightened demand for aesthetically pleasing and functional home decor items. One notable trend shaping the market is the preference for eco-friendly products. As environmental consciousness becomes a priority for many consumers, the demand for sustainable and ethically sourced home decor solutions is on the rise. Construction and real estate industries are also major consumers of home decor items, driving demand for cabinets, containers, and other home decor solutions. However, the market faces challenges in the form of volatile raw material prices and transportation costs. These variables impact the production and distribution of home decor products, potentially affecting both manufacturers and retailers.
- Despite these hurdles, the market's resilience is evident, with players continually adapting to the evolving landscape. According to recent market data, the market was valued at approximately USD 500 billion in 2020. This figure underscores the market's significance and potential for growth. As consumer preferences and market dynamics continue to shift, the market is poised to remain a vibrant and dynamic sector.
What will be the Size of the Home Decor Market during the forecast period?
Get Key Insights on Market Forecast (PDF) Request Free Sample
How is the Home Decor Market Segmented?
The home decor industry research report provides comprehensive data (region-wise segment analysis), with forecasts and estimates in "USD million" for the period 2025-2029, as well as historical data from 2019-2023 for the following segments.
- Product
- Furniture
- Floor coverings
- Others
- Distribution Channel
- Offline
- Online
- Price
- Mass
- Premium
- Application
- Indoor
- Outdoor
- End-User Type
- Residential
- Commercial
- Hospitality
- Material Type
- Wood
- Metal
- Glass
- Fabric
- Plastic
- Geography
- North America
- US
- Canada
- Europe
- France
- Germany
- UK
- APAC
- Australia
- China
- India
- Japan
- South Korea
- Rest of World (ROW)
- North America
By Product Insights
The furniture segment is estimated to witness significant growth during the forecast period.
The market continues to evolve, reflecting consumers' ongoing quest for personal expression and enhanced living spaces. Furniture, a key component, encompasses various styles from classic to contemporary, with a growing preference for wooden pieces among middle- and high-income demographics. This trend is driven by the material's durability, aesthetic appeal, and increasing sustainability consciousness. Modular kitchens and closets are also gaining traction, aligning with Western societal norms. Moreover, eco-friendly products are increasingly adopted across sectors, including bedrooms, bathrooms, outdoor spaces, and indoor areas, with up to 75% of consumers expressing a preference for sustainable design materials. Ergonomic furniture design, natural light optimization, and ambient lighting solutions further enhance comfort and functionality.
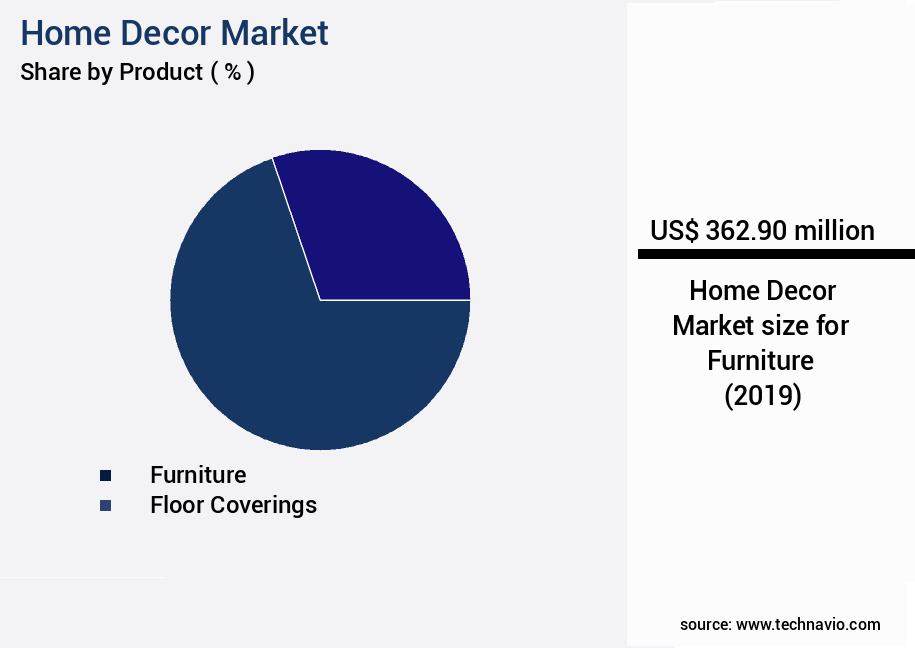
The Furniture segment was valued at USD 362.90 million in 2019 and showed a gradual increase during the forecast period.
Interior design software, room layout optimization tools, and virtual staging software facilitate the design process, while accessible design principles ensure inclusivity. Upholstery fabric types, paint color palettes, floor covering materials, and home automation systems add texture and pattern, elevating the overall home decor experience.
Regional Analysis
APAC is estimated to contribute 60% to the growth of the global market during the forecast period. Technavio's analysts have elaborately explained the regional trends and drivers that shape the market during the forecast period.

See How Home Decor Market Demand is Rising in APAC Request Free Sample
The market is witnessing significant growth, particularly in the Asia Pacific (APAC) region, which accounted for the largest share of the global market in 2023. This trend is driven by several factors, including the rising disposable income, the recovery of the real estate market, increasing urbanization rates, and growing awareness levels. With nearly half of the APAC population residing in urban areas and this number projected to increase, the demand for home decor products is poised for a positive impact.
Moreover, the recovery of the regional real estate market is expected to boost homeownership rates, further fueling market growth. Urbanization has led to an increase in the number of new households being established, creating a burgeoning demand for home decor items to personalize and enhance living spaces. This dynamic market presents numerous opportunities for stakeholders and is expected to continue its robust growth trajectory.
Market Dynamics
Our researchers analyzed the data with 2024 as the base year, along with the key drivers, trends, and challenges. A holistic analysis of drivers will help companies refine their marketing strategies to gain a competitive advantage.
The market is a thriving industry that caters to the ever-evolving needs and preferences of homeowners worldwide. From the impact of lighting on mood to effective use of negative space, various elements play a crucial role in creating inviting and functional interior spaces. Lighting, a fundamental aspect of home decor, significantly influences the ambiance and overall aesthetic of a room. Properly selected lighting can enhance the beauty of decorative pieces, while also impacting our emotional well-being. Appropriate flooring choices, on the other hand, contribute to the durability and visual appeal of a space. Good space planning is essential in creating a harmonious and cohesive design style. Understanding different design styles and effectively incorporating them into your home is key to achieving a personalized look. Sustainable material choices not only contribute to eco-friendly living but also add character and uniqueness to your interiors. Effective use of color palettes and applying color psychology in decor can evoke specific emotions and set the tone for various rooms in your home. Creating a balanced room layout is crucial for maximizing functionality and visual appeal. Optimizing furniture placement and designing for accessibility needs ensure a comfortable and inclusive living environment. Incorporating smart home technology can add convenience and efficiency to your daily life. The impact of texture on visual appeal should not be overlooked, as it adds depth and dimension to your decor. Choosing appropriate window treatments and suitable wall decorations can complete the look of your space, while creating a visual hierarchy in design helps guide the eye and maintain a harmonious flow. Lastly, improving furniture arrangement and selecting appropriate furniture styles can ensure a cohesive and functional home decor setup.
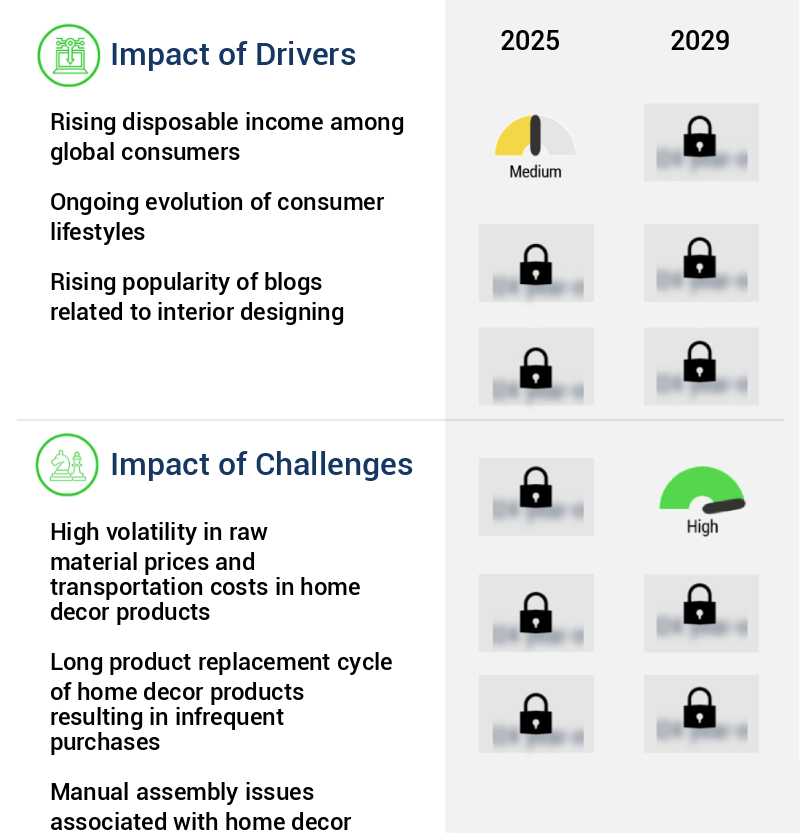
What are the key market drivers leading to the rise in the adoption of Home Decor Industry?
- The significant increase in disposable income among consumers worldwide serves as the primary catalyst for market growth.
- The market experiences continuous expansion as a result of the increasing disposable income among consumers worldwide. With economic development and income growth, individuals and households have more financial resources to allocate towards non-essential goods and services, including home decor items. This trend is particularly significant in emerging markets like India, China, Brazil, and South Africa, where rising affluence fuels a shift towards premium and designer home decor products. The home decor industry's robust growth is a testament to consumers' desire to enhance the aesthetics and functionality of their living spaces.
- This growth can be attributed to the increasing consumer focus on personalizing their homes and the growing trend towards sustainable and eco-friendly home decor solutions.
What are the market trends shaping the Home Decor Industry?
- The increasing demand for eco-friendly home decor items represents a notable market trend. A growing number of consumers are expressing a preference for sustainable decor solutions.
- The market is experiencing a significant shift towards eco-friendly solutions, driven by the increasing demand for sustainable buildings and interiors. This trend is particularly prominent in countries like Australia, China, Singapore, the US, and Canada, where firms are prioritizing eco-friendly housing projects due to client preferences and regulatory requirements. As a result, the application of environment-friendly furniture and furnishings is expanding rapidly in both the residential and commercial sectors.
- Moreover, the growing concern for health issues caused by traditional furniture, which often emits volatile organic compounds (VOCs), is fueling the preference for eco-friendly designs. This transition signifies a robust and evolving market that caters to the increasing demand for sustainable home decor solutions.
What challenges does the Home Decor Industry face during its growth?
- The home decor industry faces significant challenges due to the volatility in raw material prices and transportation costs, which can significantly impact industry growth. These fluctuations in expenses pose a substantial challenge to the industry's ability to maintain consistent profitability and sustain long-term growth.
- The market is undergoing significant changes, with raw material costs posing a significant challenge. Furniture manufacturers face increasing expenses due to the scarcity of furniture raw materials, such as springs, fabrics, board materials, mechanisms, feathers, fiber, and packaging goods. These rising costs have forced many to adjust their pricing strategies, making it difficult to maintain consistent product offerings. Additionally, transportation expenses have become a major concern, with freight prices accounting for a substantial portion of sourcing costs. The capacity of good transportation is currently limited, and tariffs have risen, exacerbating the issue. Despite these challenges, the market remains robust, with demand continuing to grow across various sectors, including residential, commercial, and hospitality.
- According to recent data, the market is projected to reach a value of over USD 500 billion by 2025, representing a substantial increase from its current market size.
Exclusive Technavio Analysis on Customer Landscape
The home decor market forecasting report includes the adoption lifecycle of the market, covering from the innovator's stage to the laggard's stage. It focuses on adoption rates in different regions based on penetration. Furthermore, the home decor market report also includes key purchase criteria and drivers of price sensitivity to help companies evaluate and develop their market growth analysis strategies.
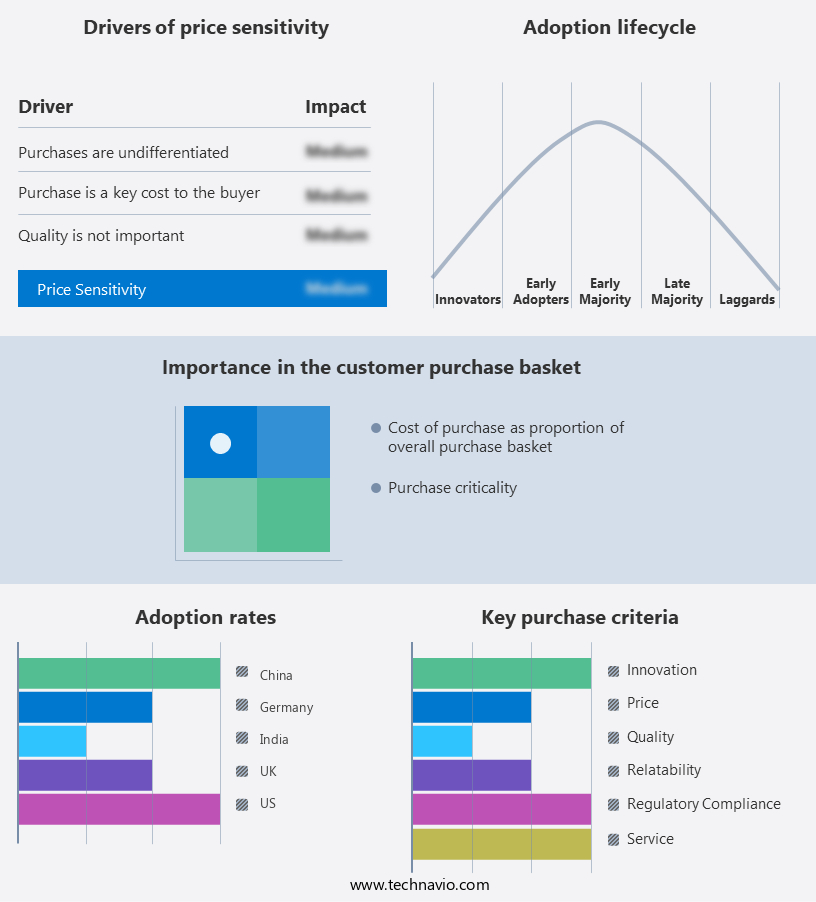
Customer Landscape of Home Decor Industry
Competitive Landscape
Companies are implementing various strategies, such as strategic alliances, home decor market forecast, partnerships, mergers and acquisitions, geographical expansion, and product/service launches, to enhance their presence in the industry.
Ashley Global Retail LLC - This company specializes in providing a range of home decor options, including wall mirrors, floor mirrors, and artificial plants, enhancing interior spaces with elegance and functionality.
The industry research and growth report includes detailed analyses of the competitive landscape of the market and information about key companies, including:
- Ashley Global Retail LLC
- AWI Licensing LLC
- Bansal Handicrafts
- Bed Bath and Beyond Inc.
- Crate and Barrel
- Duresta Upholstery Ltd.
- Home Decor International
- Home24 SE
- Inter IKEA Holding BV
- Kraphy
- Mannington Mills Inc.
- MillerKnoll Inc.
- Mohawk Industries Inc.
- Rhysley Group
- Shaw Industries Group Inc.
- Springs Window Fashions LLC
- The Home Depot Inc.
- U-LIKE Furniture
- Vetaas Nature.
- Wayfair Inc.
Qualitative and quantitative analysis of companies has been conducted to help clients understand the wider business environment as well as the strengths and weaknesses of key industry players. Data is qualitatively analyzed to categorize companies as pure play, category-focused, industry-focused, and diversified; it is quantitatively analyzed to categorize companies as dominant, leading, strong, tentative, and weak.
Recent Development and News in Home Decor Market
- In January 2024, IKEA, the global leader in home furnishings, introduced its new line of eco-friendly home decor, 'Björksta,' made primarily from recycled materials. This launch marked a significant strategic shift towards sustainable home decor solutions (IKEA Press Release).
- In March 2024, Crate & Barrel, a renowned home decor retailer, announced its merger with CB2, a modern and contemporary home decor brand. This merger aimed to expand Crate & Barrel's product offerings and cater to a broader customer base (Crate & Barrel Press Release).
- In April 2025, Wayfair, the largest online-only home goods retailer, secured a strategic partnership with Amazon Home Services. This collaboration enabled Wayfair to offer professional installation services for its home decor products through Amazon, enhancing the customer experience (Wayfair Press Release).
- In May 2025, the European Union passed the Circular Economy Act, mandating companies to take back and recycle or refurbish specific products, including home decor items. This regulatory initiative aimed to reduce waste and promote a more sustainable circular economy (European Commission Press Release).
Dive into Technavio's robust research methodology, blending expert interviews, extensive data synthesis, and validated models for unparalleled Home Decor Market insights. See full methodology.
|
Market Scope |
|
|
Report Coverage |
Details |
|
Page number |
226 |
|
Base year |
2024 |
|
Historic period |
2019-2023 |
|
Forecast period |
2025-2029 |
|
Growth momentum & CAGR |
Accelerate at a CAGR of 9.5% |
|
Market growth 2025-2029 |
USD 470.5 million |
|
Market structure |
Fragmented |
|
YoY growth 2024-2025(%) |
7.8 |
|
Key countries |
US, China, Japan, India, UK, Germany, Canada, South Korea, France, and Australia |
|
Competitive landscape |
Leading Companies, Market Positioning of Companies, Competitive Strategies, and Industry Risks |
Research Analyst Overview
- The market continues to evolve, with various sectors adopting new trends and technologies to enhance the living experience. Accessible design principles are gaining traction, ensuring furniture assembly instructions are clear and furniture is ergonomically designed for all users. Material selection guides prioritize sustainable design materials, while decorative accessories add texture and pattern to spaces. Window treatments selection and wallpaper pattern choices offer opportunities for personalization, with ambient lighting solutions creating inviting atmospheres. Home renovation projects incorporate natural light optimization and room layout optimization, using interior design software for design visualization and virtual staging. Lighting design principles and art placement strategies add depth to interiors, with color theory application guiding paint color palettes and upholstery fabric types.
- Home automation systems streamline furniture manufacturing processes and offer customization, while furniture arrangement planning and space planning techniques optimize functionality and aesthetics. Interior design styles continue to shift, with a growing emphasis on ergonomic furniture design and natural light optimization. The industry anticipates a 5% annual growth rate, reflecting the ongoing unfolding of market activities and evolving patterns. For instance, a recent study showed a 15% increase in sales of furniture with adjustable heights, catering to the needs of diverse users.
What are the Key Data Covered in this Home Decor Market Research and Growth Report?
-
What is the expected growth of the Home Decor Market between 2025 and 2029?
-
USD 470.5 million, at a CAGR of 9.5%
-
-
What segmentation does the market report cover?
-
The report is segmented by Product (Furniture, Floor coverings, and Others), Distribution Channel (Offline and Online), Price (Mass and Premium), Application (Indoor and Outdoor), Geography (APAC, North America, Europe, South America, and Middle East and Africa), End-User Type (Residential, Commercial, and Hospitality), and Material Type (Wood, Metal, Glass, Fabric, and Plastic)
-
-
Which regions are analyzed in the report?
-
APAC, North America, Europe, South America, and Middle East and Africa
-
-
What are the key growth drivers and market challenges?
-
Rising disposable income among global consumers, High volatility in raw material prices and transportation costs in home decor products
-
-
Who are the major players in the Home Decor Market?
-
Ashley Global Retail LLC, AWI Licensing LLC, Bansal Handicrafts, Bed Bath and Beyond Inc., Crate and Barrel, Duresta Upholstery Ltd., Home Decor International, Home24 SE, Inter IKEA Holding BV, Kraphy, Mannington Mills Inc., MillerKnoll Inc., Mohawk Industries Inc., Rhysley Group, Shaw Industries Group Inc., Springs Window Fashions LLC, The Home Depot Inc., U-LIKE Furniture, Vetaas Nature., and Wayfair Inc.
-
Market Research Insights
- The market is a continually evolving industry, with consumers seeking innovative and sustainable interior solutions. Two notable trends include the increasing popularity of pattern mixing techniques and the growing demand for furniture style guides. According to industry reports, sales of sustainably sourced materials have risen by 25% in the past year, reflecting a shift towards eco-conscious design. Furthermore, industry experts anticipate a 10% annual growth rate for the market over the next five years.
- For instance, a recent study showed that a furniture retailer experienced a 15% increase in sales after implementing a furniture style guide, enabling customers to make informed decisions based on their personal preferences and space requirements.
We can help! Our analysts can customize this home decor market research report to meet your requirements.
 RIA -
RIA - 
