Hangover Cure Products Market Analysis, Size, and Forecast 2024-2028: North America (US and Canada), Europe (France, Germany, Italy, and UK), Middle East and Africa (Egypt, KSA, Oman, and UAE), APAC (China, India, and Japan), South America (Argentina and Brazil), and Rest of World (ROW)

Hangover Cure Products Market Analysis, Size, and Forecast 2024-2028:
North America (US and Canada), Europe (France, Germany, Italy, and UK), Middle East and Africa (Egypt, KSA, Oman, and UAE), APAC (China, India, and Japan), South America (Argentina and Brazil), and Rest of World (ROW)

Published: Oct 2024 132 Pages SKU: IRTNTR71399

Market Overview at a Glance

$1.71 B
Market Opportunity
15.1%
CAGR
12.8
YoY growth 2023-2024(%)

Hangover Cure Products Market Size 2024-2028

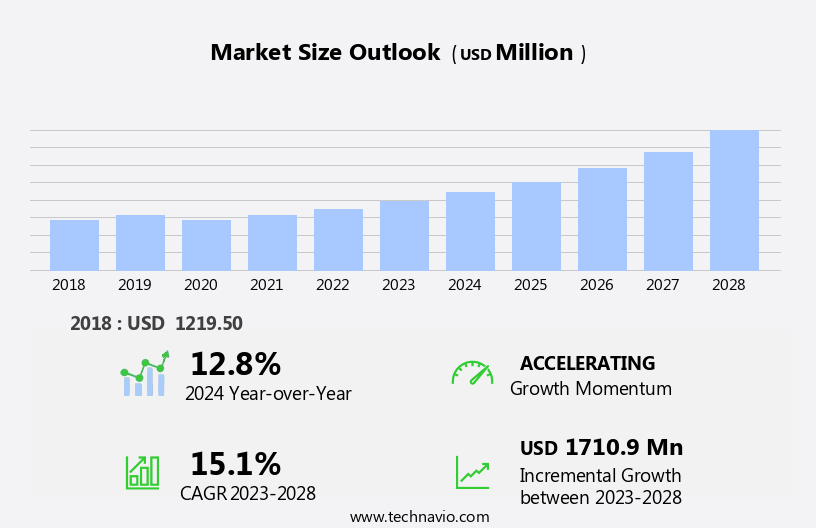
The hangover cure products market size is forecast to increase by USD 1.71 billion, at a CAGR of 15.1% between 2023 and 2028.

  • The market is driven by the increasing penetration of these products, as consumers continue to seek effective solutions to alleviate the symptoms of a hangover. This trend is further fueled by the development of hydration-focused remedies, which address the primary cause of hangover symptoms and dehydration. Another trend is the preference for herbal-based options, such as milk thistle, which support liver function and aid in nutrient replenishment. However, the market faces challenges in the form of limited availability of natural sources for hangover cures.
  • This constraint poses a significant challenge for manufacturers, as consumers increasingly demand natural and organic solutions. Companies seeking to capitalize on market opportunities must focus on sourcing sustainable, natural ingredients and developing innovative hydration-focused products. Effective navigation of these challenges will be crucial for market success.

What will be the Size of the Hangover Cure Products Market during the forecast period?

Hangover Cure Products Market Size

Explore in-depth regional segment analysis with market size data - historical 2018-2022 and forecasts 2024-2028 - in the full report.  
Request Free Sample

The market continues to evolve, with a focus on addressing the complex physiological effects of alcohol consumption. Companies are developing innovative solutions to improve hepatic function, reduce inflammation, and enhance recovery. Product efficacy is a top priority, with rigorous testing and clinical trials to ensure effectiveness. Nausea reduction methods are a key application, with oral rehydration therapy and rapid absorption formulas gaining popularity. Headache relief ingredients, such as aldehyde dehydrogenase activators and pain management components, are also in demand. Targeted delivery systems ensure efficient absorption, while blood sugar stabilization and gut microbiota balance further support overall health. Inflammation reduction is another critical area, with inflammation biomarkers being closely monitored.

Detoxification support, vitamin B complex, and liver enzyme protection are essential components of many formulations. Dosage optimization and gastric acid regulation are also important considerations to ensure product efficacy. Clinical trial results continue to emerge, providing valuable insights into the efficacy of various ingredients and formulations. Recovery optimization is a growing trend, with a focus on cellular repair mechanisms, acetaldehyde metabolism, and oxidative stress mitigation. Antioxidant supplementation, hydration enhancement, and sleep improvement are also key areas of interest. The market is dynamic, with ongoing research and development efforts aimed at addressing the diverse needs of consumers. Mineral supplementation, electrolyte replenishment, cognitive function support, and digestive enzyme support are just a few of the areas where innovation is driving growth.

The future of the market is bright, with a continued focus on scientifically-backed solutions to help consumers feel their best after a night of drinking.

How is this Hangover Cure Products Industry segmented?

The hangover cure products industry research report provides comprehensive data (region-wise segment analysis), with forecasts and estimates in "USD million" for the period 2024-2028, as well as historical data from 2018-2022 for the following segments.

  • Distribution Channel
    • Offline
    • Online
  • Product Type
    • Beverages
    • Capsules/Tablets
    • Patches
    • Powders
  • Formulation
    • Electrolyte-Based
    • Herbal-Based
    • Vitamin-Based
    • Combination
  • Target Consumer
    • Social Drinkers
    • Young Adults
    • Professionals
    • Travelers
  • Geography
    • North America
      • US
      • Canada
    • Europe
      • France
      • Germany
      • Italy
      • UK
    • Middle East and Africa
      • Egypt
      • KSA
      • Oman
      • UAE
    • APAC
      • China
      • India
      • Japan
    • South America
      • Argentina
      • Brazil
    • Rest of World (ROW)

By Distribution Channel Insights

The offline segment is estimated to witness significant growth during the forecast period.

In the dynamic market for hangover cure products, several entities play pivotal roles in enhancing product efficacy and consumer satisfaction. Hepatic function improvement is a key focus, with product development centered around detoxification support, aldehyde dehydrogenase activation, and cellular repair mechanisms. Clinical trials and rigorous testing ensure the reliability of these solutions, while targeted delivery systems and rapid absorption formulas optimize recovery. Nausea reduction methods, including inflammation reduction and headache relief ingredients, are essential components of these products. Inflammation biomarkers are closely monitored to assess product effectiveness, with vitamin B complex and minerals supplementation playing crucial roles in supporting overall health.

Hydration enhancement, blood sugar stabilization, and gut microbiota balance are other critical aspects, all aimed at optimizing recovery and mitigating the symptoms of a hangover. Moreover, pain management, oxidative stress mitigation, and antioxidant supplementation contribute to the holistic approach of these products. Sleep improvement and digestive enzyme support further enhance the consumer experience. The market is witnessing significant advancements, with dosage optimization, gastric acid regulation, and plasma concentration monitoring ensuring precise delivery and optimal results. The offline distribution channel continues to dominate the market, with convenience stores and supermarkets accounting for the majority of sales. Competition among companies is fierce, with consumers drawn to retail stores due to attractive discounts, a wide product range, and expert customer service.

Factors such as convenience, product mix, and availability of different brands influence purchasing decisions. As the market evolves, innovation and consumer demand will continue to shape its future.

Hangover Cure Products Market Size

Request Free Sample

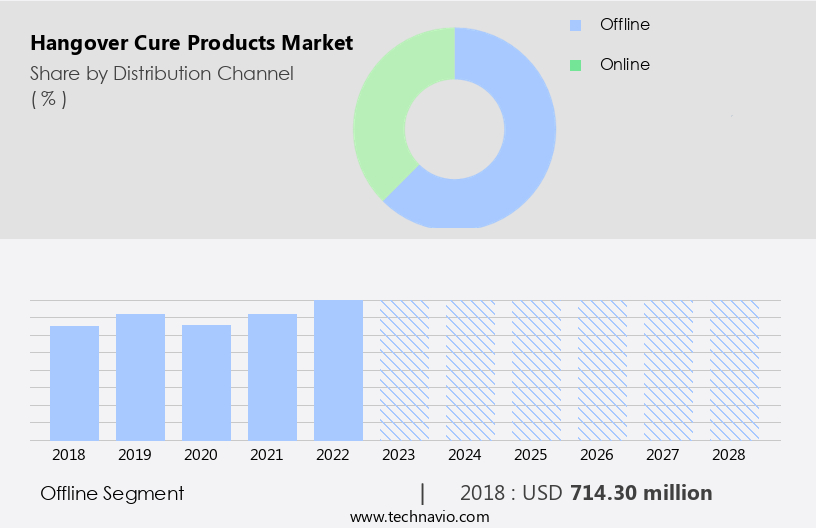
The Offline segment was valued at USD 714.30 billion in 2018 and showed a gradual increase during the forecast period.

Regional Analysis

APAC is estimated to contribute 54% to the growth of the global market during the forecast period.Technavio's analysts have elaborately explained the regional trends and drivers that shape the market during the forecast period.

Hangover Cure Products Market Share by Geography

 Request Free Sample

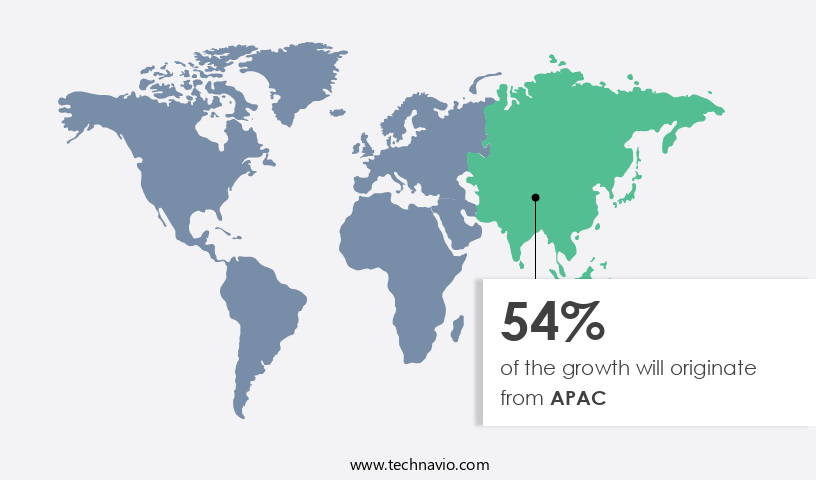
The market for hangover cure products is experiencing significant growth in the Asia Pacific (APAC) region, driven by increasing consumer awareness regarding alcohol detoxification and the benefits of herbal remedies. Herbal ingredients and a favorable nutritional profile are key factors influencing consumer preferences. In APAC, various herb-based and botanical products are gaining traction, with product promotion playing a crucial role in consumer decision-making. These supplements aim to address multiple symptoms associated with hangovers, including nausea reduction, inflammation reduction, detoxification support, and headache relief. Product efficacy testing and clinical trial results are essential to ensure consumer trust and confidence.

Recovery optimization, oral rehydration therapy, and rapid absorption formulas are other essential features. Inflammation biomarkers, aldehyde dehydrogenase activation, cellular repair mechanisms, and acetaldehyde metabolism are targeted to enhance hydration, reduce fatigue, and support cognitive function. Antioxidant supplementation, liver enzyme protection, and mineral supplementation are integral components, as are dosage optimization, gastric acid regulation, and plasma concentration monitoring. Pain management, oxidative stress mitigation, and sleep improvement are additional benefits sought by consumers. Digestive enzyme support and electrolyte replenishment are also essential for restoring balance in the body. The market is expected to continue its growth trajectory during the forecast period, with a focus on product innovation and consumer education.

Market Dynamics

The Global Hangover Cure Products Market is experiencing substantial hangover cure products market growth, driven by increasing alcohol consumption globally and a corresponding rising health consciousness among consumers. This has fueled demand for various solutions, from conventional hangover pills and hangover supplements to more innovative hangover drinks and hangover patches. A significant hangover cure products market trend involves a growing preference for natural hangover cure ingredients and herbal hangover remedies, often focusing on electrolyte hangover cure and liver support supplements. The Global hangover cure products market size continues to expand as manufacturers develop effective hangover prevention products and targeted hangover relief products, with Vitamin B complex for hangover being a common component. This market primarily targets young adults, leveraging E-commerce (hangover products) for broader reach and continuous new product development to cater to evolving needs.

Our researchers analyzed the data with 2023 as the base year, along with the key drivers, trends, and challenges. A holistic analysis of drivers will help companies refine their marketing strategies to gain a competitive advantage.

What are the key market drivers leading to the rise in the adoption of Hangover Cure Products Industry?

  • The significant expansion of the market for hangover cure products is primarily attributed to their increasing penetration. 
  • The market for hangover cure products is witnessing significant growth due to increasing consumer awareness and the availability of a wide range of effective solutions. These products cater to various health concerns associated with alcohol consumption, such as oxidative stress mitigation, antioxidant supplementation, sleep improvement, digestive enzyme support, electrolyte replenishment, and cognitive function support. Brands like Morning Fresh in India and Morning Recovery in the US are gaining popularity with their natural ingredient-based offerings and expanding distribution channels. The growing trend of consuming these products, particularly among millennials, is expected to fuel market growth during the forecast period.
  • Hangover cure products provide relief from hangover symptoms by inhibiting alcohol dehydrogenase, a key enzyme involved in alcohol metabolism, and enhancing the body's natural recovery process. The market's growth is further driven by the convenience and accessibility of these products through both online and offline channels.

What are the market trends shaping the Hangover Cure Products Industry?

  • The trend in the market is shifting towards the development of hydration-focused remedies for hangovers. This emerging trend reflects a growing awareness of the importance of rehydration in mitigating the symptoms of a hangover.
  • The global market for hangover cure products witnessed significant expansion in 2023, with a focus on solutions that enhance hepatic function and reduce inflammation. This growth can be attributed to the increasing awareness of the role of liver health and inflammation in the recovery process from alcohol consumption. Product efficacy is a top priority for consumers, leading to the implementation of rigorous testing methods to validate the inflammation reduction and detoxification support capabilities of these products. Manufacturers have responded to this demand by introducing a variety of offerings, such as vitamin B complex supplements and inflammation reduction formulas.
  • Clinical trial results have demonstrated the effectiveness of these products in reducing nausea, headaches, and other hangover symptoms. The market's continued growth is fueled by the ongoing research and development efforts aimed at optimizing recovery and improving overall well-being. These advancements have made hangover cure products an essential addition to many consumers' post-alcohol consumption routines.

What challenges does the Hangover Cure Products Industry face during its growth?

  • The limited availability of natural sources for producing hangover cure products poses a significant challenge to the industry's growth trajectory. 
  • The global market for hangover cure products is experiencing challenges due to the scarcity of natural resources required for manufacturing these remedies. Key components, such as ginger, milk thistle, and specific vitamins, are integral to creating effective hangover solutions that resonate with health-conscious consumers. However, the depletion of these resources is a result of overharvesting, inadequate farming practices, and environmental alterations impacting crop production. This scarcity not only increases the cost of raw materials but also restricts manufacturers' ability to meet the escalating demand for natural and organic products. Consequently, the market growth for hangover cure products is impeded by these supply chain constraints, which hinder the introduction of both new and existing solutions.
  • Oral rehydration therapy, rapid absorption formulas, headache relief ingredients, targeted delivery systems, blood sugar stabilization, gut microbiota balance, aldehyde dehydratase activation, and cellular repair mechanisms are crucial elements in hangover cure formulations. Addressing the scarcity of essential resources and ensuring sustainable farming practices is essential to overcoming these challenges and fostering market expansion.

Exclusive Customer Landscape

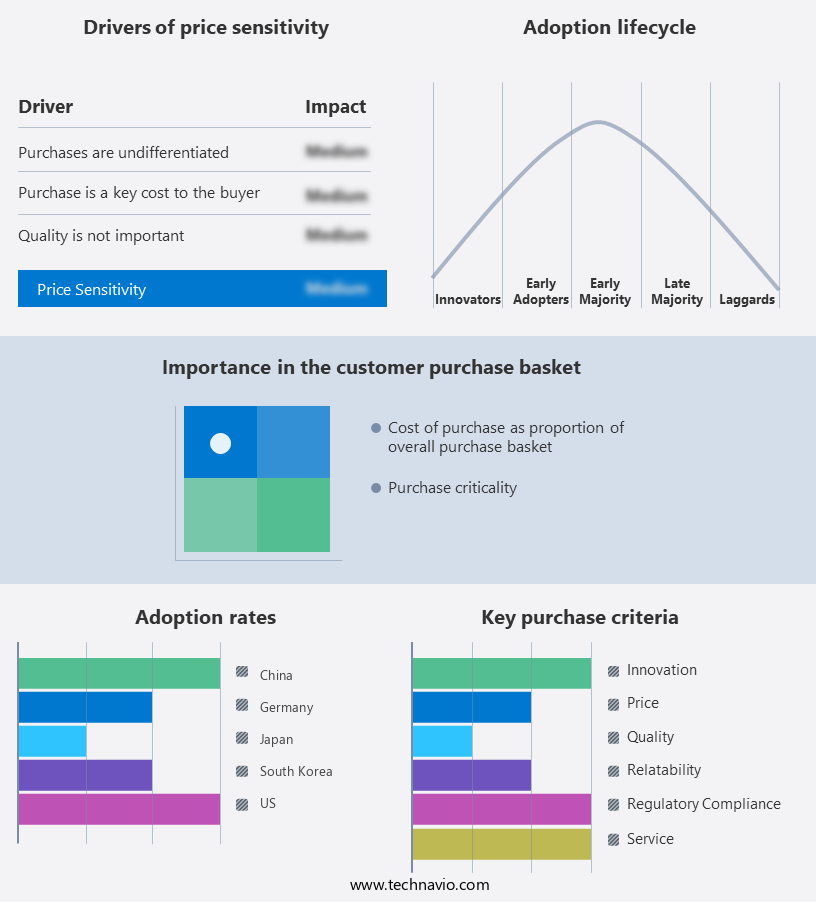
The hangover cure products market forecasting report includes the adoption lifecycle of the market, covering from the innovator's stage to the laggard's stage. It focuses on adoption rates in different regions based on penetration. Furthermore, the hangover cure products market report also includes key purchase criteria and drivers of price sensitivity to help companies evaluate and develop their market growth analysis strategies.

Hangover Cure Products Market Share by Geography

 Customer Landscape

Key Companies & Market Insights

Companies are implementing various strategies, such as strategic alliances, hangover cure products market forecast, partnerships, mergers and acquisitions, geographical expansion, and product/service launches, to enhance their presence in the industry.

82 Labs Inc. - The brand Morning Recovery produces a range of capsules designed for hangover relief. These innovative solutions cater to various recovery needs, enhancing consumer wellness and convenience.

The industry research and growth report includes detailed analyses of the competitive landscape of the market and information about key companies, including:

  • 82 Labs Inc.
  • Abbott Laboratories
  • AfterDrink Ltd.
  • Bayer AG
  • Bytox Inc
  • Cheal
  • Cheers Health Inc.
  • DOTSHOTs.in
  • DrinkAde
  • drinkwel LLC
  • EZ Lifestyle INC
  • Flyby
  • Himalaya Global Holdings Ltd.
  • Kaplan Laboratory LLC
  • LES Labs
  • No Days Wasted
  • Purple Tree Labs
  • Rally Labs LLC
  • Toniiq LLC
  • Unilever PLC

Qualitative and quantitative analysis of companies has been conducted to help clients understand the wider business environment as well as the strengths and weaknesses of key industry players. Data is qualitatively analyzed to categorize companies as pure play, category-focused, industry-focused, and diversified; it is quantitatively analyzed to categorize companies as dominant, leading, strong, tentative, and weak.

Recent Development and News in Hangover Cure Products Market

  • In January 2024, leading beverage company Diageo announced the launch of its new product, Ritual Zero Proof, a line of alcohol-free spirits designed to help consumers manage hangovers. The product line includes a gin, vodka, and tequila, and is marketed as a solution for those who want to enjoy social occasions without the negative effects of alcohol (Diageo Press Release, 2024).
  • In March 2024, pharmaceutical giant Pfizer entered the hangover cure market through its acquisition of a majority stake in DrinkAde, a company specializing in oral rehydration tablets. The acquisition was valued at USD350 million and aimed to expand Pfizer's consumer health portfolio (Reuters, 2024).
  • In April 2025, the U.S. Food and Drug Administration (FDA) approved the marketing of Dihydromyricetin (DHM), a natural compound found in the Chinese herb Hovenia dulcis, as a dietary supplement for the relief of hangover symptoms. The approval paved the way for several companies to launch DHM-based supplements (FDA, 2025).
  • In May 2025, Japanese beverage giant Suntory Holdings announced a strategic partnership with South Korean cosmetics giant AmorePacific to develop and market a line of hangover prevention and recovery products. The collaboration combined Suntory's expertise in beverages with AmorePacific's knowledge of skincare and cosmetics (Bloomberg, 2025).

Research Analyst Overview

  • The hangover cure product market is witnessing significant activity and trends, driven by the scientific validation of various ingredients and clinical trials. Patient feedback plays a crucial role in market adoption, with consumers seeking products that ensure consumer safety and product differentiation. Intravenous delivery and sublingual administration are gaining popularity for their rapid acting formula and nutrient absorption. Ingredient sourcing and quality control measures are essential for maintaining regulatory compliance and demonstrating health benefits. Natural ingredients, such as herbal remedies, are favored for their safety profile assessment and ingredient bioavailability.
  • Product stability testing and shelf life extension are also key considerations for manufacturers. Sustained release technology and liver function restoration offer a competitive advantage in the market. Consumer reviews and toxicology studies contribute to the overall market growth. Distribution channels and manufacturing processes are also critical factors influencing market dynamics.

Dive into Technavio's robust research methodology, blending expert interviews, extensive data synthesis, and validated models for unparalleled Hangover Cure Products Market insights. See full methodology.

Market Scope

Report Coverage

Details

Page number

132

Base year

2023

Historic period

2018-2022

Forecast period

2024-2028

Growth momentum & CAGR

Accelerate at a CAGR of 15.1%

Market growth 2024-2028

USD 1710.9 million

Market structure

Fragmented

YoY growth 2023-2024(%)

12.8

Key countries

US, Canada, Germany, UK, Italy, France, China, India, Japan, Brazil, Egypt, UAE, Oman, Argentina, KSA, UAE, Brazil, and Rest of World (ROW)

Competitive landscape

Leading Companies, Market Positioning of Companies, Competitive Strategies, and Industry Risks

Request Free Sample

What are the Key Data Covered in this Hangover Cure Products Market Research and Growth Report?

  • CAGR of the Hangover Cure Products industry during the forecast period
  • Detailed information on factors that will drive the growth and forecasting between 2024 and 2028
  • Precise estimation of the size of the market and its contribution of the industry in focus to the parent market
  • Accurate predictions about upcoming growth and trends and changes in consumer behaviour
  • Growth of the market across APAC, North America, Europe, South America, and Middle East and Africa
  • Thorough analysis of the market's competitive landscape and detailed information about companies
  • Comprehensive analysis of factors that will challenge the hangover cure products market growth of industry companies

We can help! Our analysts can customize this hangover cure products market research report to meet your requirements.

Get in touch

1 Executive Summary

  • 1.1 Market overview
    • Executive Summary - Chart on Market Overview
    • Executive Summary - Data Table on Market Overview
    • Executive Summary - Chart on Global Market Characteristics
    • Executive Summary - Chart on Market by Geography
    • Executive Summary - Chart on Market Segmentation by Distribution Channel
    • Executive Summary - Chart on Incremental Growth
    • Executive Summary - Data Table on Incremental Growth
    • Executive Summary - Chart on Company Market Positioning

2 Market Landscape

  • 2.1 Market ecosystem
    • Parent Market
    • Data Table on - Parent Market
  • 2.2 Market characteristics
    • Market characteristics analysis
  • 2.3 Value chain analysis
    • Value Chain Analysis

3 Market Sizing

  • 3.1 Market definition
    • Offerings of companies included in the market definition
  • 3.2 Market segment analysis
    • Market segments
  • 3.3 Market size 2023
    • 3.4 Market outlook: Forecast for 2023-2028
      • Chart on Global - Market size and forecast 2023-2028 ($ million)
      • Data Table on Global - Market size and forecast 2023-2028 ($ million)
      • Chart on Global Market: Year-over-year growth 2023-2028 (%)
      • Data Table on Global Market: Year-over-year growth 2023-2028 (%)

    4 Historic Market Size

    • 4.1 Global Hangover Cure Products Market 2018 - 2022
      • Historic Market Size - Data Table on Global Hangover Cure Products Market 2018 - 2022 ($ million)
    • 4.2 Distribution Channel segment analysis 2018 - 2022
      • Historic Market Size - Distribution Channel Segment 2018 - 2022 ($ million)
    • 4.3 Geography segment analysis 2018 - 2022
      • Historic Market Size - Geography Segment 2018 - 2022 ($ million)
    • 4.4 Country segment analysis 2018 - 2022
      • Historic Market Size - Country Segment 2018 - 2022 ($ million)

    5 Five Forces Analysis

    • 5.1 Five forces summary
      • Five forces analysis - Comparison between 2023 and 2028
    • 5.2 Bargaining power of buyers
      • Bargaining power of buyers - Impact of key factors 2023 and 2028
    • 5.3 Bargaining power of suppliers
      • Bargaining power of suppliers - Impact of key factors in 2023 and 2028
    • 5.4 Threat of new entrants
      • Threat of new entrants - Impact of key factors in 2023 and 2028
    • 5.5 Threat of substitutes
      • Threat of substitutes - Impact of key factors in 2023 and 2028
    • 5.6 Threat of rivalry
      • Threat of rivalry - Impact of key factors in 2023 and 2028
    • 5.7 Market condition
      • Chart on Market condition - Five forces 2023 and 2028

    6 Market Segmentation by Distribution Channel

    • 6.1 Market segments
      • Chart on Distribution Channel - Market share (2023-2028) (%)
      • Data Table on Distribution Channel - Market share (2023-2028) (%)
    • 6.2 Comparison by Distribution Channel
      • Chart on Comparison by Distribution Channel
      • Data Table on Comparison by Distribution Channel
    • 6.3 Offline - Market size and forecast (2023-2028)
      • Chart on Offline - Market size and forecast (2023-2028) ($ million)
      • Data Table on Offline - Market size and forecast (2023-2028) ($ million)
      • Chart on Offline - Year-over-year growth (2023-2028) (%)
      • Data Table on Offline - Year-over-year growth (2023-2028) (%)
    • 6.4 Online - Market size and forecast (2023-2028)
      • Chart on Online - Market size and forecast (2023-2028) ($ million)
      • Data Table on Online - Market size and forecast (2023-2028) ($ million)
      • Chart on Online - Year-over-year growth (2023-2028) (%)
      • Data Table on Online - Year-over-year growth (2023-2028) (%)
    • 6.5 Market opportunity by Distribution Channel
      • Market opportunity by Distribution Channel ($ million)
      • Data Table on Market opportunity by Distribution Channel ($ million)

    7 Market Segmentation by Product Type

    • 7.1 Market segments
      • Chart on Product Type - Market share (2023-2028) (%)
      • Data Table on Product Type - Market share (2023-2028) (%)
    • 7.2 Comparison by Product Type
      • Chart on Comparison by Product Type
      • Data Table on Comparison by Product Type
    • 7.3 Beverages - Market size and forecast (2023-2028)
      • Chart on Beverages - Market size and forecast (2023-2028) ($ million)
      • Data Table on Beverages - Market size and forecast (2023-2028) ($ million)
      • Chart on Beverages - Year-over-year growth (2023-2028) (%)
      • Data Table on Beverages - Year-over-year growth (2023-2028) (%)
    • 7.4 Capsules/Tablets - Market size and forecast (2023-2028)
      • Chart on Capsules/Tablets - Market size and forecast (2023-2028) ($ million)
      • Data Table on Capsules/Tablets - Market size and forecast (2023-2028) ($ million)
      • Chart on Capsules/Tablets - Year-over-year growth (2023-2028) (%)
      • Data Table on Capsules/Tablets - Year-over-year growth (2023-2028) (%)
    • 7.5 Patches - Market size and forecast (2023-2028)
      • Chart on Patches - Market size and forecast (2023-2028) ($ million)
      • Data Table on Patches - Market size and forecast (2023-2028) ($ million)
      • Chart on Patches - Year-over-year growth (2023-2028) (%)
      • Data Table on Patches - Year-over-year growth (2023-2028) (%)
    • 7.6 Powders - Market size and forecast (2023-2028)
      • Chart on Powders - Market size and forecast (2023-2028) ($ million)
      • Data Table on Powders - Market size and forecast (2023-2028) ($ million)
      • Chart on Powders - Year-over-year growth (2023-2028) (%)
      • Data Table on Powders - Year-over-year growth (2023-2028) (%)
    • 7.7 Market opportunity by Product Type
      • Market opportunity by Product Type ($ million)
      • Data Table on Market opportunity by Product Type ($ million)

    8 Market Segmentation by Formulation

    • 8.1 Market segments
      • Chart on Formulation - Market share (2023-2028) (%)
      • Data Table on Formulation - Market share (2023-2028) (%)
    • 8.2 Comparison by Formulation
      • Chart on Comparison by Formulation
      • Data Table on Comparison by Formulation
    • 8.3 Electrolyte-Based - Market size and forecast (2023-2028)
      • Chart on Electrolyte-Based - Market size and forecast (2023-2028) ($ million)
      • Data Table on Electrolyte-Based - Market size and forecast (2023-2028) ($ million)
      • Chart on Electrolyte-Based - Year-over-year growth (2023-2028) (%)
      • Data Table on Electrolyte-Based - Year-over-year growth (2023-2028) (%)
    • 8.4 Herbal-Based - Market size and forecast (2023-2028)
      • Chart on Herbal-Based - Market size and forecast (2023-2028) ($ million)
      • Data Table on Herbal-Based - Market size and forecast (2023-2028) ($ million)
      • Chart on Herbal-Based - Year-over-year growth (2023-2028) (%)
      • Data Table on Herbal-Based - Year-over-year growth (2023-2028) (%)
    • 8.5 Vitamin-Based - Market size and forecast (2023-2028)
      • Chart on Vitamin-Based - Market size and forecast (2023-2028) ($ million)
      • Data Table on Vitamin-Based - Market size and forecast (2023-2028) ($ million)
      • Chart on Vitamin-Based - Year-over-year growth (2023-2028) (%)
      • Data Table on Vitamin-Based - Year-over-year growth (2023-2028) (%)
    • 8.6 Combination - Market size and forecast (2023-2028)
      • Chart on Combination - Market size and forecast (2023-2028) ($ million)
      • Data Table on Combination - Market size and forecast (2023-2028) ($ million)
      • Chart on Combination - Year-over-year growth (2023-2028) (%)
      • Data Table on Combination - Year-over-year growth (2023-2028) (%)
    • 8.7 Market opportunity by Formulation
      • Market opportunity by Formulation ($ million)
      • Data Table on Market opportunity by Formulation ($ million)

    9 Market Segmentation by Target Consumer

    • 9.1 Market segments
      • Chart on Target Consumer - Market share (2023-2028) (%)
      • Data Table on Target Consumer - Market share (2023-2028) (%)
    • 9.2 Comparison by Target Consumer
      • Chart on Comparison by Target Consumer
      • Data Table on Comparison by Target Consumer
    • 9.3 Social Drinkers - Market size and forecast (2023-2028)
      • Chart on Social Drinkers - Market size and forecast (2023-2028) ($ million)
      • Data Table on Social Drinkers - Market size and forecast (2023-2028) ($ million)
      • Chart on Social Drinkers - Year-over-year growth (2023-2028) (%)
      • Data Table on Social Drinkers - Year-over-year growth (2023-2028) (%)
    • 9.4 Young Adults - Market size and forecast (2023-2028)
      • Chart on Young Adults - Market size and forecast (2023-2028) ($ million)
      • Data Table on Young Adults - Market size and forecast (2023-2028) ($ million)
      • Chart on Young Adults - Year-over-year growth (2023-2028) (%)
      • Data Table on Young Adults - Year-over-year growth (2023-2028) (%)
    • 9.5 Professionals - Market size and forecast (2023-2028)
      • Chart on Professionals - Market size and forecast (2023-2028) ($ million)
      • Data Table on Professionals - Market size and forecast (2023-2028) ($ million)
      • Chart on Professionals - Year-over-year growth (2023-2028) (%)
      • Data Table on Professionals - Year-over-year growth (2023-2028) (%)
    • 9.6 Travelers - Market size and forecast (2023-2028)
      • Chart on Travelers - Market size and forecast (2023-2028) ($ million)
      • Data Table on Travelers - Market size and forecast (2023-2028) ($ million)
      • Chart on Travelers - Year-over-year growth (2023-2028) (%)
      • Data Table on Travelers - Year-over-year growth (2023-2028) (%)
    • 9.7 Market opportunity by Target Consumer
      • Market opportunity by Target Consumer ($ million)
      • Data Table on Market opportunity by Target Consumer ($ million)

    10 Customer Landscape

    • 10.1 Customer landscape overview
      • Analysis of price sensitivity, lifecycle, customer purchase basket, adoption rates, and purchase criteria

    11 Geographic Landscape

    • 11.1 Geographic segmentation
      • Chart on Market share by geography 2023-2028 (%)
      • Data Table on Market share by geography 2023-2028 (%)
    • 11.2 Geographic comparison
      • Chart on Geographic comparison
      • Data Table on Geographic comparison
    • 11.3 APAC - Market size and forecast 2023-2028
      • Chart on APAC - Market size and forecast 2023-2028 ($ million)
      • Data Table on APAC - Market size and forecast 2023-2028 ($ million)
      • Chart on APAC - Year-over-year growth 2023-2028 (%)
      • Data Table on APAC - Year-over-year growth 2023-2028 (%)
    • 11.4 North America - Market size and forecast 2023-2028
      • Chart on North America - Market size and forecast 2023-2028 ($ million)
      • Data Table on North America - Market size and forecast 2023-2028 ($ million)
      • Chart on North America - Year-over-year growth 2023-2028 (%)
      • Data Table on North America - Year-over-year growth 2023-2028 (%)
    • 11.5 Europe - Market size and forecast 2023-2028
      • Chart on Europe - Market size and forecast 2023-2028 ($ million)
      • Data Table on Europe - Market size and forecast 2023-2028 ($ million)
      • Chart on Europe - Year-over-year growth 2023-2028 (%)
      • Data Table on Europe - Year-over-year growth 2023-2028 (%)
    • 11.6 South America - Market size and forecast 2023-2028
      • Chart on South America - Market size and forecast 2023-2028 ($ million)
      • Data Table on South America - Market size and forecast 2023-2028 ($ million)
      • Chart on South America - Year-over-year growth 2023-2028 (%)
      • Data Table on South America - Year-over-year growth 2023-2028 (%)
    • 11.7 Middle East and Africa - Market size and forecast 2023-2028
      • Chart on Middle East and Africa - Market size and forecast 2023-2028 ($ million)
      • Data Table on Middle East and Africa - Market size and forecast 2023-2028 ($ million)
      • Chart on Middle East and Africa - Year-over-year growth 2023-2028 (%)
      • Data Table on Middle East and Africa - Year-over-year growth 2023-2028 (%)
    • 11.8 US - Market size and forecast 2023-2028
      • Chart on US - Market size and forecast 2023-2028 ($ million)
      • Data Table on US - Market size and forecast 2023-2028 ($ million)
      • Chart on US - Year-over-year growth 2023-2028 (%)
      • Data Table on US - Year-over-year growth 2023-2028 (%)
    • 11.9 Japan - Market size and forecast 2023-2028
      • Chart on Japan - Market size and forecast 2023-2028 ($ million)
      • Data Table on Japan - Market size and forecast 2023-2028 ($ million)
      • Chart on Japan - Year-over-year growth 2023-2028 (%)
      • Data Table on Japan - Year-over-year growth 2023-2028 (%)
    • 11.10 South Korea - Market size and forecast 2023-2028
      • Chart on South Korea - Market size and forecast 2023-2028 ($ million)
      • Data Table on South Korea - Market size and forecast 2023-2028 ($ million)
      • Chart on South Korea - Year-over-year growth 2023-2028 (%)
      • Data Table on South Korea - Year-over-year growth 2023-2028 (%)
    • 11.11 China - Market size and forecast 2023-2028
      • Chart on China - Market size and forecast 2023-2028 ($ million)
      • Data Table on China - Market size and forecast 2023-2028 ($ million)
      • Chart on China - Year-over-year growth 2023-2028 (%)
      • Data Table on China - Year-over-year growth 2023-2028 (%)
    • 11.12 Germany - Market size and forecast 2023-2028
      • Chart on Germany - Market size and forecast 2023-2028 ($ million)
      • Data Table on Germany - Market size and forecast 2023-2028 ($ million)
      • Chart on Germany - Year-over-year growth 2023-2028 (%)
      • Data Table on Germany - Year-over-year growth 2023-2028 (%)
    • 11.13 Market opportunity by geography
      • Market opportunity by geography ($ million)
      • Data Tables on Market opportunity by geography ($ million)
    • 11.14 Canada - Market size and forecast (2023-2028)
      • Chart on Canada - Market size and forecast (2023-2028) ($ million)
      • Data Table on Canada - Market size and forecast (2023-2028) ($ million)
      • Chart on Canada - Year-over-year growth (2023-2028) (%)
      • Data Table on Canada - Year-over-year growth (2023-2028) (%)
    • 11.15 UK - Market size and forecast (2023-2028)
      • Chart on UK - Market size and forecast (2023-2028) ($ million)
      • Data Table on UK - Market size and forecast (2023-2028) ($ million)
      • Chart on UK - Year-over-year growth (2023-2028) (%)
      • Data Table on UK - Year-over-year growth (2023-2028) (%)
    • 11.16 Italy - Market size and forecast (2023-2028)
      • Chart on Italy - Market size and forecast (2023-2028) ($ million)
      • Data Table on Italy - Market size and forecast (2023-2028) ($ million)
      • Chart on Italy - Year-over-year growth (2023-2028) (%)
      • Data Table on Italy - Year-over-year growth (2023-2028) (%)
    • 11.17 France - Market size and forecast (2023-2028)
      • Chart on France - Market size and forecast (2023-2028) ($ million)
      • Data Table on France - Market size and forecast (2023-2028) ($ million)
      • Chart on France - Year-over-year growth (2023-2028) (%)
      • Data Table on France - Year-over-year growth (2023-2028) (%)
    • 11.18 India - Market size and forecast (2023-2028)
      • Chart on India - Market size and forecast (2023-2028) ($ million)
      • Data Table on India - Market size and forecast (2023-2028) ($ million)
      • Chart on India - Year-over-year growth (2023-2028) (%)
      • Data Table on India - Year-over-year growth (2023-2028) (%)
    • 11.19 Brazil - Market size and forecast (2023-2028)
      • Chart on Brazil - Market size and forecast (2023-2028) ($ million)
      • Data Table on Brazil - Market size and forecast (2023-2028) ($ million)
      • Chart on Brazil - Year-over-year growth (2023-2028) (%)
      • Data Table on Brazil - Year-over-year growth (2023-2028) (%)
    • 11.20 Egypt - Market size and forecast (2023-2028)
      • Chart on Egypt - Market size and forecast (2023-2028) ($ million)
      • Data Table on Egypt - Market size and forecast (2023-2028) ($ million)
      • Chart on Egypt - Year-over-year growth (2023-2028) (%)
      • Data Table on Egypt - Year-over-year growth (2023-2028) (%)
    • 11.21 UAE - Market size and forecast (2023-2028)
      • Chart on UAE - Market size and forecast (2023-2028) ($ million)
      • Data Table on UAE - Market size and forecast (2023-2028) ($ million)
      • Chart on UAE - Year-over-year growth (2023-2028) (%)
      • Data Table on UAE - Year-over-year growth (2023-2028) (%)
    • 11.22 Oman - Market size and forecast (2023-2028)
      • Chart on Oman - Market size and forecast (2023-2028) ($ million)
      • Data Table on Oman - Market size and forecast (2023-2028) ($ million)
      • Chart on Oman - Year-over-year growth (2023-2028) (%)
      • Data Table on Oman - Year-over-year growth (2023-2028) (%)
    • 11.23 Argentina - Market size and forecast (2023-2028)
      • Chart on Argentina - Market size and forecast (2023-2028) ($ million)
      • Data Table on Argentina - Market size and forecast (2023-2028) ($ million)
      • Chart on Argentina - Year-over-year growth (2023-2028) (%)
      • Data Table on Argentina - Year-over-year growth (2023-2028) (%)
    • 11.24 KSA - Market size and forecast (2023-2028)
      • Chart on KSA - Market size and forecast (2023-2028) ($ million)
      • Data Table on KSA - Market size and forecast (2023-2028) ($ million)
      • Chart on KSA - Year-over-year growth (2023-2028) (%)
      • Data Table on KSA - Year-over-year growth (2023-2028) (%)
    • 11.25 Rest of World (ROW) - Market size and forecast (2023-2028)
      • Chart on Rest of World (ROW) - Market size and forecast (2023-2028) ($ million)
      • Data Table on Rest of World (ROW) - Market size and forecast (2023-2028) ($ million)
      • Chart on Rest of World (ROW) - Year-over-year growth (2023-2028) (%)
      • Data Table on Rest of World (ROW) - Year-over-year growth (2023-2028) (%)

    12 Drivers, Challenges, and Opportunity/Restraints

    • 12.1 Market drivers
      • 12.2 Market challenges
        • 12.3 Impact of drivers and challenges
          • Impact of drivers and challenges in 2023 and 2028
        • 12.4 Market opportunities/restraints

          13 Competitive Landscape

          • 13.1 Overview
            • 13.2 Competitive Landscape
              • Overview on criticality of inputs and factors of differentiation
            • 13.3 Landscape disruption
              • Overview on factors of disruption
            • 13.4 Industry risks
              • Impact of key risks on business

            14 Competitive Analysis

            • 14.1 Companies profiled
              • Companies covered
            • 14.2 Market positioning of companies
              • Matrix on companies position and classification
            • 82 Labs Inc.
              • 82 Labs Inc. - Overview
              • 82 Labs Inc. - Product / Service
              • 82 Labs Inc. - Key offerings
            • 14.4 Abbott Laboratories
              • Abbott Laboratories - Overview
              • Abbott Laboratories - Business segments
              • Abbott Laboratories - Key news
              • Abbott Laboratories - Key offerings
              • Abbott Laboratories - Segment focus
            • 14.5 Bayer AG
              • Bayer AG - Overview
              • Bayer AG - Business segments
              • Bayer AG - Key news
              • Bayer AG - Key offerings
              • Bayer AG - Segment focus
            • 14.6 Cheers Health Inc.
              • Cheers Health Inc. - Overview
              • Cheers Health Inc. - Product / Service
              • Cheers Health Inc. - Key offerings
            • 14.7 DOTSHOTs.in
              • DOTSHOTs.in - Overview
              • DOTSHOTs.in - Product / Service
              • DOTSHOTs.in - Key offerings
            • 14.8 drinkwel LLC
              • drinkwel LLC - Overview
              • drinkwel LLC - Product / Service
              • drinkwel LLC - Key offerings
            • 14.9 Flyby
              • Flyby - Overview
              • Flyby - Product / Service
              • Flyby - Key offerings
            • 14.10 Himalaya Global Holdings Ltd.
              • Himalaya Global Holdings Ltd. - Overview
              • Himalaya Global Holdings Ltd. - Product / Service
              • Himalaya Global Holdings Ltd. - Key offerings
            • 14.11 Rally Labs LLC
              • Rally Labs LLC - Overview
              • Rally Labs LLC - Product / Service
              • Rally Labs LLC - Key offerings
            • 14.12 Unilever PLC
              • Unilever PLC - Overview
              • Unilever PLC - Business segments
              • Unilever PLC - Key offerings
              • Unilever PLC - Segment focus

            15 Appendix

            • 15.1 Scope of the report
              • 15.2 Inclusions and exclusions checklist
                • Inclusions checklist
                • Exclusions checklist
              • 15.3 Currency conversion rates for US$
                • Currency conversion rates for US$
              • 15.4 Research methodology
                • Research methodology
              • 15.5 Data procurement
                • Information sources
              • 15.6 Data validation
                • Data validation
              • 15.7 Validation techniques employed for market sizing
                • Validation techniques employed for market sizing
              • 15.8 Data synthesis
                • Data synthesis
              • 15.9 360 degree market analysis
                • 360 degree market analysis
              • 15.10 List of abbreviations
                • List of abbreviations

              Research Methodology

              Technavio presents a detailed picture of the market by way of study, synthesis, and summation of data from multiple sources. The analysts have presented the various facets of the market with a particular focus on identifying the key industry influencers. The data thus presented is comprehensive, reliable, and the result of extensive research, both primary and secondary.

              INFORMATION SOURCES

              Primary sources

              • Manufacturers and suppliers
              • Channel partners
              • Industry experts
              • Strategic decision makers

              Secondary sources

              • Industry journals and periodicals
              • Government data
              • Financial reports of key industry players
              • Historical data
              • Press releases

              DATA ANALYSIS

              Data Synthesis

              • Collation of data
              • Estimation of key figures
              • Analysis of derived insights

              Data Validation

              • Triangulation with data models
              • Reference against proprietary databases
              • Corroboration with industry experts

              REPORT WRITING

              Qualitative

              • Market drivers
              • Market challenges
              • Market trends
              • Five forces analysis

              Quantitative

              • Market size and forecast
              • Market segmentation
              • Geographical insights
              • Competitive landscape

              Interested in this report?

              Get your sample now to see our research methodology and insights!

              Download Now

              Frequently Asked Questions

              Hangover Cure Products market growth will increase by $ 1710.9 mn during 2024-2028.

              The Hangover Cure Products market is expected to grow at a CAGR of 15.1% during 2024-2028.

              Hangover Cure Products market is segmented by Distribution Channel( Offline, Online, Tablets, Patch) Product Type( Beverages, Capsules/Tablets, Patches, Powders, MEA)

              82 Labs Inc., Abbott Laboratories, AfterDrink Ltd., Bayer AG, Bytox Inc, Cheal, Cheers Health Inc., DOTSHOTs.in, DrinkAde, drinkwel LLC, EZ Lifestyle INC, Flyby, Himalaya Global Holdings Ltd., Kaplan Laboratory LLC, LES Labs, No Days Wasted, Purple Tree Labs, Rally Labs LLC, Toniiq LLC, Unilever PLC are a few of the key vendors in the Hangover Cure Products market.

              APAC will register the highest growth rate of 54% among the other regions. Therefore, the Hangover Cure Products market in APAC is expected to garner significant business opportunities for the vendors during the forecast period.

              US, Canada, Germany, UK, Italy, France, China, India, Japan, Brazil, Egypt, UAE, Oman, Argentina, KSA, UAE, Brazil, Rest of World (ROW)

              • Increasing penetration of hangover cure productsThere are many hangover cure products present in the market. For instance is the driving factor this market.
              • Morning Fresh is one of the top hangover cure products available in India; it offers a wide variety of products with natural ingredients beneficial for the health of the liver and with multiple flavors. Similarly is the driving factor this market.
              • Morning Recovery is the driving factor this market.
              • a major brand in the US is the driving factor this market.
              • is expanding its presence through brick-and-mortar stores is the driving factor this market.
              • including convenience stores and pharmacy stores is the driving factor this market.
              • and online sales channels in the country. Moreover is the driving factor this market.
              • with the growing awareness and availability of hangover cure products is the driving factor this market.
              • their consumption is the driving factor this market.
              • especially among millennials is the driving factor this market.
              • is increasing. This will drive the growth of the market in focus during the forecast period. is the driving factor this market.

              The Hangover Cure Products market vendors should focus on grabbing business opportunities from the Offline segment as it accounted for the largest market share in the base year.
              RIA - Research AI Assistant
              Ask RIA